プロフェッショナルな業務の変革:Amazon Quick が文書作成を数時間から数分に短縮する仕組み
Amazon Quick は、生データと組織ナレッジを連携させることで、ドキュメント作成の機械的作業を自動化し、専門家の戦略的判断に時間を割ける環境を実現する。
キーポイント
業務プロセスの変革
フォーマットやテンプレートの再構築といった機械的な作業から解放され、専門家がドメイン知識に基づいた戦略的判断に集中できるワークフローへ転換を促す。
多様なデータソースとの連携
QuickSight のダッシュボード、S3 データレイク、Redshift、RDS などの生データを直接取得し、リアルタイムで文書へ反映する機能を提供する。
組織固有のナレッジ活用
Quick Spaces を介して組織のコンテキストや用語集を学習させることで、汎用的な出力ではなく、組織に特有の文脈を持つ高品質なドキュメントを生成する。
編集可能な多形式出力
.docx, .xlsx, .pptx, .pdf, .png の 5 つ形式に対応し、静的なスナップショットではなく、数式やレイアウトが維持された完全編集可能なファイルとして提供される。
重要な引用
They do not require the judgment and domain expertise that make you genuinely valuable.
It pulls live data from Amazon Quick Sight dashboards, Amazon Simple Storage Service (Amazon S3) data lakes...
The result is not generic output. It is work that sounds like it came from your organization.
影響分析・編集コメントを表示
影響分析
この発表は、AI が単なるテキスト生成を超え、組織のデータ基盤とナレッジを統合して実務プロセス全体を変革する段階に入ったことを示しています。特に「静的な出力」ではなく「編集可能な生データ」として提供される点は、現場での実用性と信頼性を大幅に高める画期的なアプローチであり、ビジネスインテリジェンス領域における生産性革命の契機となるでしょう。
編集コメント
単なる文書生成ツールの進化ではなく、企業のデータ資産とナレッジを直接活用して業務フローそのものを再定義する実用性の高いソリューションです。
本稿では、Amazon Quick のドキュメントおよび可視化作成機能の仕組み、それらを用いて構築できるもの、そして各役割のプロフェッショナルがこれらをどのように活用して週間の作業時間を数時間分も取り戻しているかについて探ります。
技術的実行から戦略的判断へ
多くの専門職には、時間の相当部分が機械的な実行に費やされるという暗黙の前提があります。レポートの書式設定、同じスプレッドシートテンプレートの再構築、分析結果のスライドデッキへの転記などは、注意と精度を要しますが、真に価値ある判断力やドメイン知識は必要としません。
Quick はこの方程式を変えます。Amazon Quick Sight ダッシュボードから生データを取得し、Amazon Simple Storage Service (Amazon S3) データレイク、Amazon Redshift ウェアハウス、および Amazon Relational Database Service (Amazon RDS) データベースからデータを抽出します。その後、ステークホルダーのレビューに備えた、書式設定されたプロフェッショナルグレードのドキュメントとして組み立てます。
Quick はまた、Quick の組織ナレッジベースである Spaces も活用します。ドキュメントには企業固有の文脈、用語、および組織の知見を反映させることができます。その結果得られるのは汎用的な出力ではありません。まるで貴社の組織から生まれたかのような仕事です。
複数の出力タイプ
Quick におけるドキュメントおよびビジュアル作成は、現在 5 つの出力タイプをサポートしており、それぞれが基本的な生成機能を超えた能力を備えています。これらはデータ認識型でブランドの一貫性を保ち、完全に編集可能なファイルであり、静的なスナップショットではありません。
フォーマット
ファイル形式
主要機能
Word ドキュメント
.docx
構造化された見出し、目次、スタイル設定された表、ヘッダー、フッター、埋め込まれたチャートおよび画像、複数セクションレイアウト。
Excel スプレッドシート
.xlsx
動作する数式、条件付き書式設定、複数のワークシート、実際のデータから作成されたチャート、ピボットテーブル、名前付き範囲。
PowerPoint プレゼンテーション
.pptx
プロフェッショナルなテーマとレイアウト、スピーカーノート、埋め込まれたビジュアル、既存のブランドデックからのテンプレートクローン。
PDF ドキュメント
ヘッダー、フッター、ページ番号、専門的にスタイル設定されたページ、書式設定された表、印刷準備完了出力。
ビジネスビジュアル
.png
インフォグラフィックス、データ可視化、プロセス図、比較チャート、スタンドアロンで埋め込み可能な画像。
これらの出力は完全に編集可能なネイティブファイルです。Excel ワークブックは動作する数式と条件付き書式設定を保持し、PowerPoint デックはスライドマスターとレイアウトを維持し、Word ドキュメントは見出し構造と相互参照を保ちます。デスクトップアプリケーションで開いて再構築することなく作業を継続できます。
仕組み:エンドツーエンドのワークフロー
体験はすべて Quick の会話内完結であり、アプリケーション間の切り替えによる文脈の喪失を回避します。リクエストからダウンロード可能なファイルまでの完全なサイクルは、5 つのステップで完了します:
- 説明 (Describe)。Quick の会話を開き、必要なものを自然言語で記述します。必要に応じて、CSV、Excel、JSON、Word、PDF、PowerPoint のソースファイルをアップロードして、出力を実データに基づかせることができます。
- 確認 (Watch)。Quick が文書を生成し、会話内でリアルタイムの進捗状況が確認できます。
- プレビュー (Preview)。生成された文書は、会話とは別に用意されたプレビューパネルに表示されます。
- refinement (Refine)。2 つの異なる編集パスを使用して反復します。広範な変更にはチャットベースの編集を、特定の箇所の修正と再生成にはインラインコメント機能を使用します。
- ダウンロード (Download)。完成したファイルをネイティブ形式 (.docx, .xlsx, .pptx, .pdf, または .png) でエクスポートできます。
2 つの編集方法、1 つの streamlined ワークフロー
チャットベースの編集
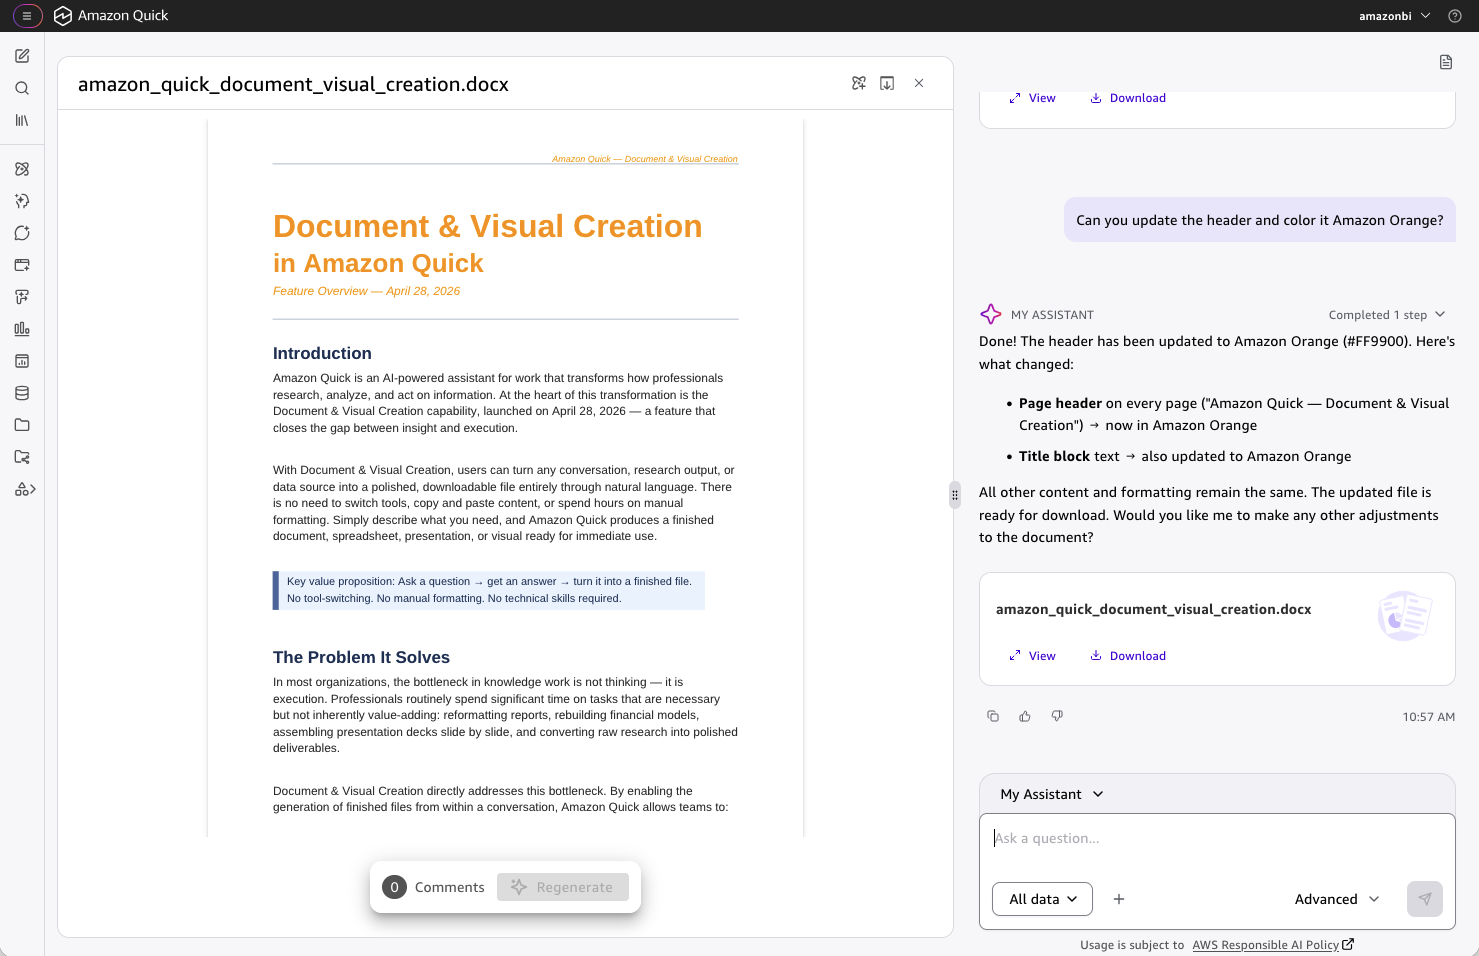
*図 1: チャットベースの編集。文書およびビジュアル作成機能を使用して、ビジュアル作成上の文書を編集します。再帰はバグではありません。
この機能は、文書全体にわたる広範な変更に対して最も適しています。
変更したい内容をフォローアップメッセージに記述してください。図 1 では、ユーザーは「ヘッダーを更新して、Amazon オレンジ色にしていただけますか?」とリクエストしています。Quick はこのリクエストを解釈し、正しい HEX コード(#FF9900)を特定した上で、ページヘッダーとタイトルブロックを一度に更新します。その他のコンテンツや書式はそのまま維持されます。フォローアップは、より広範な指示から具体的な指示まで様々です。「上部にエグゼクティブサマリーを追加する」や「四半期ごとの列を使用するように財務セクションを再構成する」など、各リクエストは変更が必要な部分のみを再生成します。
インラインコメント機能
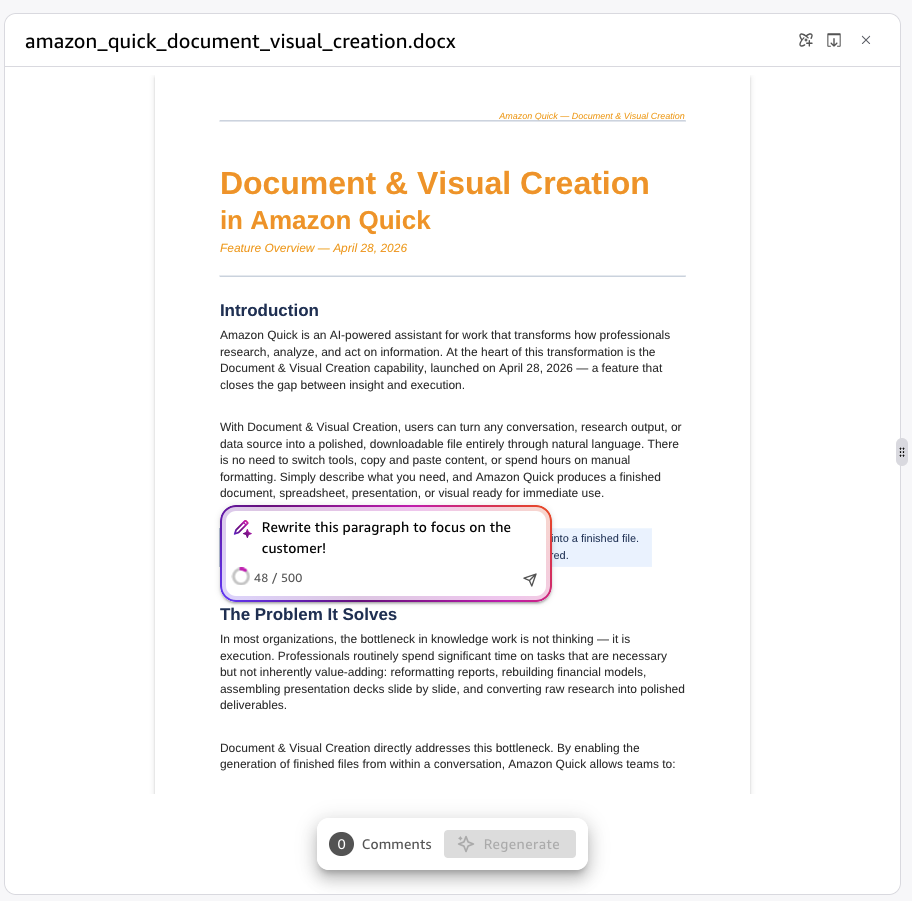
*図 2: インラインコメント機能。プレビュー内の任意のテキストをハイライトして注釈を残すと、Quick がそのセクションを再生成します。外科的な精度で、周囲への影響はゼロです。
この機能は、特定の場所に対するターゲット型の編集に最も適しています。
前述の例では、ユーザーがドキュメントプレビュー内のクリックし、曖昧すぎる記述部分をハイライトします。コメントボックスが開き、ユーザーはその選択部分に対して直接フィードバックを入力します。ここでは「顧客に焦点を当てたようにこの段落を書き直してください」と指示します。その後、「再生成」を選択すると、Quick はその注釈に基づいてハイライトされたセクションのみを再作成し、ドキュメントの他の部分は変更されません。
広く始めて、具体的に仕上げる。チャットベースの編集を使って、初期段階で構造、トーン、レイアウトを確立してください。文書がほぼ完成した段階になったら、インラインコメントに切り替えて特定のセクションを精査・修正します。各反復では、機能している部分は維持し、改善が必要な部分を更新していきます。
テンプレートクローンとブランドテーマ
ドキュメントおよびビジュアル作成は、一般的な人工知能(AI)による文書生成とは異なる 2 つのメカニズムを通じて、この投資への敬意を示します。
PowerPoint テンプレートクローン
既存のブランディングされた .pptx ファイルをテンプレートとしてアップロードします。四半期事業レビュー資料、顧客向け提案資料、または社内全社員向けフォーマットなどです。Quick はスライドレイアウト、テーマフォント、ブランドカラー、および構造パターンを分析します。新しいコンテンツを生成する際、各セクションに最も一致するテンプレートのスライドをクローンし、背景、装飾要素、ロゴ、ビジュアルアイデンティティを保持します。
Excel テンプレートクローン
書式設定されたワークブックをテンプレートとしてアップロードします。Quick はワークブックの構造をクローンし、書式設定と数式を保持したまま、新しいデータで埋め込みます。これは、レイアウトは一定のままだが数値が毎期変化する反復的なレポートに最適です。例えば、月次財務サマリー、週次主要業績評価指標(KPI)トラッカー、四半期パフォーマンスダッシュボードなどが該当します。
Brand theming across supported output types
ブランドカラーと SVG ロゴを含むテーマ設定ファイルをアップロードすると、Quick が Word 文書、Excel スプレッドシート、プレゼンテーション資料、PDF、インフォグラフィックなど、対応するすべての出力タイプに対して自動的に適用します。Quick の会話から生成された文書は、手動でのフォーマット作業なしに、組織のビジュアル基準に完全に一致させることができます。
これらの機能により、ドキュメントや視覚素材の作成が個人利用レベルを超え、企業規模で活用可能なものとなります。1 人のアナリストが会話のスピードで一貫性がありブランド準拠の成果物を生み出すことで、小規模チームが達成できることの範囲そのものが変化します。
Data-aware generation: where accuracy matters most
AI 生成文書に対する最も一般的な批判は、捏造されたデータです。Quick はこれとは異なるアプローチで解決します。ソースデータは CSV、Excel、または JSON として直接アップロードするか、Quick Sight ダッシュボード、Amazon Redshift クラスター、Amazon RDS データベースといった接続済みのデータソースから取得できます。Quick はそのデータを提示された通りに正確に使用します。捏造も、でっち上げられたデータポイントもありません。財務モデルはデータセット内の数値を反映し、ダッシュボードのチャートは実際のメトリクスを示し、コンプライアンスレポートはアップロードしたソースから数値を引き出します。
これがプロフェッショナルグレードの出力の基盤です。機械的な実行、フォーマット、構造、レイアウトは自動的に処理されます。コンテンツの正確性は、あなたが提供するデータに基づいています。その数値が何を意味するかという判断は、あくまであなた自身が行うものです。
Examples of real-world impact
The abstract case for productivity transformation is straightforward. Here's what it looks like in practice.
Sales leadership: quarterly pipeline forecast
A sales leader needed a quarterly pipeline forecast workbook for a regional business review. This kind of document typically consumes a full workday. It requires pulling data from the customer relationship management (CRM) system, cleaning it for the spreadsheet, building pivot tables, formatting charts, and cross-referencing regional targets.
With Quick, the same output took 45 minutes, producing a multi-sheet workbook with live CRM data, conditional formatting that highlighted at-risk deals, and auto-updating charts for each region. The remaining time went to the analysis itself, evaluating which deals warranted senior attention before the review, rather than building the infrastructure to surface them.
The workbook was editable and formula-driven. When pipeline projections shifted two days before the review, updates propagated automatically. No rebuilding, no reformatting.
財務チーム:採用シナリオ全体での ROI モデリング
ある財務チームは、複数のソフトウェア採用シナリオにわたる投資対効果(ROI)をモデル化する必要がありました。このワークブックには、感応度分析表、正味現在価値(NPV)の計算、および異なる採用率におけるシナリオ分析が含まれていました。ゼロからこのモデルを構築するには、財務モデリングの専門知識に加え、数式の構築と検証に多大な時間を要します。
Quick は、接続された Amazon Redshift データウェアハウスから過去の費用データを抽出し、Amazon RDS に保存された支出パターンに対して初期仮定を検証することで、初期モデルを生成しました。このモデルには、正味 NPV と内部収益率(IRR)の計算、5 つの採用レベルにおける結果を示す感応度分析表、およびシナリオ比較チャートが含まれていました。
チームの時間は、数式のデバッグや書式設定から、財務モデリングにおいて専門知識を要する仮定テストへとシフトしました。彼らは、手動で構築する場合に特定するのが困難だった 2 つのシナリオを感応度分析で見つけ出しました。まず、保守的な採用仮定の下では予想よりも早く現れる損益分岐点です。次に、十分にモデル化されていなかった統合コストに起因し、高い採用率において発生する ROI の急落(ROI クリフ)です。
各役割における応用例
以下の例は、実用的な応用の範囲を示しています。
役割
具体的な応用例
Sales
CRM データをリアルタイムで反映し、取引の重み付け計算を行うことで、販売パイプライン予測ワークブックを作成。価格表と競合ポジショニングを含むブランド化された顧客向け提案書。パフォーマンスダッシュボードから構築した四半期事業レビュー資料。トレンドチャートと取引ステージ別内訳を含む勝敗分析レポート。
Finance
複数のシナリオにわたる感応度テーブルを備えた ROI および NPV モデル。接続されたデータウェアハウスから実績値を取得する予算差異報告書。チャート、脚注、期間対比比較を含む取締役会向け財務サマリー。構造化されたデータトレイルと照合テーブルを備えた監査準備用ワークブック。
Marketing
チャネル別 ROI 内訳を含むキャンペーンパフォーマンスレポート。ブランド化されたコンテンツブリーフおよびクリエイティブ戦略資料。ポジショニングチャートとマトリクスを用いた競合環境分析。登録データ、エンゲージメント指標、フォローアップ推奨事項を含むイベント振り返りプレゼンテーション。
Operations
スループット、不良率、キャパシティ利用率を追跡する生産ダッシュボード。ボトルネックとリードタイムを強調したサプライチェーン分析レポート。ワークフロー図と標準作業手順書を含むプロセスドキュメンテーション。コスト、品質、納期パフォーマンスを比較するベンダースコアカード。
法務
アップロードされたドキュメントから主要な条項、義務、更新日を取り出す契約サマリーワークブック。構造化された発見事項テーブルと是正追跡を備えた規制コンプライアンスレポート。エグゼクティブサマリー、リスク評価、推奨マトリックスを含むポリシーブリーフ。複数のワークストリームにわたる事件データを統合する事案ステータスレポート。
あなたの組織にとっての意味
個々の生産性向上は確かに実証可能ですが、組織への影響はより広範です。
ドキュメント作成がボトルネックでなくなれば、小規模チームでも以前は大規模なチームが必要だった出力品質と量を維持できます。ブランドに整合しデータ精度の高い成果物が、デザインスキルや深い技術的専門知識を持つ一部の人間だけでなく、広く知識労働者に利用可能になれば、組織全体の品質の底上げが実現します。
この機能は現在すでに利用可能で、おそらく既に使用している AWS データソースと接続されています。Quick Sight ダッシュボード、Amazon S3 データレイク、Amazon Redshift ウェアハウス、または Amazon RDS データベースをドキュメントソースとして使用する際に追加の設定は不要です。インフラストラクチャはすでに存在しています。変化するのは、それを使って何ができるかという点です。
おそらく最も重要なのは、反復的なワークフローにより学習曲線が会話型になることです。新しいアプリケーションの使い方を覚える必要はありません。自分が何を望んでいるかを説明する方法を知っていれば十分です。これは多くの知識労働者がすでに持っているスキルです。
新規ユーザー向けのベストプラクティス
必要なものを説明する際は、コンテンツ、構造、フォーマット要件について具体的に記述してください。提供するコンテキストが多ければ多いほど、最初のドラフトが意図した結果に近づきます。生成されたプレースホルダーではなく実際の数値から文書を作成したい場合は、CSV、Excel、または JSON ファイルなどのソースデータをアップロードしてください。組織の基準に合わせる必要があるプレゼンテーションやスプレッドシートについては、既存のブランディング済みデッキやワークブックをテンプレートとしてアップロードしてください。最後に、このプロセスは反復的なものとして捉えてください。最初のドラフトから始め、フォローアップメッセージまたはインラインコメントを使用して改善します。各パスごとに出力は急速に向上します。
結論
本稿では、Amazon Quick の文書およびビジュアル作成機能が、時間のかかる生産作業を数分で refinement してダウンロードできる会話型のドラフトに変換する方法を探りました。チャットベースの編集とインラインコメントがどのように連携するか、テンプレートクローンがブランド基準をどのように維持するか、Quick が接続されたデータソースに基づいて出力を grounding するか、そして営業、財務、マーケティング、オペレーション、法務にわたるチームがこれらの機能をどのように適用しているかについて検討しました。
文書作成者から戦略的思考者への転換は、一度に起こるものではありません。それは会話を通じて徐々に進み、機械的な作業が Quick に移り、判断を要する作業はあなた自身に残されるというプロセスです。
この転換はさらに先へ進むところです。現在、Quick は会話ウィンドウであなたと対話しますが、本シリーズの次回は、前節で説明した知能が単一のアプリケーションから完全に飛び出し、どのようなことが起こるのかを探ります。それは、知識労働者がすでに一日を過ごす生産性ツールの内部に直接埋め込まれるのです。Quick の元へ来るのではなく、Quick があなたのもとへやってきます。続報をお楽しみに。
文書およびビジュアルの作成機能は、Amazon Quick が一般提供されているすべての AWS リージョンで利用可能です。まずは 30 日間無料で Quick をお試しください。詳細については、Amazon Quick の詳細ページおよびAWS Quick 公式ドキュメントをご覧ください。
著者について
 image
image
アーサー(アート)・チャン
アーサー(アート)・チャンは、AWS の Amazon Quick におけるシニア・ワールドワイド・スペシャリスト SA です。彼は、AI を活用した生産性ツールが組織の働き方をどのように変革できるかを、顧客や現場チームに理解してもらう役割を担っています。勤務時間外には、次のマラソンに向けて距離を記録するか、農場で汗を流して作業をするのが彼の楽しみです。
原文を表示
In this post, we explore how the Amazon Quick document and visualization creation capabilities work, what you can build with them, and how professionals across roles are using them to reclaim hours of their workweek.
From technical execution to strategic judgment
Most professional roles carry an unspoken assumption that a significant portion of your time will go toward mechanical execution. Formatting reports, rebuilding the same spreadsheet templates, and copying analysis findings into slide decks all require attention and precision. They do not require the judgment and domain expertise that make you genuinely valuable.
Quick changes that equation. It pulls live data from Amazon Quick Sight dashboards, Amazon Simple Storage Service (Amazon S3) data lakes, Amazon Redshift warehouses, and Amazon Relational Database Service (Amazon RDS) databases. It then assembles that data into formatted, professional-grade documents ready for stakeholder review.
Quick also draws on Spaces, the Quick organizational knowledge bases. Documents can reflect company-specific context, terminology, and institutional knowledge. The result is not generic output. It is work that sounds like it came from your organization.
Multiple output types
Document and visual creation in Quick currently supports five output types, each with capabilities that go well beyond basic generation. These are data-aware, brand-consistent, fully editable files, not static snapshots.
Format
File type
Key capabilities
Word document
.docx
Structured headings, tables of contents, styled tables, headers, footers, embedded charts and images, multi-section layout.
Excel spreadsheet
.xlsx
Working formulas, conditional formatting, multiple worksheets, charts built from actual data, pivot tables, named ranges.
PowerPoint presentation
.pptx
Professional themes and layouts, speaker notes, embedded visuals, template cloning from existing branded decks.
PDF document
Headers, footers, page numbers, professionally styled pages, formatted tables, print-ready output.
Business visual
.png
Infographics, data visualizations, process diagrams, comparison charts, standalone embeddable images.
These outputs are fully editable native files. Excel workbooks retain working formulas and conditional formatting, PowerPoint decks preserve slide masters and layouts, and Word documents maintain heading structures and cross-references. You can open them in their desktop applications and continue working without rebuilding.
How it works: the end-to-end workflow
The experience stays entirely within the Quick conversation, no switching between applications, avoiding context loss. The full cycle, from request to downloadable file, happens in five steps:
- Describe. Open a Quick conversation and describe what you need in natural language. Optionally upload source files, CSV, Excel, JSON, Word, PDF, or PowerPoint to ground the output in real data.
- Watch. Quick generates the document with real-time progress updates visible in the conversation.
- Preview. The generated document appears in a dedicated preview panel alongside the conversation.
- Refine. Iterate using two distinct editing paths: Chat-based editing for broad changes, or inline commenting for targeted edits with regeneration.
- Download. Export the finished file in its native format: .docx, .xlsx, .pptx, .pdf, or .png.
Two ways to edit, one streamlined workflow
Chat-based editing
*Figure 1: Chat-based editing. Using document and visual creation to edit a document on visual creation. Recursion is not a bug.*
This feature is best for broad, document-wide changes.
Type what you want changed in a follow-up message. In Figure 1, the user requests: “Can you update the header and color it Amazon Orange?” Quick interprets the request, identifies the correct hex code (#FF9900), and updates the page header and title block in one step. Other content and formatting stays untouched. Follow-ups can be equally broad or specific: “Add an executive summary at the top,” or “Restructure the financial section with quarterly columns instead of annual.” Each request regenerates only what needs to change.
Inline commenting
*Figure 2: Inline commenting. Highlight any text in the preview, leave a note, and Quick regenerates that section. Surgical precision, zero collateral damage.*
This feature is best for targeted, location-specific edits.
In the preceding example, the user clicks in the document preview and highlights a passage that is too vague. A comment box opens where the user types feedback directly on the selection. In this case: “Rewrite the paragraph to focus on the customer!” The user then chooses Regenerate, and Quick rewrites only that highlighted section based on the note. The rest of the document stays unchanged.
Start broad, get specific. *Use chat-based editing to establish structure, tone, and layout in early passes. Switch to inline comments to refine specific sections after the document is substantially right. Each iteration preserves what’s working and updates what isn’t.*
Template cloning and brand theming
Document and visual creation respects that investment through two mechanisms that distinguish it from generic artificial intelligence (AI) document generation.
PowerPoint template cloning
Upload an existing branded .pptx file as a template, a quarterly business review deck, a customer pitch, or an internal all-hands format. Quick analyzes the slide layouts, theme fonts, brand colors, and structural patterns. When generating new content, it clones the template slides that best match each section, preserving backgrounds, decorative elements, logos, and visual identity.
Excel template cloning
Upload a formatted workbook as a template. Quick clones the workbook structure, preserves formatting and formulas, and populates it with new data. This is ideal for recurring reports where the layout stays constant but the numbers change every period, such as monthly financial summaries, weekly key performance indicator (KPI) trackers, and quarterly performance dashboards.
Brand theming across supported output types
Upload a theme configuration with your brand colors and SVG logos, and Quick applies them automatically across Word documents, Excel spreadsheets, presentations, PDFs, and infographics. Documents generated from Quick conversations can match your organization’s visual standards, without manual formatting work.
These capabilities make document and visual creation enterprise-ready, not just individually useful. A single analyst producing consistent, on-brand deliverables at the speed of conversation changes what a small team can accomplish.
Data-aware generation: where accuracy matters most
The most common complaint about AI-generated documents is fabricated data. Quick solves this differently. Source data can be uploaded directly as CSV, Excel, or JSON, or drawn from connected data sources like Quick Sight dashboards, Amazon Redshift clusters, or Amazon RDS databases. Quick uses that data exactly as given. No fabrication, no invented data points. The financial model reflects the numbers in your dataset. The dashboard chart reflects your actual metrics. The compliance report pulls the figures from your uploaded source.
This is the foundation of professional-grade output. The mechanical execution, formatting, structure, and layout are handled automatically. The accuracy of the content is grounded in the data you provide. The judgment about what those numbers mean remains yours.
Examples of real-world impact
The abstract case for productivity transformation is straightforward. Here’s what it looks like in practice.
Sales leadership: quarterly pipeline forecast
A sales leader needed a quarterly pipeline forecast workbook for a regional business review. This kind of document typically consumes a full workday. It requires pulling data from the customer relationship management (CRM) system, cleaning it for the spreadsheet, building pivot tables, formatting charts, and cross-referencing regional targets.
With Quick, the same output took 45 minutes, producing a multi-sheet workbook with live CRM data, conditional formatting that highlighted at-risk deals, and auto-updating charts for each region. The remaining time went to the analysis itself, evaluating which deals warranted senior attention before the review, rather than building the infrastructure to surface them.
The workbook was editable and formula-driven. When pipeline projections shifted two days before the review, updates propagated automatically. No rebuilding, no reformatting.
Finance team: ROI modeling across adoption scenarios
A finance team needed to model return on investment (ROI) across multiple software adoption scenarios. The workbook required sensitivity tables, net present value (NPV) calculations, and scenario analysis at different adoption rates. Building that model from scratch requires both financial modeling expertise and significant time investment in formula construction and validation.
Quick generated the initial model by pulling historical cost data from a connected Amazon Redshift data warehouse and validating initial assumptions against Amazon RDS-stored spending patterns. The model included working NPV and internal rate of return (IRR) calculations, a sensitivity table showing outcomes at five adoption levels, and scenario comparison charts.
The team’s time shifted from formula debugging and formatting to assumption testing, the part of financial modeling that requires their expertise. They found two scenarios in the sensitivity analysis that would have been difficult to identify in a manual build. First, a breakeven point that appeared earlier than expected under conservative adoption assumptions. Second, an ROI cliff at higher adoption rates tied to integration costs that hadn’t been fully modeled.
Applications across roles
The following examples illustrate the range of practical applications.
Role
Example applications
Sales
Pipeline forecast workbooks with live CRM data and weighted deal calculations. Branded client-facing proposals with pricing tables and competitive positioning. Quarterly business review decks built from performance dashboards. Win/loss analysis reports with trend charts and deal-stage breakdowns.
Finance
ROI and NPV models with sensitivity tables across multiple scenarios. Budget variance reports pulling actuals from connected data warehouses. Board-ready financial summaries with charts, footnotes, and period-over-period comparisons. Audit-preparation workbooks with structured data trails and reconciliation tables.
Marketing
Campaign performance reports with channel-level ROI breakdowns. Branded content briefs and creative strategy decks. Competitive landscape analyses with positioning charts and matrices. Event recap presentations with registration data, engagement metrics, and follow-up recommendations.
Operations
Production dashboards tracking throughput, defect rates, and capacity utilization. Supply chain analysis reports highlighting bottlenecks and lead times. Process documentation with workflow diagrams and standard operating procedures. Vendor scorecards comparing cost, quality, and delivery performance.
Legal
Contract summary workbooks extracting key terms, obligations, and renewal dates from uploaded documents. Regulatory compliance reports with structured finding tables and remediation tracking. Policy briefs with executive summaries, risk assessments, and recommendation matrices. Matter status reports consolidating case data across multiple workstreams.
What this means for your organization
The individual productivity gains are real and measurable, but the organizational implications are broader.
When document production is no longer a bottleneck, smaller teams can maintain the output quality and volume that previously required larger ones. When brand-consistent, data-accurate deliverables are available to knowledge workers broadly, not only to those with design skills or deep technical expertise, the quality floor across the organization rises.
The capability is available now and connected to AWS data sources your organization likely already uses. You don’t need additional configuration to start using Quick Sight dashboards, Amazon S3 data lakes, Amazon Redshift warehouses, or Amazon RDS databases as document sources. The infrastructure is already there. What changes is what you can do with it.
Perhaps most importantly, the iterative workflow means the learning curve is conversational. You don’t need to know how to use a new application. You need to know how to describe what you want. That’s a skill most knowledge workers already have.
Best practices for new users
Be specific about content, structure, and formatting requirements when describing what you need. The more context you provide, the closer the first draft lands to your intended result. Upload source data such as CSV, Excel, or JSON files when you want documents built from real numbers rather than generated placeholders. For presentations and spreadsheets that need to match organizational standards, upload your existing branded deck or workbook as a template. Finally, treat the process as iterative: start with a first draft and refine using follow-up messages or inline comments. The output improves quickly with each pass.
Conclusion
In this post, we explored how the document and visual creation capabilities in Amazon Quick turn time-consuming production work into conversational drafts you can refine and download in minutes. We looked at how chat-based editing and inline commenting work together, how template cloning preserves brand standards, how Quick grounds output in your connected data sources, and how teams across sales, finance, marketing, operations, and legal apply these capabilities.
The shift from document producer to strategic thinker doesn’t happen all at once. It happens conversation by conversation, as the mechanical work moves to Quick and the judgment work stays with you.
That shift is about to go further. Right now, Quick meets you in a conversation window. The next installment in this series explores what happens when the intelligence described in the preceding sections breaks out of a single application entirely. It embeds itself directly inside the productivity tools where knowledge workers already spend their day. Rather than coming to Quick, Quick comes to you. Stay tuned.
Document and visual creation is available in all AWS Regions where Amazon Quick is generally available. To get started, try Quick for free for 30 days. For more information, visit the Amazon Quick detail page and the Amazon Quick documentation.
About the author
Arthur (Art) Chan
Arthur (Art) Chan is a Senior Worldwide Specialist SA for Amazon Quick at AWS. He helps customers and field teams understand how AI-powered productivity tools can reshape the way organizations work. When he’s not on the clock, he’s either logging miles for his next marathon or getting his hands dirty on his farm.
関連記事
今日のまとめ
AI日報で今日の重要ニュースをまとめ読み