ログエクスプローラーにおけるマルチベクトル攻撃の調査
CloudflareはLog Explorerに14の新しいデータセットを統合し、アプリケーション層、ネットワーク層、ゼロトラストアクセスイベントのテレメトリーを相関させることで、多面的攻撃の検出時間を短縮するセキュリティフォレンジック機能を強化した。
キーポイント
多面的攻撃への対応強化
Cloudflare Log Explorerは14の新しいデータセットを統合し、アプリケーション層、ネットワーク層、ゼロトラストアクセスイベントのテレメトリーを相関させることで、複雑な多層攻撃の検出を可能にする。
包括的なログ収集と分析
HTTPリクエスト、ファイアウォールイベント、DNSログ、NELレポート、Spectrumイベント、Page Shield、Zarazイベントなど、ゾーンスコープのログを一元管理し、迅速な調査を実現する。
セキュリティフォレンジックの効率化
攻撃の全容を把握するための360度の可視性を提供し、平均検出時間(MTTD)を大幅に短縮することで、セキュリティチームの調査効率を向上させる。
エッジでの包括的ロギング
Cloudflareがユーザーとサーバーの間に位置するエッジで全てのイベントを記録するため、インフラに到達する前のリクエストも含めた完全なログ収集が可能。
Log Explorerの多様なログカテゴリと監視対象
アカウントスコープのログには、アクセスリクエスト、監査ログ、CASB検出結果、ブラウザ分離ログ、デバイスポスチャ結果など、内部セキュリティ、ゼロトラスト、ネットワーク活動を監視するための複数のカテゴリが含まれています。
ネットワークとアプリケーション層の包括的な可視性
DNSファイアウォール、ゲートウェイ(DNS/HTTP/ネットワーク)、Magic IDS検出、ネットワークアナリティクスログなどを通じて、マルウェア通信、不正なトラフィック、DDoS攻撃など、さまざまな攻撃ベクトルを検出できます。
攻撃段階の特定
Log Explorerは偵察、侵入、内部移動など攻撃の各段階で悪意のある活動を特定できる。HTTPリクエストやIDSログで偵察活動を検出し、ネットワーク分析ログで陽動攻撃を確認できる。
影響分析・編集コメントを表示
影響分析
この記事は、現代のサイバー攻撃が多面的・多層的であるという現実に対応するための具体的なソリューションを示している。CloudflareのLog Explorer強化により、セキュリティチームはより迅速かつ効果的なフォレンジック調査が可能になり、業界全体の脅威検出能力の向上に寄与する可能性がある。
編集コメント
セキュリティ分野におけるログ分析の重要性を具体的な機能強化で示した実用的な記事。AI技術の直接的な言及は少ないが、データ相関分析の観点からAI/ML応用の基盤となるインフラ整備として評価できる。
サイバーセキュリティの世界では、単一のデータポイントが全体像を語ることはほとんどありません。現代の攻撃者は単に正面玄関をノックするだけではなく、あなたのAPIを探り、チームの注意をそらすためにネットワークを「ノイズ」で溢れさせ、盗まれた認証情報を使用してアプリケーションやサーバーに滑り込もうと試みます。
これらのマルチベクトル攻撃を阻止するには、全体像が必要です。Cloudflare Log Explorerを使用してセキュリティフォレンジックを実施することで、CloudflareのアプリケーションサービスとCloudflare One製品ポートフォリオの全表面をカバーする14の新しいデータセットの統合を通じて、360度の可視性を得ることができます。アプリケーション層のHTTPリクエスト、ネットワーク層のDDoSおよびファイアウォールログ、Zero Trust Accessイベントからのテレメトリを相関させることで、セキュリティアナリストは平均検出時間(MTTD)を大幅に短縮し、洗練された多層的な攻撃を効果的に暴き出すことができます。
Log Explorerがセキュリティチームに迅速で深いフォレンジックのための究極の状況をどのように提供するかについて、さらに学ぶために読み進めてください。
あなたのスタック全体のフライトレコーダー
現代のデジタル環境では、複数の攻撃ベクトルを使用する敵から防御するために、深く相関したテレメトリが必要です。生ログはアプリケーションの「フライトレコーダー」として機能し、すべての単一のインタラクション、攻撃試行、パフォーマンスのボトルネックを捕捉します。そして、Cloudflareがユーザーとサーバーの間のエッジに位置しているため、これらのイベントはすべて、リクエストがあなたのインフラストラクチャに到達する前にログに記録されます。
Cloudflare Log Explorerはこれらのログを統一されたインターフェースに集約し、迅速な調査を可能にします。
サポートされるログタイプ
ゾーンスコープのログ
焦点: ウェブサイトトラフィック、セキュリティイベント、エッジパフォーマンス。
HTTPリクエスト
最も包括的なデータセットとして、すべてのアプリケーション層トラフィックの「主要記録」として機能し、セッション活動、エクスプロイト試行、ボットパターンの再構築を可能にします。
ファイアウォールイベント
ブロックまたはチャレンジされた脅威の重要な証拠を提供し、アナリストが攻撃を遮断した特定のWAFルール、IPレピュテーション、またはカスタムフィルターを特定できるようにします。
DNSログ
権威エッジで解決されたすべてのクエリを追跡することで、キャッシュポイズニング試行、ドメインハイジャック、インフラストラクチャレベルの偵察を特定します。
NEL(ネットワークエラーロギング)レポート
クライアント側のブラウザエラーを追跡することで、調整されたレイヤー7 DDoS攻撃と正当なネットワーク接続問題を区別します。
Spectrumイベント
非ウェブアプリケーションの場合、これらのログはL4トラフィック(TCP/UDP)の可視性を提供し、SSH、RDP、またはカスタムゲームトラフィックなどのプロトコルに対する異常またはブルートフォース攻撃の特定に役立ちます。
Page Shield
JavaScript、アウトバウンド接続など、サイトのクライアント側環境への不正な変更を追跡および監査します。
Zarazイベント
サードパーティツールとトラッカーがユーザーデータとどのように相互作用しているかを調べます。これは、プライバシーコンプライアンスの監査と不正なスクリプト動作の検出に不可欠です。
アカウントスコープのログ
焦点: 内部セキュリティ、Zero Trust、管理変更、ネットワーク活動。
アクセスリクエスト
IDベースの認証イベントを追跡し、どのユーザーが特定の内部アプリケーションにアクセスしたか、およびそれらの試行が承認されたかどうかを判断します。
監査ログ
Cloudflareダッシュボード内の構成変更の痕跡を提供し、不正な管理アクションまたは変更を特定します。
CASB所見
SaaSアプリケーション(Google DriveやMicrosoft 365など)内のセキュリティ設定ミスとデータリスクを特定し、不正なデータ流出を防止します。
Magic Transit / IPSecログ
ネットワークエンジニアがネットワークレベル(L3)の監視(トンネルの健全性の確認やBGPルーティング変更の表示など)を実行するのに役立ちます。
ブラウザ分離ログ
分離されたブラウザセッション内のユーザーアクション(例: コピー&ペースト、印刷、ファイルアップロード)を追跡し、信頼できないサイトでのデータ漏洩を防止します。
デバイスポスチャ結果
ネットワークに接続するデバイスのセキュリティ健全性とコンプライアンスステータスを詳細に説明し、侵害されたまたは非準拠のエンドポイントを特定するのに役立ちます。
DEXアプリケーションテスト
ユーザーの視点からアプリケーションパフォーマンスを監視し、セキュリティ関連の停止と標準的なパフォーマンス低下を区別するのに役立ちます。
DEXデバイスステートイベント
ユーザーデバイスの物理的状態に関するテレメトリを提供し、ハードウェアまたはOSレベルの異常と潜在的なセキュリティインシデントを相関させるのに有用です。
DNSファイアウォールログ
DNSファイアウォールを介してフィルタリングされたDNSクエリを追跡し、既知の悪意のあるドメインまたはコマンド&コントロール(C2)サーバーとの通信を特定します。
メールセキュリティアラート
ゲートウェイで検出された悪意のあるメール活動とフィッシング試行をログに記録し、メールベースの侵入ベクトルの発生源を追跡します。
ゲートウェイDNS
ネットワーク上のユーザーによって行われたすべてのDNSクエリを監視し、シャドーIT、マルウェアコールバック、またはドメイン生成アルゴリズム(DGA)を特定します。
ゲートウェイHTTP
暗号化および非暗号化のウェブトラフィックの完全な可視性を提供し、隠されたペイロード、悪意のあるファイルダウンロード、または不正なSaaS使用を検出します。
ゲートウェイネットワーク
L3/L4ネットワークトラフィック(非HTTP)を追跡し、不正なポート使用、プロトコル異常、またはネットワーク内の横移動を特定します。
IPSecログ
暗号化されたサイト間トンネルのステータスとトラフィックを監視し、安全なネットワーク接続の完全性と可用性を確保します。
Magic IDS検出
侵入検知シグネチャとの一致を表面化させ、調査者に既知のエクスプロイトパターンまたはネットワークを通過するマルウェア動作について警告します。
ネットワークアナリティクスログ
パケットレベルのデータへの高レベルの可視性を提供し、特定のインフラストラクチャを標的とした大規模なDDoS攻撃または異常なトラフィックスパイクを特定します。
シンクホールHTTPログ
「シンクホール化された」IPアドレスに向けられたトラフィックを捕捉し、どの内部デバイスが既知のボットネットインフラストラクチャとの通信を試みているかを確認します。
WARP構成変更
エンドユーザーデバイス上のWARPクライアント設定の変更を追跡し、セキュリティエージェントが改ざんまたは無効化されていないことを確認します。
WARPトグル変更
ユーザーがセキュアな接続性を有効または無効にしたときを特にログに記録し、デバイスが保護されていない可能性があった期間を特定するのに役立ちます。
Zero Trustネットワークセッションログ
認証されたユーザーセッションの期間とステータスをログに記録し、保護された境界内でのユーザーのアクセスの完全なライフサイクルをマッピングします。
Log Explorerはあらゆる段階で悪意のある活動を特定できます
HTTPリクエスト、ファイアウォールイベント、DNSログを使用して、トラフィックがあなたの公開プロパティにどのように到達しているかを正確に確認するための詳細なアプリケーション層の可視性を得ます。アクセスリクエスト、ゲートウェイログ、監査ログを使用して内部の動きを追跡します。認証情報が侵害された場合、彼らがどこに行ったかがわかります。Magic IDSおよびネットワークアナリティクスログを使用して、プライベートネットワーク内での大規模な攻撃と「東西」の横移動を発見します。
偵察を特定する
攻撃者はスキャナーやその他のツールを使用して、侵入点、隠しディレクトリ、またはソフトウェアの脆弱性を探します。これを特定するために、Log Explorerを使用して、単一のIPから来るEdgeResponseStatusコード401、403、または404のhttp_requests、または機密性の高いパス(例: /.env、/.git、/wp-admin)へのリクエストをクエリできます。
さらに、magic_ids_detectionsログを使用して、ネットワーク層でのスキャンを特定することもできます。これらのログは、ネットワークを標的とした脅威へのパケットレベルの可視性を提供します。標準的なHTTPログとは異なり、これらのログはネットワーク層およびトランスポート層(IP、TCP、UDP)でのシグネチャベースの検出に焦点を当てています。短時間で単一のSourceIPが広範囲のDestinationPort値にわたって複数のユニークな検出をトリガーしているケースを発見するためにクエリを実行します。Magic IDSシグネチャは、NmapスキャンやSYNステルススキャンなどの活動を特にフラグ付けできます。
陽動を確認する
攻撃者が偵察を実施している間、彼らは同時にネットワークフラッドでこれを偽装しようとするかもしれません。ネットワークアナリティクスログにピボットして、大規模な攻撃が煙幕として使用されているかどうかを確認します。
接近を特定する
攻撃者が潜在的な脆弱性を特定すると、彼らは武器の作成を開始します。攻撃者は悪意のあるペイロード(例: SQLインジェクションまたは大きな/破損したファイルアップロード)を送信して脆弱性を確認します。http_requestsおよび/またはfw_eventsをレビューして、トリガーされたCloudflare検知ツールを特定します。Cloudflareはこれらのデータセットにセキュリティシグナルをログに記録し、WAFAttackScore、WAFSQLiAttackScore、FraudAttack、ContentScanJobResultsなどのフィールドを使用して悪意のあるペイロードを含むリクエストを簡単に特定できます。これらのフィールドを完全に理解するために、当社のドキュメントをレビューしてください。fw_eventsログは、action、source、ruleIDフィールドを調べることで、これらのリクエストがCloudflareの防御を通過したかどうかを判断するために使用できます。Cloudflareのマネージドルールはデフォルトでこれらのペイロードの多くをデフォルトでブロックします。アプリケーションが保護されているかどうかを知るために、アプリケーションセキュリティの概要をレビューしてください。

現在のゾーンでマネージドルールが有効になっていない場合にセキュリティ概要に表示されるマネージドルールインサイトを示しています
IDを監査する
その不審なIPはログインに成功しましたか?ClientIPを使用してaccess_requestsを検索します。機密性の高い内部アプリに対して「Decision: Allow」が表示された場合、侵害されたアカウントがあることがわかります。
流出を阻止する(データ流出)
攻撃者は、機密データ(パスワードやSSHキーなど)をDNSクエリにエンコードすることで、ファイアウォールをバイパスするためにDNSトンネリングを使用することがあります。google.comのような通常のリクエストの代わりに、ログには長いエンコードされた文字列が表示されます。以下のフィールドを調べて、ユニークで長く、エントロピーの高いサブドメインに対する異常に大量のクエリを探してください: QueryName: h3ldo293js92.example.com のような文字列を探します, QueryType: ペイロードを運ぶためにTXT、CNAME、またはNULLレコードを使用することが多いです, ClientIP: 単一の内部ホストが何千ものこのようなユニークなリクエストを生成しているかどうかを特定します。
さらに、攻撃者は機密データを非標準プロトコル内に隠したり、一般的なプロトコル(DNSやICMPなど)を異常な方法で使用して標準的なファイアウォールをバイパスしようとする可能性があります。magic_ids_detectionsログをクエリし、SignatureMessage内の「ICMPトンネリング」や「DNSトンネリング」の検出など、プロトコル異常をフラグするシグネチャを探すことで、これを発見できます。
ゼロデイ脆弱性を調査している場合でも、高度なボットネットを追跡している場合でも、必要なデータはすぐに手に入ります。
データセット間の相関
複数の同時検索間でピボットすることで、複数のデータセットにわたる悪意のあるアクティビティを調査します。Log Explorerでは、新しいタブ機能を使用して、複数のクエリを同時に操作できるようになりました。タブを切り替えて異なるデータセットをクエリしたり、クエリ結果を介したフィルタリングを使用してクエリをピボットおよび調整したりできます。
複数のCloudflareログソースにわたってデータを相関させることで、単独で見ると良性に見える洗練された多段階攻撃を検出できます。このクロスデータセット分析により、偵察からデータ流出までの完全な攻撃チェーンを確認できます。
セッションハイジャック(トークン盗難)
シナリオ: ユーザーがCloudflare Accessを介して認証しますが、その後のHTTP_requestトラフィックはボットのように見えます。
ステップ1: http_requestsで高リスクセッションを特定します。
SELECT RayID, ClientIP, ClientRequestUserAgent, BotScore
FROM http_requests
WHERE date = '2026-02-22'
AND BotScore < 20
LIMIT 100
ステップ2: RayIDをコピーし、access_requestsを検索して、その疑わしいボットアクティビティに関連付けられているユーザーアカウントを確認します。
SELECT Email, IPAddress, Allowed
FROM access_requests
WHERE date = '2026-02-22'
AND RayID = 'INSERT_RAY_ID_HERE'
フィッシング後のC2ビーコン
シナリオ: 従業員がフィッシングメール内のリンクをクリックし、その結果ワークステーションが侵害されました。このワークステーションは、既知の悪意のあるドメインに対してDNSクエリを送信し、その後直ちにIDSアラートをトリガーします。
ステップ1: 違反についてemail_security_alertsを調べてフィッシング攻撃を見つけます。
SELECT Timestamp, Threatcategories, To, Alertreason
FROM email_security_alerts
WHERE date = '2026-02-22'
AND Threatcategories LIKE 'phishing'
ステップ2: Accessログを使用して、ユーザーのメールアドレス(To)をそのIPアドレスに関連付けます。
SELECT Email, IPAddress
FROM access_requests
WHERE date = '2026-02-22'
ステップ3: gateway_dnsログで、特定の悪意のあるドメインをクエリしている内部IPを見つけます。
SELECT SrcIP, QueryName, DstIP,
FROM gateway_dns
WHERE date = '2026-02-22'
AND SrcIP = 'INSERT_IP_FROM_PREVIOUS_QUERY'
AND QueryName LIKE '%malicious_domain_name%'
ラテラルムーブメント(Access → ネットワークプロービング)
シナリオ: ユーザーがZero Trustを介してログインし、その後内部ネットワークのスキャンを試みます。
ステップ1: access_requestsで予期しない場所からの成功したログインを見つけます。
SELECT IPAddress, Email, Country
FROM access_requests
WHERE date = '2026-02-22'
AND Allowed = true
AND Country != 'US' -- あなたの本社国に置き換えてください
ステップ2: そのIPAddressがmagic_ids_detectionsでネットワークレベルのシグネチャをトリガーしているかどうかを確認します。
SELECT SignatureMessage, DestinationIP, Protocol
FROM magic_ids_detections
WHERE date = '2026-02-22'
AND SourceIP = 'INSERT_IP_ADDRESS_HERE'
より多くのデータへの扉を開く
最初から、Log Explorerは拡張性を考慮して設計されていました。すべてのデータセットスキーマは、JSONデータの構造と型を記述するために広く採用されている標準であるJSON Schemaを使用して定義されています。この設計上の決定により、HTTPリクエストやファイアウォールイベントを超えて、Cloudflareのテレメトリの全範囲に容易に拡張することができました。初期のデータセットを強化したのと同じスキーマ駆動アプローチは、自然に拡張され、Zero Trustログ、ネットワーク分析、メールセキュリティアラート、およびその間のすべてに対応できるようになりました。
さらに重要なことに、この標準化は、Cloudflareのネイティブテレメトリを超えたデータの取り込みへの扉を開きます。私たちの取り込みパイプラインはハードコードではなくスキーマ駆動であるため、JSON形式で表現できる構造化データであれば何でも受け入れる態勢が整っています。ハイブリッド環境を管理するセキュリティチームにとって、これはLog Explorerが最終的に、Cloudflareのエッジテレメトリとサードパーティソースからのログを相関させ、すべて同じSQLインターフェースを通じてクエリ可能なシングルペインオブグラスとして機能する可能性があることを意味します。今日のリリースはCloudflareの製品ポートフォリオのカバレッジを完成させることに焦点を当てていますが、カスタムスキーマで独自のデータソースを持ち込める未来に向けたアーキテクチャの基盤は築かれています。
より速いデータ、より速い対応:アーキテクチャのアップグレード
マルチベクター攻撃を効果的に調査するには、タイミングがすべてです。ログの可用性における数分の遅延でさえ、積極的な防御と反応的な被害制御の違いになる可能性があります。
そのため、私たちは速度と回復力のために取り込みを最適化しました。取り込みパスの一部で並行性を高めることで、「隣人騒音(noisy neighbor)」問題を引き起こす可能性のあるボトルネックを排除し、あるクライアントのデータ急増が別のクライアントの可視性を遅らせないようにしました。このアーキテクチャ作業により、P99取り込み遅延は約55%、P50は25%削減され、エッジでのイベントがSQLクエリで利用可能になるまでの時間が短縮されました。
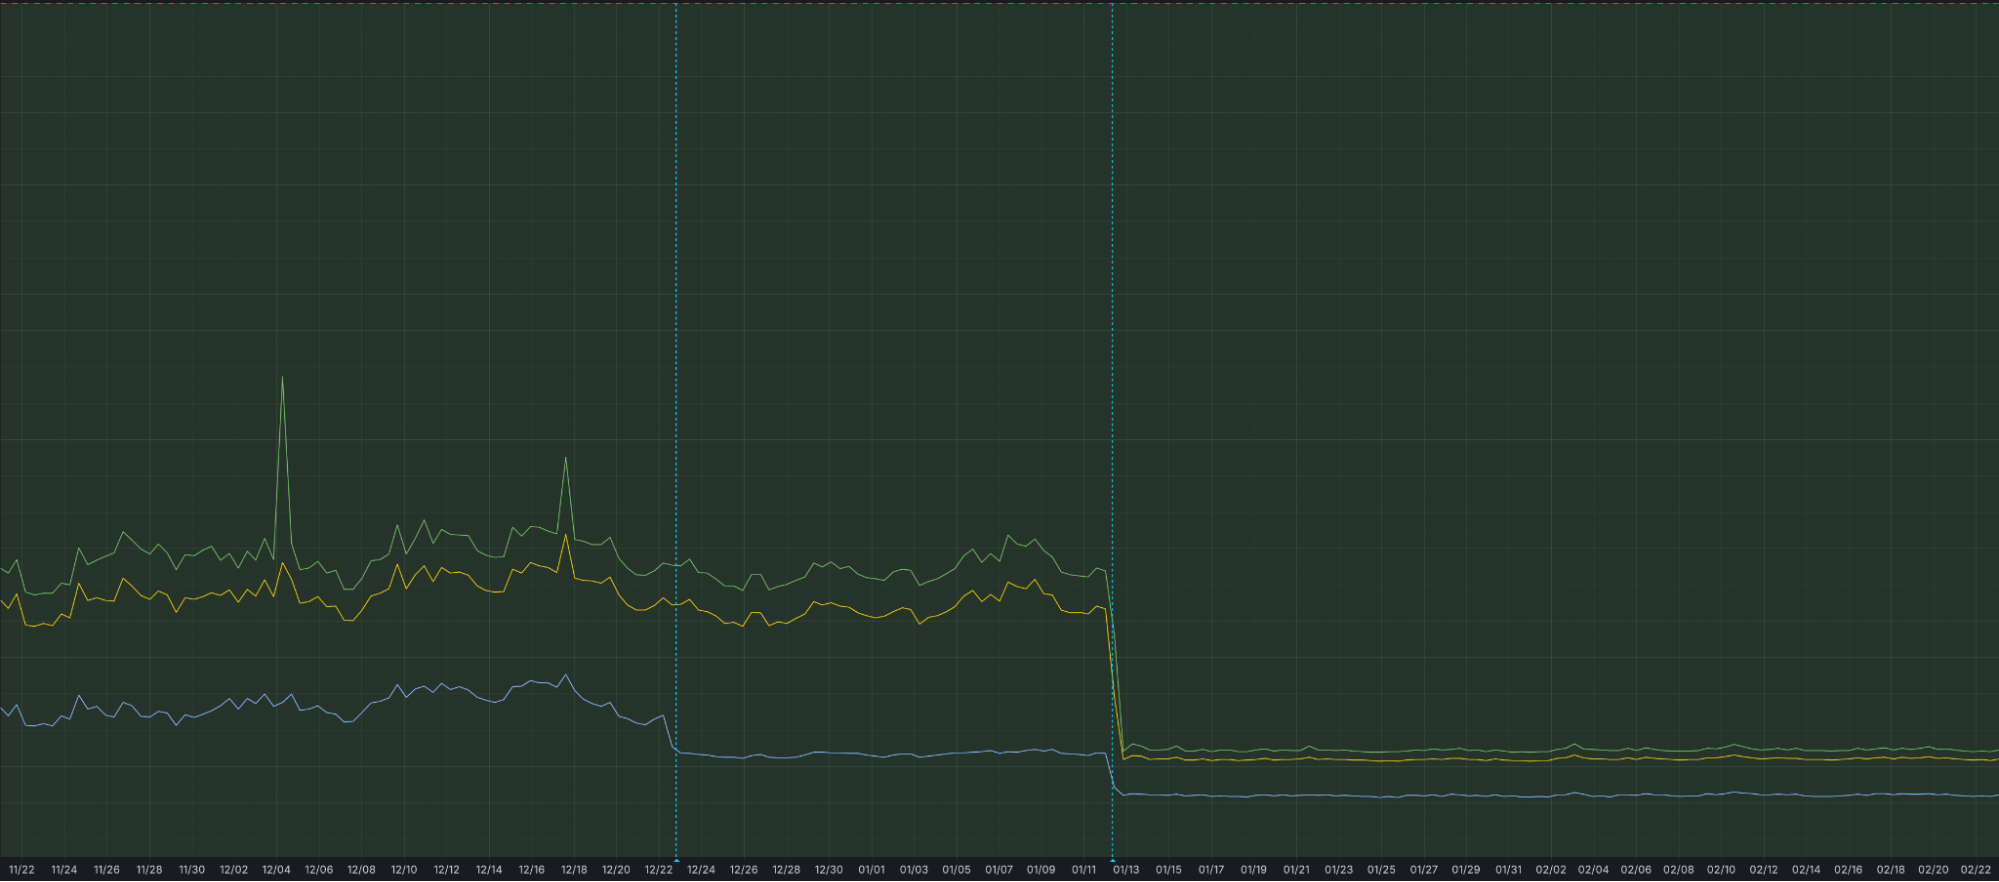 image
image
アーキテクチャアップグレード後の取り込み遅延の低下を示すGrafanaチャート
さらなるアップデートにご注目ください
私たちはまだ始まったばかりです。カスタム定義スケジュールでこれらの検出クエリを実行する機能など、Log Explorerでの体験をさらに向上させる、さらに強力な機能を積極的に開発中です。
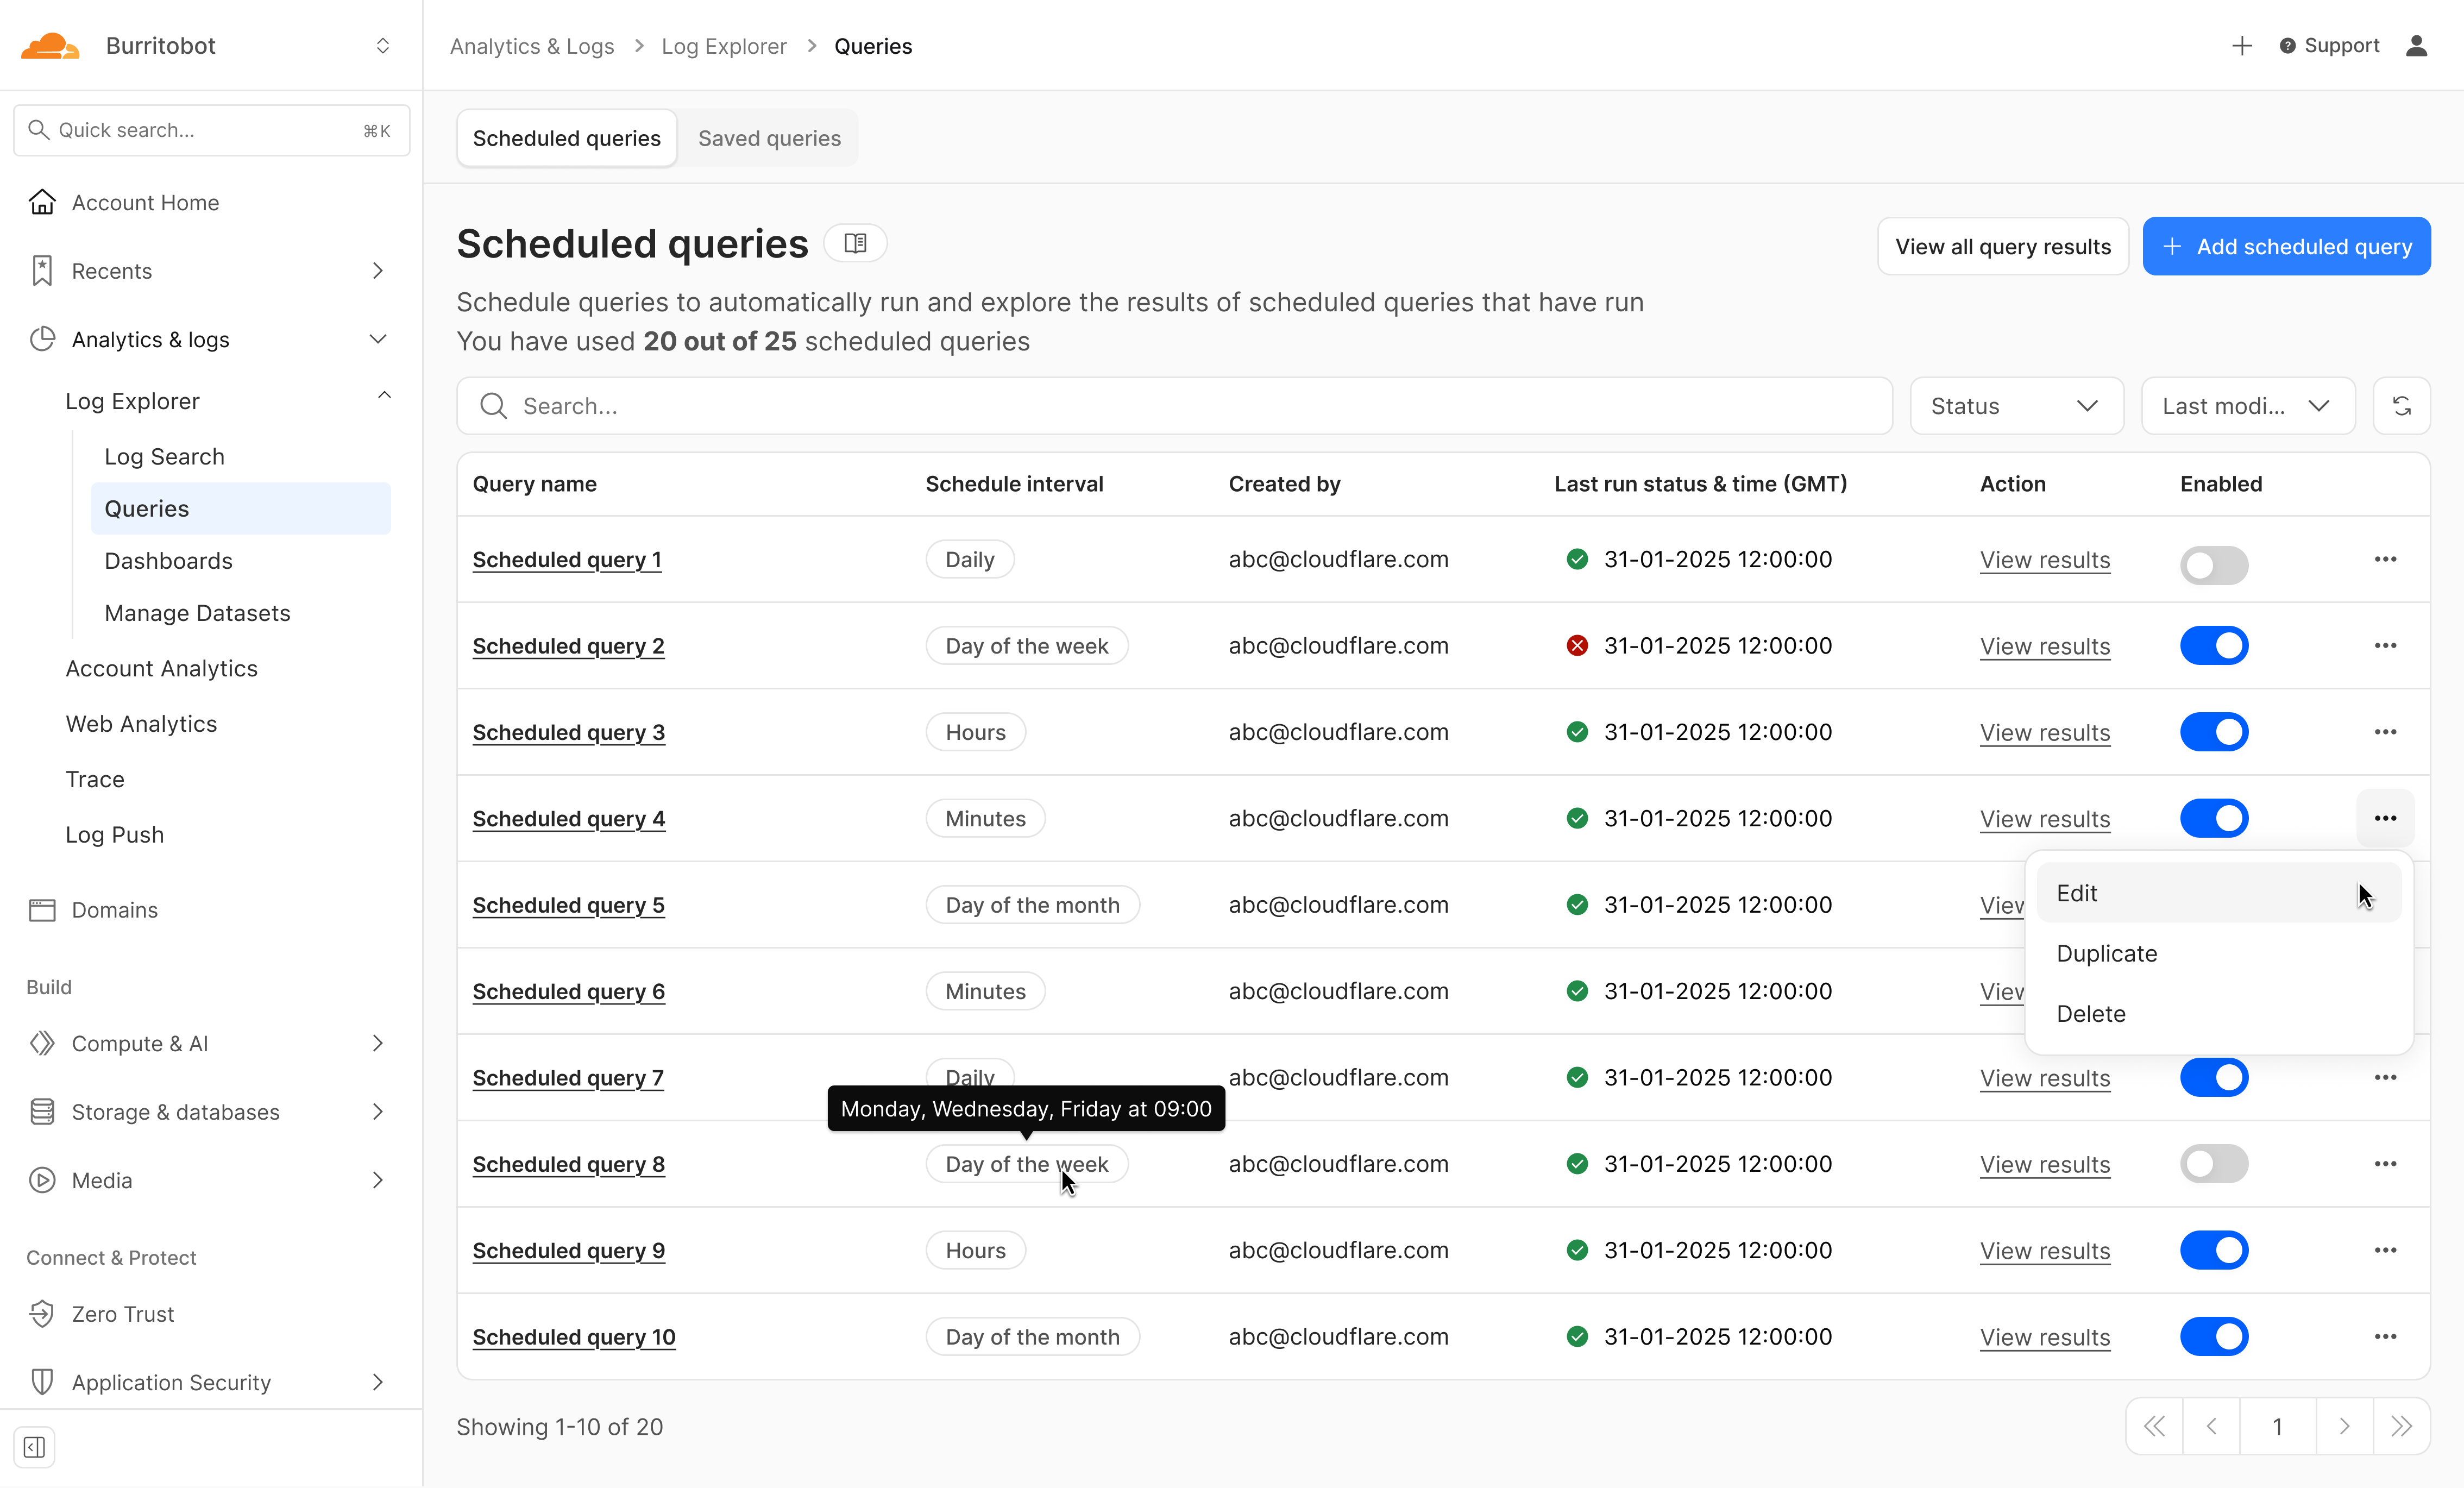 image
image
今後のLog Explorerスケジュール済みクエリ機能のデザインモックアップ
ブログを購読し、Change Logで近日公開予定のさらなるLog Explorerアップデートにご注目ください。
Log Explorerへのアクセス
Log Explorerにアクセスするには、ダッシュボードから直接セルフサービスで購入するか、契約顧客の場合はコンサルテーションのために連絡するか、アカウントマネージャーに連絡してください。さらに、Developer Documentationで詳細を読むこともできます。
原文を表示
In the world of cybersecurity, a single data point is rarely the whole story. Modern attackers don’t just knock on the front door; they probe your APIs, flood your network with "noise" to distract your team, and attempt to slide through applications and servers using stolen credentials.
To stop these multi-vector attacks, you need the full picture. By using Cloudflare Log Explorer to conduct security forensics, you get 360-degree visibility through the integration of 14 new datasets, covering the full surface of Cloudflare’s Application Services and Cloudflare One product portfolios. By correlating telemetry from application-layer HTTP requests, network-layer DDoS and Firewall logs, and Zero Trust Access events, security analysts can significantly reduce Mean Time to Detect (MTTD) and effectively unmask sophisticated, multi-layered attacks.
Read on to learn more about how Log Explorer gives security teams the ultimate landscape for rapid, deep-dive forensics.
The flight recorder for your entire stack
The contemporary digital landscape requires deep, correlated telemetry to defend against adversaries using multiple attack vectors. Raw logs serve as the "flight recorder" for an application, capturing every single interaction, attack attempt, and performance bottleneck. And because Cloudflare sits at the edge, between your users and your servers, all of these events are logged before the requests even reach your infrastructure.
Cloudflare Log Explorer centralizes these logs into a unified interface for rapid investigation.
Log Types Supported
Zone-Scoped Logs
Focus: Website traffic, security events, and edge performance.
HTTP Requests
As the most comprehensive dataset, it serves as the "primary record" of all application-layer traffic, enabling the reconstruction of session activity, exploit attempts, and bot patterns.
Firewall Events
Provides critical evidence of blocked or challenged threats, allowing analysts to identify the specific WAF rules, IP reputations, or custom filters that intercepted an attack.
DNS Logs
Identify cache poisoning attempts, domain hijacking, and infrastructure-level reconnaissance by tracking every query resolved at the authoritative edge.
NEL (Network Error Logging) Reports
Distinguish between a coordinated Layer 7 DDoS attack and legitimate network connectivity issues by tracking client-side browser errors.
Spectrum Events
For non-web applications, these logs provide visibility into L4 traffic (TCP/UDP), helping to identify anomalies or brute-force attacks against protocols like SSH, RDP, or custom gaming traffic.
Page Shield
Track and audit unauthorized changes to your site's client-side environment such as JavaScript, outbound connections.
Zaraz Events
Examine how third-party tools and trackers are interacting with user data, which is vital for auditing privacy compliance and detecting unauthorized script behaviors.
Account-Scoped Logs
Focus: Internal security, Zero Trust, administrative changes, and network activity.
Access Requests
Tracks identity-based authentication events to determine which users accessed specific internal applications and whether those attempts were authorized.
Audit Logs
Provides a trail of configuration changes within the Cloudflare dashboard to identify unauthorized administrative actions or modifications.
CASB Findings
Identifies security misconfigurations and data risks within SaaS applications (like Google Drive or Microsoft 365) to prevent unauthorized data exposure.
Magic Transit / IPSec Logs
Helps network engineers perform network-level (L3) monitoring such as reviewing tunnel health and view BGP routing changes.
Browser Isolation Logs
Tracks user actions inside an isolated browser session (e.g., copy-paste, print, or file uploads) to prevent data leaks on untrusted sites
Device Posture Results
Details the security health and compliance status of devices connecting to your network, helping to identify compromised or non-compliant endpoints.
DEX Application Tests
Monitors application performance from the user's perspective, which can help distinguish between a security-related outage and a standard performance degradation.
DEX Device State Events
Provides telemetry on the physical state of user devices, useful for correlating hardware or OS-level anomalies with potential security incidents.
DNS Firewall Logs
Tracks DNS queries filtered through the DNS Firewall to identify communication with known malicious domains or command-and-control (C2) servers.
Email Security Alerts
Logs malicious email activity and phishing attempts detected at the gateway to trace the origin of email-based entry vectors.
Gateway DNS
Monitors every DNS query made by users on your network to identify shadow IT, malware callbacks, or domain-generation algorithms (DGAs).
Gateway HTTP
Provides full visibility into encrypted and unencrypted web traffic to detect hidden payloads, malicious file downloads, or unauthorized SaaS usage.
Gateway Network
Tracks L3/L4 network traffic (non-HTTP) to identify unauthorized port usage, protocol anomalies, or lateral movement within the network.
IPSec Logs
Monitors the status and traffic of encrypted site-to-site tunnels to ensure the integrity and availability of secure network connections.
Magic IDS Detections
Surfaces matches against intrusion detection signatures to alert investigators to known exploit patterns or malware behavior traversing the network.
Network Analytics Logs
Provides high-level visibility into packet-level data to identify volumetric DDoS attacks or unusual traffic spikes targeting specific infrastructure.
Sinkhole HTTP Logs
Captures traffic directed to "sinkholed" IP addresses to confirm which internal devices are attempting to communicate with known botnet infrastructure.
WARP Config Changes
Tracks modifications to the WARP client settings on end-user devices to ensure that security agents haven't been tampered with or disabled.
WARP Toggle Changes
Specifically logs when users enable or disable their secure connectivity, helping to identify periods where a device may have been unprotected.
Zero Trust Network Session Logs
Logs the duration and status of authenticated user sessions to map out the complete lifecycle of a user's access within the protected perimeter.
Log Explorer can identify malicious activity at every stage
Get granular application layer visibility with HTTP Requests, Firewall Events, and DNS logs to see exactly how traffic is hitting your public-facing properties. Track internal movement with Access Requests, Gateway logs, and Audit logs. If a credential is compromised, you’ll see where they went. Use Magic IDS and Network Analytics logs to spot volumetric attacks and "East-West" lateral movement within your private network.
Identify the reconnaissance
Attackers use scanners and other tools to look for entry points, hidden directories, or software vulnerabilities. To identify this, using Log Explorer, you can query http_requests for any EdgeResponseStatus codes of 401, 403, or 404 coming from a single IP, or requests to sensitive paths (e.g. /.env, /.git, /wp-admin).
Additionally, magic_ids_detections logs can also be used to identify scanning at the network layer. These logs provide packet-level visibility into threats targeting your network. Unlike standard HTTP logs, these logs focus on signature-based detections at the network and transport layers (IP, TCP, UDP). Query to discover cases where a single SourceIP is triggering multiple unique detections across a wide range of DestinationPort values in a short timeframe. Magic IDS signatures can specifically flag activities like Nmap scans or SYN stealth scans.
Check for diversions
While the attacker is conducting reconnaissance, they may attempt to disguise this with a simultaneous network flood. Pivot to network_analytics_logs to see if a volumetric attack is being used as a smokescreen.
Identify the approach
Once attackers identify a potential vulnerability, they begin to craft their weapon. The attacker sends malicious payloads (e.g. SQL injection or large/corrupt file uploads) to confirm the vulnerability. Review http_requests and/or fw_events to identify any Cloudflare detection tools that have triggered. Cloudflare logs security signals in these datasets to easily identify requests with malicious payloads using fields such as WAFAttackScore, WAFSQLiAttackScore, FraudAttack, ContentScanJobResults, and several more. Review our documentation to get a full understanding of these fields. The fw_events logs can be used to determine whether these requests made it past Cloudflare’s defenses by examining the action, source, and ruleID fields. Cloudflare’s managed rules by default blocks many of these payloads by default. Review Application Security Overview to know if your application is protected.
image
Showing the Managed rules Insight that displays on Security Overview if the current zone does not have Managed Rules enabled
Audit the identity
Did that suspicious IP manage to log in? Use the ClientIP to search access_requests. If you see a "Decision: Allow" for a sensitive internal app, you know you have a compromised account.
Stop the leak (data exfiltration)
Attackers sometimes use DNS tunneling to bypass firewalls by encoding sensitive data (like passwords or SSH keys) into DNS queries. Instead of a normal request like google.com, the logs will show long, encoded strings. Look for an unusually high volume of queries for unique, long, and high-entropy subdomains by examining the fields: QueryName: Look for strings like h3ldo293js92.example.com, QueryType: Often uses TXT, CNAME, or NULL records to carry the payload, and ClientIP: Identify if a single internal host is generating thousands of these unique requests.
Additionally, attackers may attempt to leak sensitive data by hiding it within non-standard protocols or by using common protocols (like DNS or ICMP) in unusual ways to bypass standard firewalls. Discover this by querying the magic_ids_detections logs to look for signatures that flag protocol anomalies, such as "ICMP tunneling" or "DNS tunneling" detections in the SignatureMessage.
Whether you are investigating a zero-day vulnerability or tracking a sophisticated botnet, the data you need is now at your fingertips.
Correlate across datasets
Investigate malicious activity across multiple datasets by pivoting between multiple concurrent searches. With Log Explorer, you can now work with multiple queries simultaneously with the new Tabs feature. Switch between tabs to query different datasets or Pivot and adjust queries using filtering via your query results.
When you correlate data across multiple Cloudflare log sources, you can detect sophisticated multi-stage attacks that appear benign when viewed in isolation. This cross-dataset analysis allows you to see the full attack chain from reconnaissance to exfiltration.
Session hijacking (token theft)
Scenario: A user authenticates via Cloudflare Access, but their subsequent HTTP_request traffic looks like a bot.
Step 1: Identify high-risk sessions in http_requests.
SELECT RayID, ClientIP, ClientRequestUserAgent, BotScore
FROM http_requests
WHERE date = '2026-02-22'
AND BotScore < 20
LIMIT 100
Step 2: Copy the RayID and search access_requests to see which user account is associated with that suspicious bot activity.
SELECT Email, IPAddress, Allowed
FROM access_requests
WHERE date = '2026-02-22'
AND RayID = 'INSERT_RAY_ID_HERE'
Post-phishing C2 beaconing
Scenario: An employee clicked a link in a phishing email which resulted in compromising their workstation. This workstation sends a DNS query for a known malicious domain, then immediately triggers an IDS alert.
Step 1: Find phishing attacks by examining email_security_alerts for violations.
SELECT Timestamp, Threatcategories, To, Alertreason
FROM email_security_alerts
WHERE date = '2026-02-22'
AND Threatcategories LIKE 'phishing'
Step 2: Use Access logs to correlate the user’s email (To) to their IP Address.
SELECT Email, IPAddress
FROM access_requests
WHERE date = '2026-02-22'
Step 3: Find internal IPs querying a specific malicious domain in gateway_dns logs.
SELECT SrcIP, QueryName, DstIP,
FROM gateway_dns
WHERE date = '2026-02-22'
AND SrcIP = 'INSERT_IP_FROM_PREVIOUS_QUERY'
AND QueryName LIKE '%malicious_domain_name%'
Lateral movement (Access → network probing)
Scenario: A user logs in via Zero Trust and then tries to scan the internal network.
Step 1: Find successful logins from unexpected locations in access_requests.
SELECT IPAddress, Email, Country
FROM access_requests
WHERE date = '2026-02-22'
AND Allowed = true
AND Country != 'US' -- Replace with your HQ country
Step 2: Check if that IPAddress is triggering network-level signatures in magic_ids_detections.
SELECT SignatureMessage, DestinationIP, Protocol
FROM magic_ids_detections
WHERE date = '2026-02-22'
AND SourceIP = 'INSERT_IP_ADDRESS_HERE'
Opening doors for more data
From the beginning, Log Explorer was designed with extensibility in mind. Every dataset schema is defined using JSON Schema, a widely-adopted standard for describing the structure and types of JSON data. This design decision has enabled us to easily expand beyond HTTP Requests and Firewall Events to the full breadth of Cloudflare's telemetry. The same schema-driven approach that powered our initial datasets scaled naturally to accommodate Zero Trust logs, network analytics, email security alerts, and everything in between.
More importantly, this standardization opens the door to ingesting data beyond Cloudflare's native telemetry. Because our ingestion pipeline is schema-driven rather than hard-coded, we're positioned to accept any structured data that can be expressed in JSON format. For security teams managing hybrid environments, this means Log Explorer could eventually serve as a single pane of glass, correlating Cloudflare's edge telemetry with logs from third-party sources, all queryable through the same SQL interface. While today's release focuses on completing coverage of Cloudflare's product portfolio, the architectural groundwork is laid for a future where customers can bring their own data sources with custom schemas.
Faster data, faster response: architectural upgrades
To investigate a multi-vector attack effectively, timing is everything. A delay of even a few minutes in the log availability can be the difference between proactive defense and reactive damage control.
That is why we have optimized our ingestion for better speed and resilience. By increasing concurrency in one part of our ingestion path, we have eliminated bottlenecks that could cause “noisy neighbor” issues, ensuring that one client’s data surge doesn’t slow down another’s visibility. This architectural work has reduced our P99 ingestion latency by approximately 55%, and our P50 by 25%, cutting the time it takes for an event at the edge to become available for your SQL queries.
image
Grafana chart displaying the drop in ingest latency after architectural upgrades
Follow along for more updates
We're just getting started. We're actively working on even more powerful features to further enhance your experience with Log Explorer, including the ability to run these detection queries on a custom defined schedule.
image
Design mockup of upcoming Log Explorer Scheduled Queries feature
Subscribe to the blog and keep an eye out for more Log Explorer updates soon in our Change Log.
Get access to Log Explorer
To get access to Log Explorer, you can purchase self-serve directly from the dash or for contract customers, reach out for a consultation or contact your account manager. Additionally, you can read more in our Developer Documentation.
関連記事
今日のまとめ
AI日報で今日の重要ニュースをまとめ読み