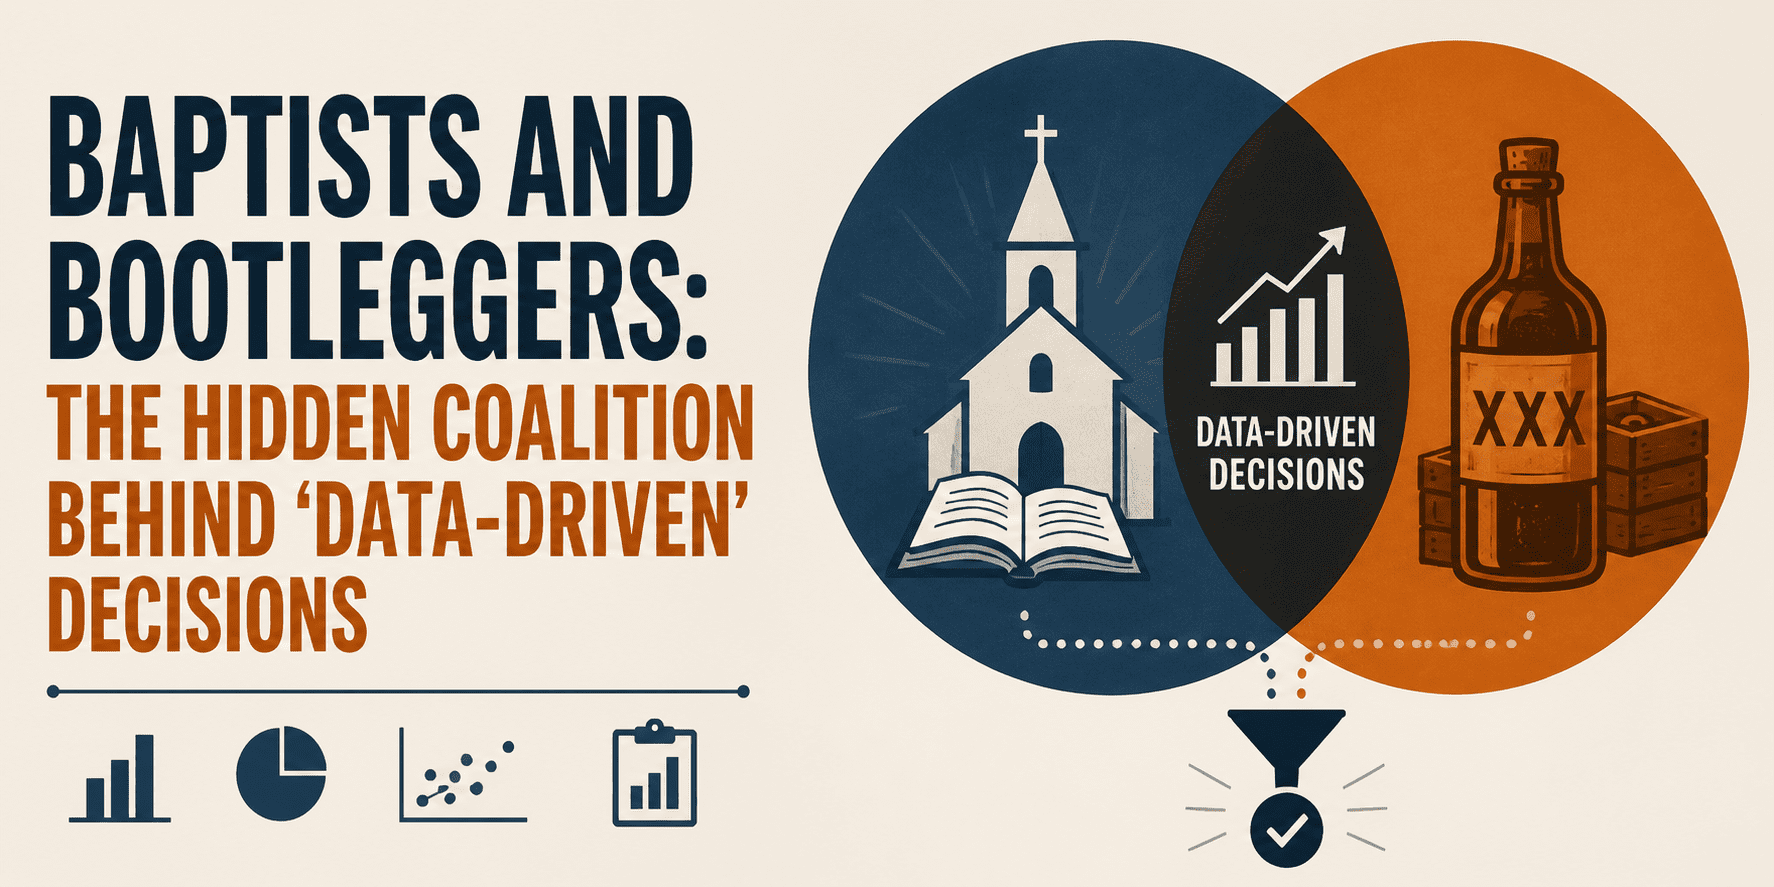
バプテスト派と密造酒業者:「データ駆動型」決定の背後にある隠れた連合
この記事は、データドリブンな意思決定を推進する「道徳的正当性を求める真摯な分析家」と「特定の利益のためにデータを利用する隠れた利害関係者」が、意図せずして強力な政治的連合を形成するという現象を解説し、組織のデータ文化におけるバイアスと動機を批判的に分析している。
キーポイント
ブートレッガーとバプティストの概念の転用
規制経済学者ブルース・ヤンドルの「ブートレッガー(密輸業者)とバプティスト(宗教団体)」という政治連合の概念を、データ分析の世界に応用し、異なる動機を持つグループが同じ結果を支持する構造を説明している。
真摯な分析家と利用主義者の共鳴
「データドリブン」を称賛する層には、純粋に証拠に基づく意思決定を求めるバプティスト(真摯な分析家)と、自らの意図を正当化するために数字を探し回るブートレッガー(利用主義者)の両方が含まれる。
道徳的覆面による規制強化
真摯な分析家が提供する「より良いデータ」という道徳的・倫理的な正当性が、実質的には特定の利害関係者の利益を達成するための強力な政治的武器となり、結果として厳格なルールや規制が成立しやすくなる。
組織内の隠れた連合の危険性
この二つの異なる動機を持つグループが同じテーブルに座り、同じ言葉を使って意思決定を押し通す構造は、組織内で批判的な検討を妨げ、真の意味でのデータドリブンな文化を損なうリスクがある。
データ・バプテストの特性
証拠に基づいて意思決定を行う人々で、データが仮説と矛盾した場合でも考えを改め、「間違っていた」と認めることができる誠実な実践者です。
データ・ブートレッガーの手法
事前に結論が決まっているため、支持する結果だけを強調し、都合の悪いデータを無視したり相関関係を都合よく解釈したりしてストーリーをねじ曲げる人々です。
偽装された共謀関係
ブートレッガーはバプテストと同じ語彙や「データが示すもの」という強調を用いるため、会議の場では両者を区別することが極めて困難になります。
重要な引用
"according to data analytics" can come from two very different places.
The Baptists provided the moral cover, the public-facing justification that politicians could point to. The bootleggers worked behind the scenes, quietly benefiting from the result.
Both groups wanted the same outcome, but for entirely different reasons.
They treat data as a flashlight in a dark room — something that helps everyone see more clearly, even when what it reveals is inconvenient.
The destination was fixed before the journey started.
The bootlegger just made sure the right numbers were the ones on the table.
影響分析・編集コメントを表示
影響分析
この記事は、AIおよびデータ分析業界において「データドリブン」という言葉が持つ政治的・社会的な側面を鋭く指摘しており、技術的な進歩だけでなく組織の意思決定プロセスにおける人間心理や権力構造を理解する重要性を浮き彫りにしています。企業や組織が真に効果的なデータ文化を構築するためには、表面的な数字の利用を超えて、背後にある動機とバイアスを可視化する必要があるという示唆を与えています。
編集コメント
技術的な新機能の紹介ではないものの、データサイエンスやAI導入現場で頻繁に遭遇する「数字の使い回し」や「道徳的正当化による強引な推進」という本質的な問題を突いた、非常に示唆に富む記事です。
# イントロダクション
**
すべての組織は自分たちを「データドリブン(データ駆動型)」であると称することを好みます。それは信頼性のための金標準となり、会議での異論を封じるために使われる言葉になりました。しかし、ここで少し立ち止まって考えてみるべきことがあります:"データ分析によると"という言葉は、2 つの非常に異なる場所から発せられる可能性があるということです。
1 つ目は純粋な好奇心です。もう 1 つは、すでに自分が望むものを知っており、それを裏付ける数字を探し回っている人からの言葉です。
そして不思議なことに、これらの 2 種類の人は同じ決定を推進し、同じ言語を使い、同じテーブルの同じ側に座ることになります。この連合はあなたが思うよりも一般的であり、それには名前があります。
1983 年、規制経済学者のブルース・ヤンドル(Bruce Yandle)は「密輸業者とバプテスト」という概念を紹介しました。この考え方は、アメリカ南部の日曜日のアルコール販売に関する法律についての観察から生まれました。バプテスト派は道徳的な理由からこれらの法律を推進しました。彼らは日曜日の酒類販売を制限することが正しいことだと信じていました。一方、密輸業者たちは、その法律が自分たちの法的な競争相手を1 日間排除することになるため、まさに同じ法律を好んでいました。
両グループは同じ結果を望んでいましたが、その理由は全く異なっていました。バプテスト派(キリスト教の一派)が道徳的な裏付けと、政治家が指差せる公衆向けの正当性を提供しました。一方、密輸業者たちは裏側で働き、静かにその結果から利益を得ていました。ヤンドルの洞察は、このようなありえない連合が、どちらか一方が単独で達成できるよりも成功した規制の結果を生み出す傾向にあるという点にあります。
これは強力な枠組みです。そして、データと分析の世界に不気味なほど正確に対応しています。
データリテラシーのある組織であれば、必ず証拠に基づいて意思決定を行おうと真摯に取り組んでいる人々を見つけることができます。彼らがバプテスト派です。彼らはよりクリーンなデータパイプラインや、より優れたダッシュボード、より厳密な A/B テストを求めます。彼らが統計的有意性を求めるのは、それが自分たちのアジェンダに役立つからではなく、より良いデータがより良い結果をもたらすと信じているからです。
これらの人々は容易に見分けがつきます。データが仮説と矛盾した際に考えを変えるのが彼らです。「私が間違っていた」とか「先に進む前にさらに情報が必要だ」と言うことに抵抗がありません。彼らはデータを暗闇の中の懐中電灯のように扱います。それは誰もがより明確に見えるようにするものであり、それが明らかにするものが不都合なものである場合でも同様です。
データの信者たちは、データがどのように構造化されていようとも、その原則を真に信じています。そして、その信念こそが、彼らを密輸業者にとって有用なものにしているのです。
次に、もう一方の側面を見てみましょう。すでに結論を持っており、それを支持するためにデータを逆算して物語を組み立てる人々です。彼らは証拠の言語に精通しており、数字を引用し、ダッシュボードを参照し、洗練されたスライド資料で発見を提示することができます。しかし、彼らが辿った分析プロセスは、決して開かれたものではなく、出発点から目的地が固定されていました。
データの密輸業者たちは、好むトレンドを支持する時間範囲だけを都合よく選ぶような行為を行います。彼らは自らのイニシアチブを称賛する指標を選び取りながら、そうでない指標は静かに無視します。都合の良い時には相関関係に頼り、そうでない時にはそれを振り払います。そして、自分の立場に反論するデータを提示することは、ほとんどありません。
例えば、AI 生成の広告クリエイティブを推進しようとする人がいるとしましょう。彼らは 2 週間のテストからのクリック率を引き出し、これを勝利だと宣言します。しかし、彼らが言及しないのは、離脱率が倍増し、ページ滞在時間が減少し、キャンペーンあたりの獲得コストが実際には上昇したという事実です。確かに AI 広告はクリックを集めました。しかし、誤解を招くサムネイルも同様です。全体像は全く異なる物語を語っており、だからこそ彼らは全体像を見せないのです。
彼らが効果的である理由は、彼らの言葉遣いがバプテスト(禁酒運動家)と全く同じだからです。使用する語彙も同じで、「データが示すもの」への強調も同様です。外部から見れば、会議においてこの二つを区別するのはほぼ不可能です。
# なぜ連合はこれほどうまく機能するのか
**
ここがヤンドルの枠組みが本当に理解できる点です。バプテストは正当性を提供します。証拠に基づく思考への真のコミットメントを持つ人物が決定を支持するとき、他の人々がそれに追随するための政治的コストが低下します。密輸業者(ブートレッジャー)はその波に乗って、バプテストの信頼性を隠れ蓑として利用し、最初から望んでいた結果を導き出します。
そして、ここが肝心な点ですが、バプテストは自分が連合の一部であることを気づいていないことがよくあります。彼らはその決定が功績に基づいて行われたと考えています。なぜなら、彼らの視点からは、データが確かにその方向を示していたからです。彼らは誠意を持って数字を検討し、結論に至りました。密輸業者はただ、議論のテーブルに並ぶべき正しい数字を確保していただけです。
# 見分ける方法を学ぶ
では、実際に何ができるでしょうか?まず、データが誰かの望む結果と矛盾したときに何が起きるかを観察することから始めましょう。バプテストはそれに対処します。追加の質問を行い、前提を再検討し、場合によっては方向転換さえします。一方、密輸業者は方向転換(ピボット)します。彼らは問いを枠組みを変えたり、指標を移したり、あるいは突然「データは全体像を捉えていない」と決めつけたりします。
同様に、データを提示する人と、どのデータが提示されるかを選択する人を区別して注意を払う必要があります。利用可能なすべての証拠を分析する人と、その一部を選別して提示する人との間には、重要な違いがあります。
また、分析プロセスが本当に探索的なものだったのか、それとも結論がデータを抽出する前からすでに存在していたのかを自分自身に問いかける必要があります。これらを常に区別できるわけではありません。
この連合の核心は、両者を区別することが難しい点にあります。しかし、このような動態を意識していること自体が大きな優位性となります。なぜなら、組織内のほとんどの人は、自らの「データドリブン」な文化が、同時に非常に異なる2つのエンジンで稼働している可能性さえ考えたことがないからです。
# 結びの言葉
ブレイドルの枠組みは規制経済学のために構築されたものですが、彼が記述するパターンは普遍的です。意思決定に道徳的または知的な正当性が伴う場所であれば、原則を信じる人々と、その正当性を覆い隠すために利用する人々の両方が必ず存在します。データドリブン文化も例外ではありません。
あなたが持つ最良の防御策はシンプルです:数字が何を語っているかだけでなく、誰がその決定から利益を得ているのかについて好奇心を持ち続けることです。なぜなら、数字は真実であり、分析も妥当であっても、全体としてそれがブートレッガー(密輸業者)の夢のような状況になり得るからです。良質なデータ実践とは、「このデータは何を語っているか?」と問うのと同時に、「なぜこのデータなのか?」と頻繁に問いかけることを意味します。
Nahla Davies** はソフトウェア開発者であり、技術ライターです。技術ライティングに専念する以前は、Inc. 5,000 に選出された体験型ブランディング組織のリードプログラマーとして勤務するなど、数々の興味深い職務を担いました。同社のクライアントには、Samsung、Time Warner、Netflix、Sony が含まれています。
原文を表示
# Introduction
**
Every organization loves to call itself "data-driven." It's become the gold standard of credibility, the thing you say to shut down dissent in a meeting. But here's something worth sitting with for a second: the phrase "according to data analytics" can come from two very different places.
One is genuine curiosity. The other is someone who already knows what they want and went looking for a number to back it up.
And the weird part? Both of those people end up pushing for the same decision, using the same language, sitting on the same side of the table. That coalition is more common than you'd think, and it has a name.
Back in 1983, regulatory economist Bruce Yandle introduced a concept he called "Bootleggers and Baptists." The idea came from an observation about Sunday alcohol laws in the American South. Baptists pushed for those laws on moral grounds. They believed restricting Sunday liquor sales was the right thing to do. Bootleggers, meanwhile, loved the exact same laws because they eliminated their legal competition for a day.
Both groups wanted the same outcome, but for entirely different reasons. The Baptists provided the moral cover, the public-facing justification that politicians could point to. The bootleggers worked behind the scenes, quietly benefiting from the result. Yandle's insight was that these unlikely coalitions tend to produce more successful regulatory outcomes than either group could achieve alone.
It's a powerful framework. And it maps onto the world of data and analytics with uncomfortable precision.
In any data-literate organization, you'll find people who are genuinely trying to let evidence guide their decisions. These are your Baptists. They want cleaner data pipelines, better dashboards, more rigorous A/B tests. They push for statistical significance not because it serves their agenda, but because they believe better data leads to better outcomes.
These folks are easy to spot. They're the ones who change their minds when the data contradicts their hypothesis. They're comfortable saying "I was wrong" or "we need more information before we move." They treat data as a flashlight in a dark room — something that helps everyone see more clearly, even when what it reveals is inconvenient.
Baptists of data** genuinely believe in the principle, no matter how the data is structured. And that belief is exactly what makes them useful to the bootleggers.
Now meet the other side. These are the people who already have a conclusion and reverse-engineer the data story to support it. They're fluent in the language of evidence. They can cite numbers, reference dashboards, and present findings in polished slide decks. But the analytical process they followed was never really open-ended. The destination was fixed before the journey started.
Bootleggers of data do things like cherry-pick time ranges that support their preferred trend. They'll choose metrics that flatter their initiative while quietly ignoring the ones that don't. They'll lean on correlation when it suits them and wave it away when it doesn't. And they rarely, if ever, present the data that argues against their position.
Say someone's pushing for AI-generated ad creative. They'll pull up the click-through rates from a two-week test and call it a win. What they won't mention is that bounce rates doubled, time on page dropped, and the campaign's cost per acquisition actually went up. The AI ads got clicks, sure. But so do misleading thumbnails. The full picture tells a very different story, and that's exactly why they don't show the full picture.
The thing that makes them effective is that they sound exactly like the Baptists. Same vocabulary. Same emphasis on "what the data shows." From the outside, it's almost impossible to tell the two apart in a meeting.
# Why the Coalition Works So Well
**
This is where Yandle's framework really clicks. The Baptists provide legitimacy. When someone with a genuine commitment to evidence-based thinking supports a decision, it lowers the political cost for everyone else to go along. The bootleggers ride that wave, using the Baptist's credibility as cover for an outcome they wanted all along.
And here's the kicker: the Baptists often don't realize they're part of a coalition. They think the decision was made on merit because, from their vantage point, the data really did point that way. They looked at the numbers in good faith and arrived at a conclusion. The bootlegger just made sure the right numbers were the ones on the table.
# Learning to Tell Them Apart
So what can you actually do? Start by watching what happens when data contradicts someone's preferred outcome. The Baptists will engage with it. They'll ask follow-up questions, revisit assumptions, maybe even change direction. The bootleggers will pivot. They'll reframe the question, shift the metric, or suddenly decide the data "doesn't capture the full picture."
Likewise, pay attention to who presents the data versus who selects which data gets presented. There's a meaningful difference between someone who analyzes all available evidence and someone who curates a subset of it.
You must also ask yourself whether the analytical process was genuinely exploratory or whether the conclusion was circulating before the data was even pulled. You won't always be able to tell them apart.
The whole point of the coalition is that it's hard to distinguish between the two. But being aware of the dynamic is already a significant advantage, because most people in most organizations have never even considered that their "data-driven" culture might be running on two very different engines at the same time.
# Final Thoughts
Yandle's framework was built for regulatory economics, but the pattern it describes is universal. Wherever decisions carry moral or intellectual legitimacy, there will be people who believe in the principle and people who exploit the cover it provides. Data-driven culture is no exception.
The best defense you've got is simple: stay curious about who benefits from a decision, not just what the numbers say. Because the numbers can be real, the analysis can be sound, and the whole thing can still be a bootlegger's dream. Good data practice means asking "why this data?" just as often as you ask "what does this data say?"
Nahla Davies** is a software developer and tech writer. Before devoting her work full time to technical writing, she managed—among other intriguing things—to serve as a lead programmer at an Inc. 5,000 experiential branding organization whose clients include Samsung, Time Warner, Netflix, and Sony.
関連記事
今日のまとめ
AI日報で今日の重要ニュースをまとめ読み