Amazon SageMaker AI LLM推論における包括的な観測可能性:GPU利用率からLLM品質まで
AWS は、Amazon SageMaker AI 上で大規模言語モデル(LLM)を運用する際、インフラの量(リソース使用率など)とモデルの質(回答精度など)という二つの次元を統合した包括的な可観測性ソリューションを提案しています。
キーポイント
可観測性の二重構造
LLM の運用監視には、インフラの健全性を示す「量(Quantity)」と、モデル出力の精度を示す「質(Quality)」という補完的な 2 つの次元が必要であると定義しています。
段階的アプローチの実践
まずはレイテンシやエラー率などの基本指標で信頼性を確保し、その後サンプリング評価を通じてモデルのドリフトや品質劣化を検知する 2 ステージのプロセスを推奨しています。
統合監視と自動アラート
インフラと出力品質の両方の指標を相関させ、閾値を設定した自動化されたアラートを導入することで、コスト効率と出力品質の継続的な最適化を実現します。
Amazon Managed Grafana の活用
AWS のマネージド Grafana を活用したダッシュボードにより、SageMaker エンドポイント上の LLM に関する包括的な可視性を提供し、両次元の統合監視を可能にします。
重要な引用
Unlike conventional software that returns deterministic outputs, LLMs generate variable, free-form responses that are difficult to validate with standard metrics.
A comprehensive observability approach for LLM inference must address two distinct but complementary dimensions: model serving infrastructure (quantity) and LLM quality.
Production-grade LLM observability emerges when both dimensions are monitored, correlated, and optimized together.
影響分析・編集コメントを表示
影響分析
この記事は、生成 AI の本番環境導入において、従来のソフトウェア監視手法では不十分であることを明確にし、LLM 特有の「量」と「質」を統合した新しい監視基準を提示しています。企業にとって、コスト管理とモデル品質のバランスを保ちながら大規模 LLM を運用するための具体的なアーキテクチャ指針となり、実務レベルでの可観測性戦略の標準化に寄与します。
編集コメント
LLM の本番運用において、インフラの健全性だけでなく「出力の質」をどう定量的に評価するかが最大の課題ですが、この記事は AWS が提供する具体的なツールとアプローチでそのギャップを埋める有望な指針となっています。
大規模言語モデル(LLM)を Amazon SageMaker AI Inference でスケールしてデプロイする場合、観測可能性はあらゆる本番環境の機械学習(ML)戦略において重要な柱となります。決定論的な出力を返す従来のソフトウェアとは異なり、LLM は検証が困難な可変的で自由形式の応答を生成します。入力分布の変化に伴い LLM の出力品質は時間とともに変動するため、品質モニタリングによりこれらの変化を早期に検出できます。生成 AI ワークロードにおける観測可能性には、モデルサービングインフラストラクチャも含まれますが、ここでは予測不可能なトークン消費量、GPU メモリ圧力、レイテンシの急上昇が発生し、キャパシティプランニングとコスト管理が常に動いている標的となります。
LLM 推論のための包括的な観測可能性アプローチは、2 つの異なるが補完的な次元に対応する必要があります。1 つ目はモデルサービングインフラストラクチャ(数量)、2 つ目は LLM の品質です。数量モニタリングは、推論インフラストラクチャの運用健全性に焦点を当て、リクエストスループットとリソース利用率を追跡します。これらの指標はボトルネックの検出、計算リソースの適切なサイズ調整、コスト管理に役立ちます。一方、品質モニタリングは LLM 自体のパフォーマンスに焦点を当て、応答の精度、コンプライアンス、および時間経過に伴う一貫性を評価します。
多くのチームは、LLM の観測可能性を段階的に構築します。最初の段階では、レイテンシ、エラー、リソース利用率といったコアな運用メトリクスへの可視性を確立します。これらの信号は、推論エンドポイントの信頼性を確認するものです。次の段階では、サンプリングと評価を通じて LLM の品質を追加し、モデルのドリフト、劣化、または生成された応答における予期せぬ挙動といった課題を浮き彫りにします。
両方の次元が整った状態で、インフラストラクチャと品質の信号を組み合わせた閾値と自動化されたアラートを導入できます。時間の経過とともに、この実践はモデルや構成間での比較分析へと拡張され、コスト、パフォーマンス、出力品質を継続的に調整できるようになります。数量と品質のメトリクスは相互依存関係にあり、エンドポイントが運用上健全に見えても不良または不安全な応答を生成している場合もあれば、過剰にプロビジョニングされたインフラストラクチャ上で非効率的に動作しながら高品質な出力を提供している場合もあります。両方の次元を監視し、相関付け、かつ同時に最適化することで、本番環境向けの LLM 観測可能性が実現されます。
この投稿では、Amazon Sage AI エンドポイントで推論コンポーネントを備えて提供される LLM の品質と数量の双方について包括的なビューを提供する Amazon Managed Grafana ダッシュボードを使用した、包括的な観測可能性ソリューションの実装を示します。
ワークフローアーキテクチャ
数量と品質という 2 つの監視次元にわたる LLM の完全な可視性を実現するために、LLM 観測においてそれぞれ特定の役割を果たすよう選ばれた 3 つのコア AWS サービスを用いたソリューションを構築しました。以下の高レベルデータフロー図には、推論コンポーネントを備えた Amazon SageMaker AI エンドポイント、Amazon CloudWatch、および Amazon Managed Grafana という 3 つのコアコンポーネントが示されています。
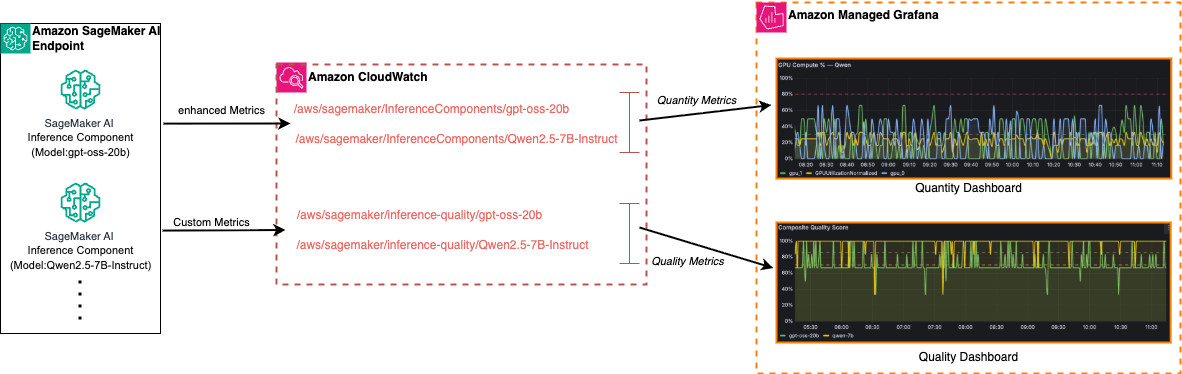
Amazon SageMaker AI Inference Components は、モデルホスティング層として機能します。単一の SageMaker AI エンドポイントでは、複数の推論コンポーネントをホストでき、それぞれが異なる LLM を実行します(前述のアーキテクチャに示されているように、gpt-oss-20b や Qwen2.5-7B-Instruct など)。推論コンポーネントを使用することで、共有インフラストラクチャ上で複数のモデルを展開・スケーリング・管理しながら、トラフィックルーティング、スケーリングポリシー、メトリックの帰属においてモデルごとの分離を維持できます。
Amazon CloudWatch は、集約されたメトリクスストアとして機能します。各推論コンポーネントから、拡張メトリクスとカスタム品質指標という 2 つの異なるデータストリームを受信します。拡張メトリクスは、エンドポイント設定で有効化すると SageMaker AI によって自動的に公開されます。このメトリクスには、インスタンスレベル、コンテナレベル、および GPU ごとの次元が含まれており、モデルごとの呼び出し回数、レイテンシ、エラーレート、GPU/CPU の利用率などについて、きめ細やかな可視性を提供します。拡張メトリクスは /aws/sagemaker/InferenceComponents/ 名前空間(例:/aws/sagemaker/InferenceComponents/gpt-oss-20b)にログ出力されます。詳細については、Amazon SageMaker AI 拡張メトリクスのドキュメント および 拡張メトリクスに関する深掘りブログ記事 を参照してください。
カスタム品質指標は、複合的な品質スコア、安全性スコア、評価レイテンシなど、LLM の出力品質を捉えるものです。これらは /aws/sagemaker/inference-quality/ に設定された、ユーザーが個別に構成した CloudWatch 名前空間へ公開され、品質信号を運用メトリクスから明確に分離します。以下の表は、2 つの CloudWatch メトリクス名前空間を要約しています。
CloudWatch Metric Namespace
Captures
Purpose
/aws/sagemaker/InferenceComponents/
エンハンスドメトリクス:インスタンスレベル、コンテナレベル、および 1 GPU あたりの次元
モデルごとの呼び出し回数、レイテンシ、エラーレート、GPU/CPU の利用率に関する詳細な可視性を提供
/aws/sagemaker/inference-quality/
カスタム品質メトリクス:複合品質スコア、安全性スコア、および評価レイテンシ
LLM 出力の品質信号を捉え、運用メトリクスから明確に分離して保持
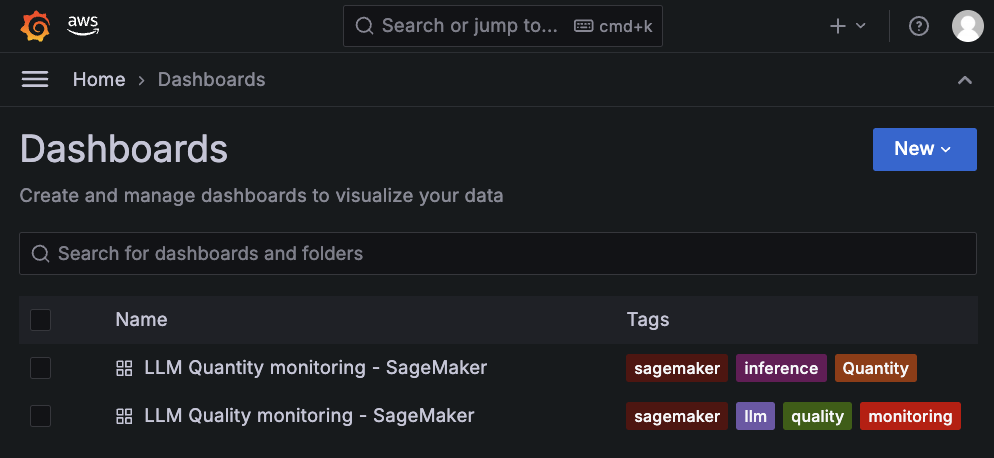
Amazon Managed Grafana は可視化レイヤーを提供し、CloudWatch をネイティブデータソースとして使用 します。本記事では、以下のスクリーンショットに示すように、SageMaker AI エンドポイントの LLM の数量および品質メトリクスを表面化する 2 つの専用ダッシュボードについて説明します。
 image
image
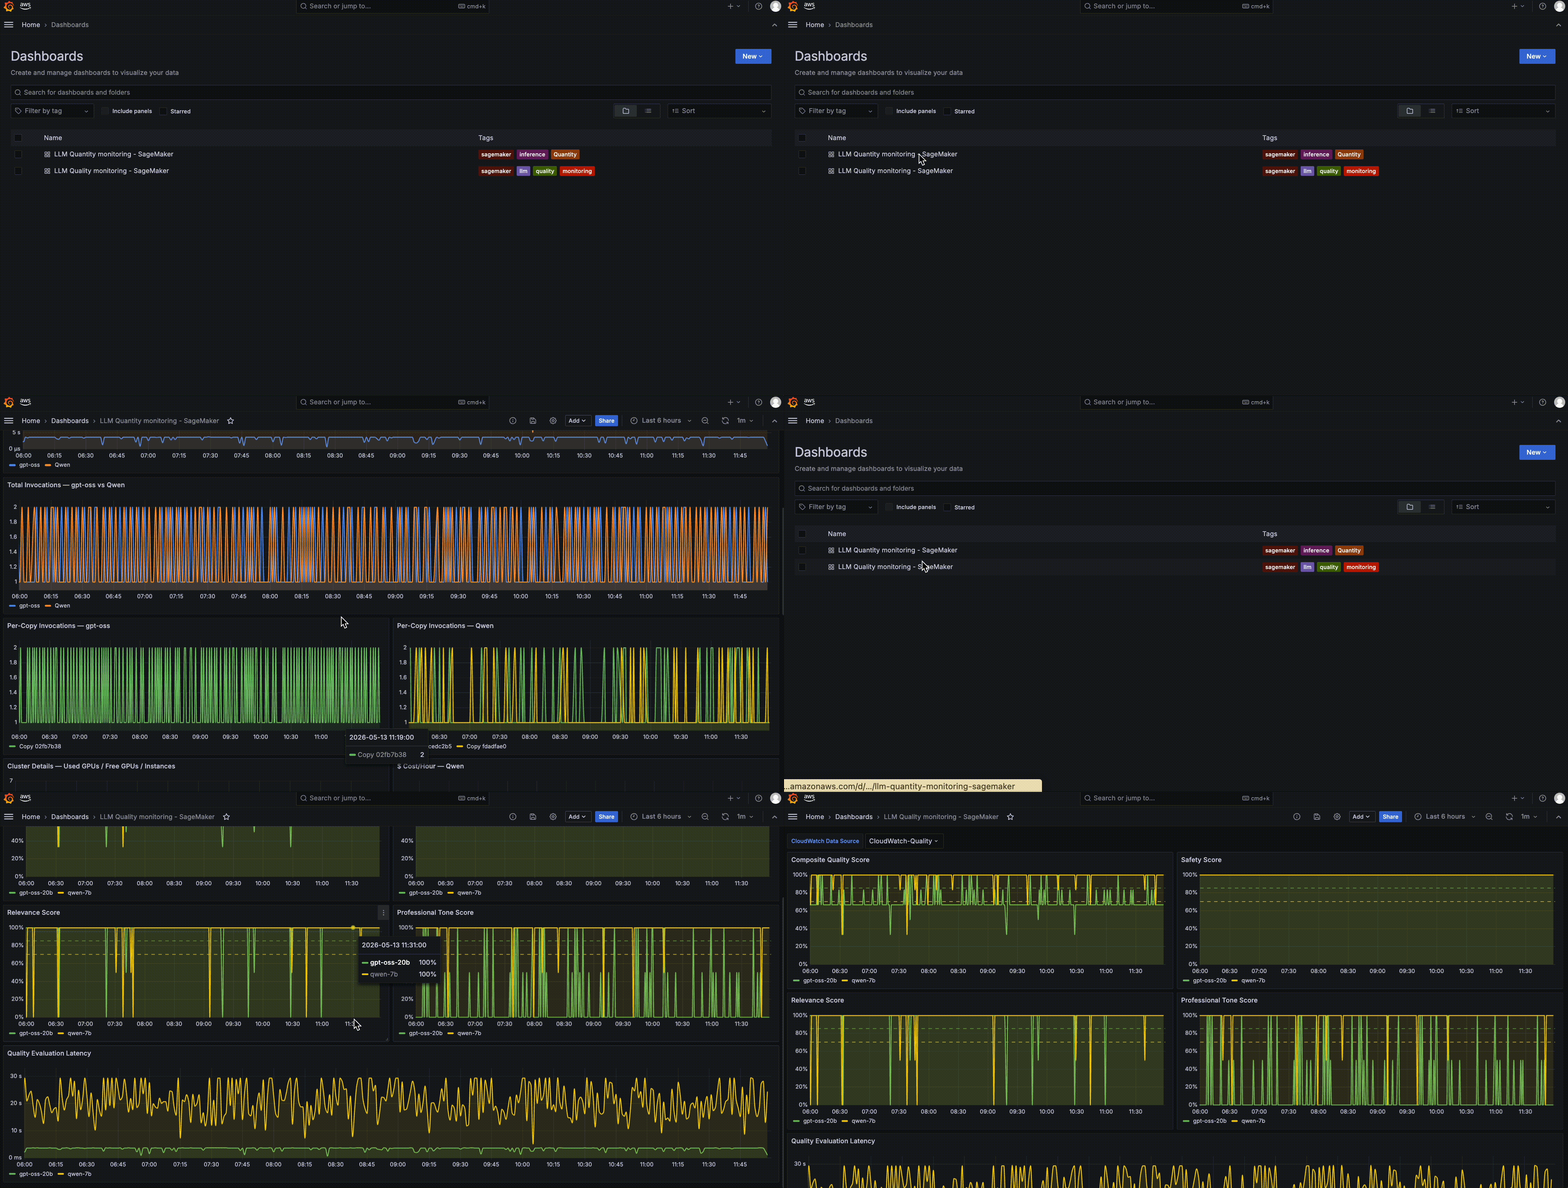
Grafana の数量ベースのダッシュボードは、各推論コンポーネントごとの GPU メモリ利用率、CPU 使用率、および呼び出しメトリクスを表示します。品質ベースの Grafana ダッシュボードは、モデル間を比較した複合品質スコア、安全性スコア、および品質評価レイテンシを表示し、以下の画像に示す通りです。ビジネスまたはアプリケーションの使用ケースに基づいて新しいダッシュボードを作成することで、Grafana のダッシュボードを拡張できます。
数量モニタリング
数量モニタリングにより、SageMaker AI エンドポイントで提供される大規模言語モデル(LLM)の運用状況を可視化できます。これを行わないと、トラフィックパターン、リソース飽和、コストの帰属、スケーリング動作の追跡が困難になり、これらはすべて可用性や支出に直接影響を及ぼします。推論コンポーネントを使用するマルチモデルエンドポイントの場合、数量モニタリングは以下の重要な運用上の質問に答える役割を果たします:各モデルはいくつのリクエストを処理しているか?GPU は適切にサイズ設定されているのか、それとも過剰プロビジョニングされているのか?どのモデルがコストの主要因となっているのか。
インフラストラクチャ指標を超えて、数量モニタリングはパフォーマンスと信頼性、リソース利用率、および組織固有のビジネス指標にわたって、LLM 推論コンポーネントの運用健全性とビジネスへの影響を評価するのを支援します。これらのビューを組み合わせることで、レイテンシが発生している場所がどこか、コスト増がトラフィックの増加によるものなのか非効率な GPU アロケーションによるものなのか、スケーリングポリシーが需要に対して適切に応答しているかどうかを確認できます。
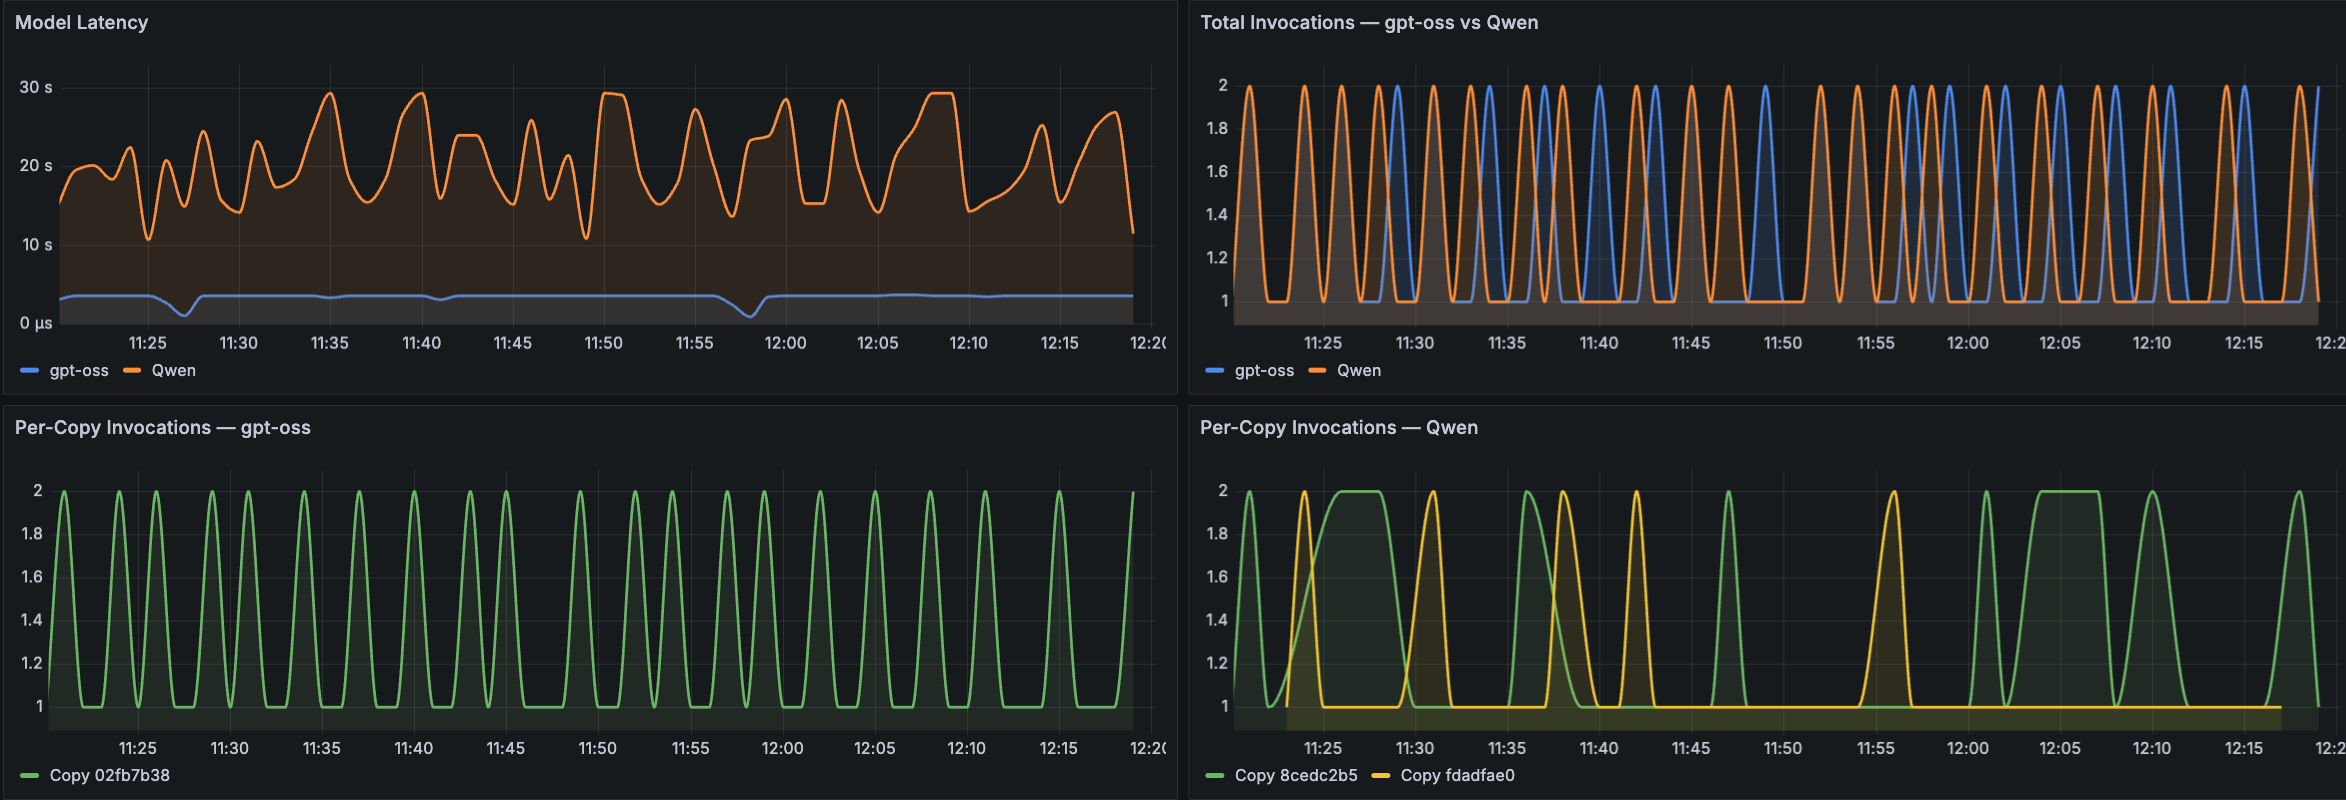
以下の Amazon Managed Grafana ダッシュボードのサンプルは、これら数量モニタリングの次元を 3 つの主要領域にわたって実践的に適用したものです。最初のパネル群は LLM の呼び出しとレイテンシをカバーしています。以下のサンプル Grafana ダッシュボード出力に示されているように、パネルには時系列トレンドとしてのモデルレイテンシ、モデル間の比較(例えば gpt-oss と Qwen)を示す総呼び出し数、および各モデルごとのコピー別呼び出し数が表示されます。これらのパネルは、オペレーターがリクエストスループットのパターンを理解し、レイテンシの急上昇を特定し、モデルコピー間での呼び出し分布を比較することを支援します。
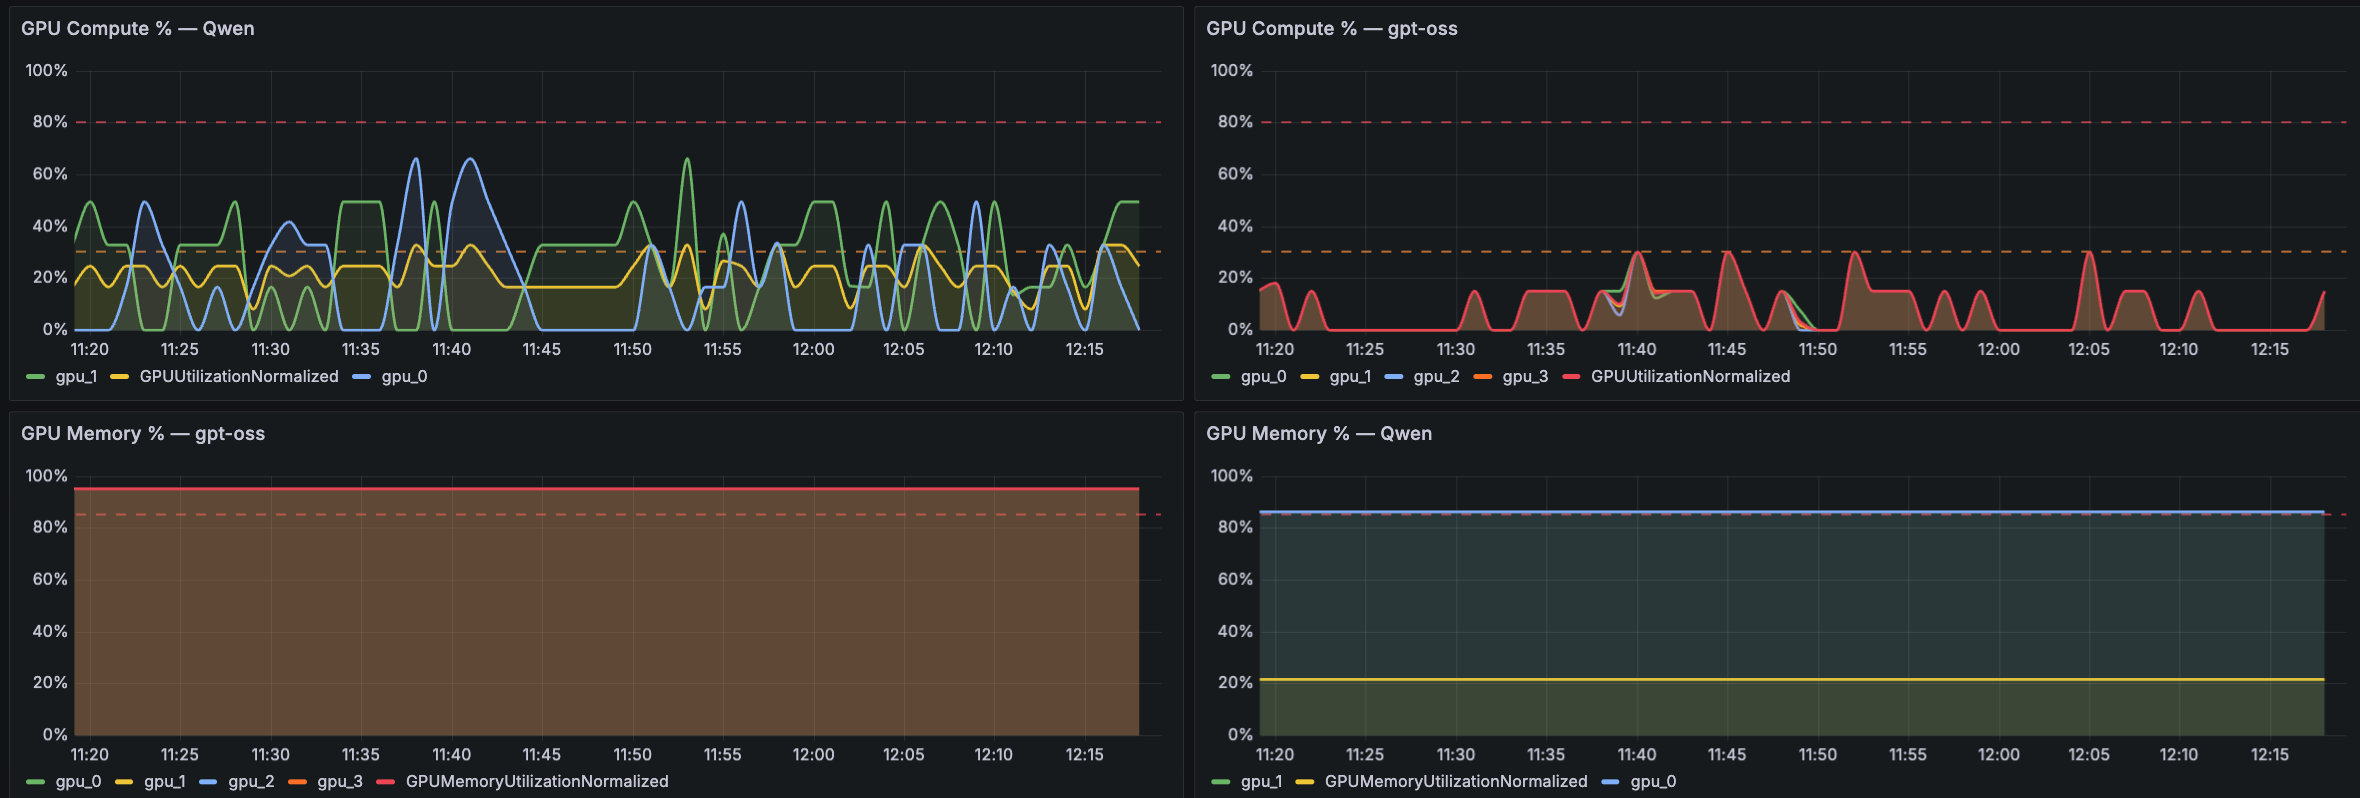
次のパネルは、GPU の計算およびメモリ利用率に焦点を当てています。以下の Grafana ダッシュボードのサンプルでは、両方のモデル(例えば Qwen と gpt-oss)に対する GPU 計算使用率と GPU メモリ使用率のパネルが提示されています。このクロスモデル比較により、ML エンジニアやサイト信頼性エンジニア (SRE) は、パフォーマンスの問題が GPU 計算に依存しているのかメモリ制限によるものかを迅速に判断でき、また一つのモデルが共有インフラ上で不均衡なリソースを消費していないかも確認できます。
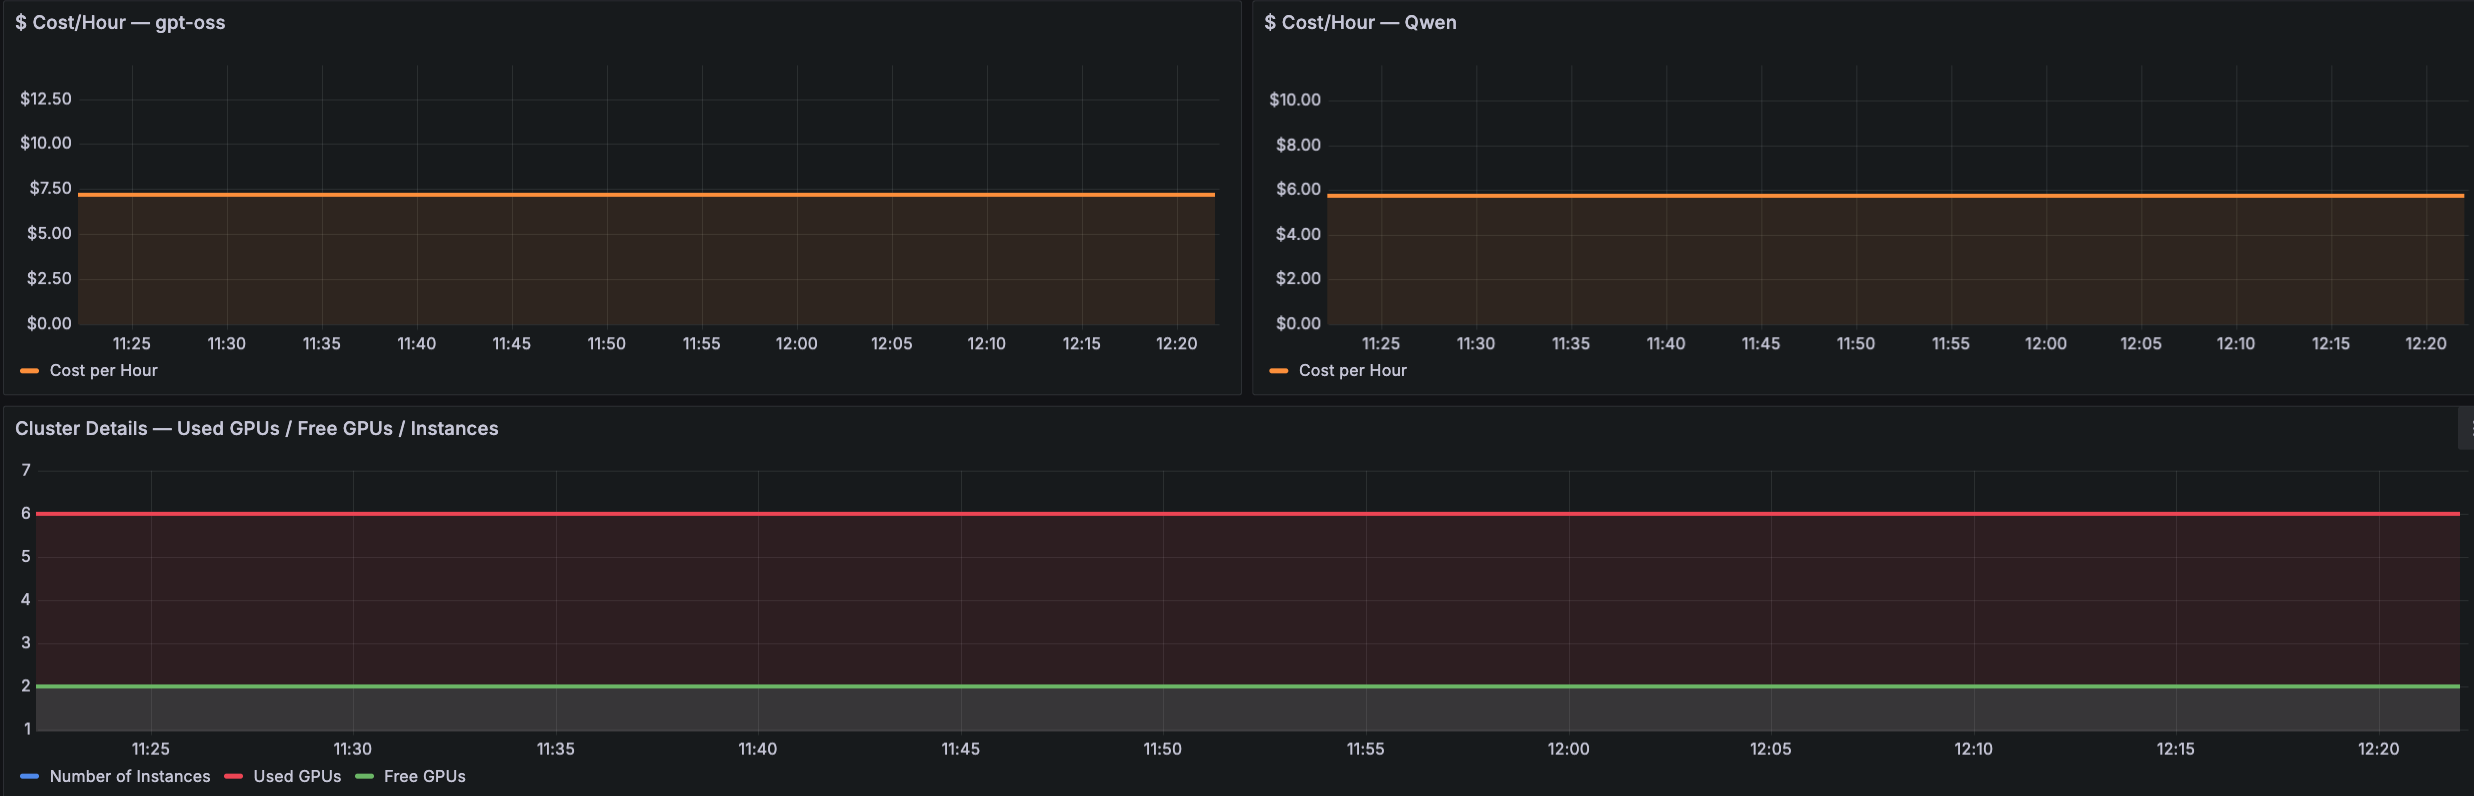
3 つ目のパネル群は、エンドポイントの使用状況とコストの詳細を提供します。以下の「クラスター概要およびコスト」Grafana ダッシュボードのサンプルでは、クラスター容量を可視化するために使用 GPU 数と空き GPU 数、ならびに総インスタンス数が示され、さらにモデルごとの時間あたりのコストパネル(例:gpt-oss および Qwen)も含まれています。このビューからは、どのモデルがコストの主要因となっているか、GPU が過剰プロビジョニングされているのか飽和状態にあるのか、そして自動スケーリングポリシーが需要に応じて適切に反応しているかを把握できます。
以下の表は、Grafana ダッシュボードでカバーされる 3 つの数量監視領域を要約したものであり、それぞれの関連メトリクスと目的を示しています。
| メトリックタイプ | ダッシュボードメトリック名 | 捕捉内容 | 目的 |
|---|---|---|---|
| モデル呼び出しおよびレイテンシ | モデルレイテンシ、総呼び出し数 (gpt-oss vs Qwen)、コピーごとの呼び出し数 (gpt-oss)、コピーごとの呼び出し数 (Qwen) | リクエストスループット、応答時間、コピーごとの呼び出し分布 | レイテンシの急上昇の特定、モデル間スループットの比較、コピー間の呼び出し負荷分散の理解 |
| GPU 計算およびメモリ利用率 | GPU 計算率 (%) (Qwen)、GPU 計算率 (%) (gpt-oss)、GPU メモリ率 (%) (Qwen)、GPU メモリ率 (%) (gpt-oss) | モデルごとの GPU 計算およびメモリ利用率のパーセンテージ | 問題が GPU 計算バウンド型かメモリ制限型かを判断し、モデル間での不均衡なリソース消費を検出 |
エンドポイントの使用状況とコスト
使用 GPU / 未使用 GPU / インスタンス、時間あたりのコスト (gpt-oss)、時間あたりのコスト (Qwen)
クラスター容量、GPU アロケーション状況、モデルごとの時間あたりコストの帰属分析
コストの主要因を特定し、過剰プロビジョニングまたは飽和状態にある GPU を検出し、自動スケーリングの応答性を検証する
これらすべてのダッシュボードを組み合わせることで、オペレーターはエンドポイントで提供されるモデル全体にわたるコスト、容量、利用率を相関付けられる単一の管理画面(シングル・パイン・オブ・グラス)を得ることができます。これらのダッシュボードを環境に設定するには、AWS サンプル GitHub リポジトリのサンプルノートブック を参照し、組織の要件に合わせてカスタマイズされたダッシュボードを作成するためにソリューションを拡張してください。
品質モニタリング
数量指標は LLM サービングインフラストラクチャが健全かどうかを示しますが、品質指標は LLM が期待通りに動作しているかを示します。入力プロンプトの分布の変化、概念ドリフト、または現実世界の条件の変動により、LLM のパフォーマンスは時間とともに静かに低下する可能性があります。レイテンシの急増や 500 エラーとは異なり、品質の劣化が従来のアラートをトリガーすることはめったにありません。
品質モニタリングは、ビジネスにとって重要な次元においてモデルの出力を評価することでこれに対処します。具体的には、応答品質(ユーザーの問い合わせへの関連性、事実の正確さ、完全性、一貫性)、安全性とコンプライアンス(有害コンテンツの検出、バイアス監視、プライバシー準拠、規制遵守)、ユーザーエクスペリエンスの品質(有用性、明確さ、適切なトーン、多ターン会話の一貫性)、そしてドメイン固有の品質(専門分野における技術的正確さ、検索拡張生成 (RAG) アプリケーションのための引用品質、プログラミングアシスタント向けのコード正しさ)です。これらの次元を組み合わせることで、ガバナンスチームはガードレールを施行し、プロダクトオーナーは時間経過に伴うユーザー向け品質を追跡し、データサイエンティストは品質の低下が特定のプロンプトパターン、モデル更新、あるいはデータ分布の変化によって引き起こされたのかを特定することができます。
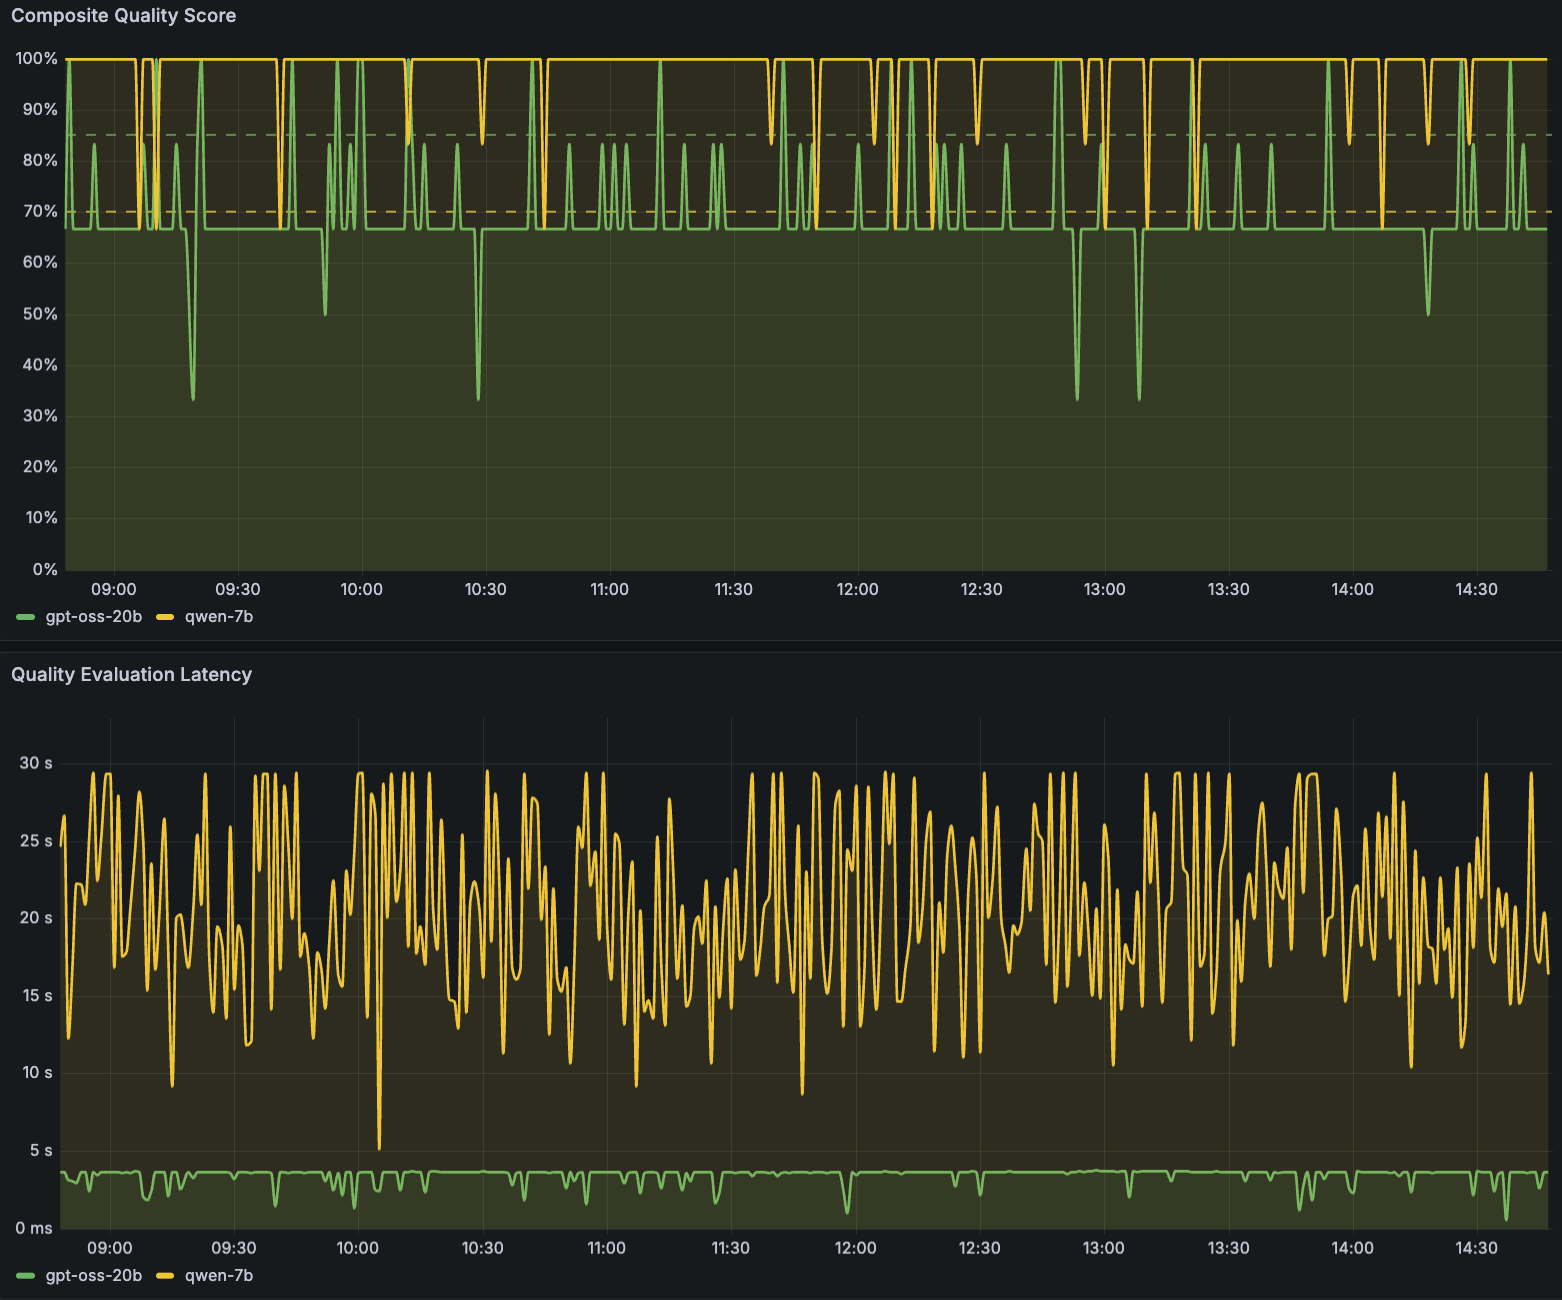
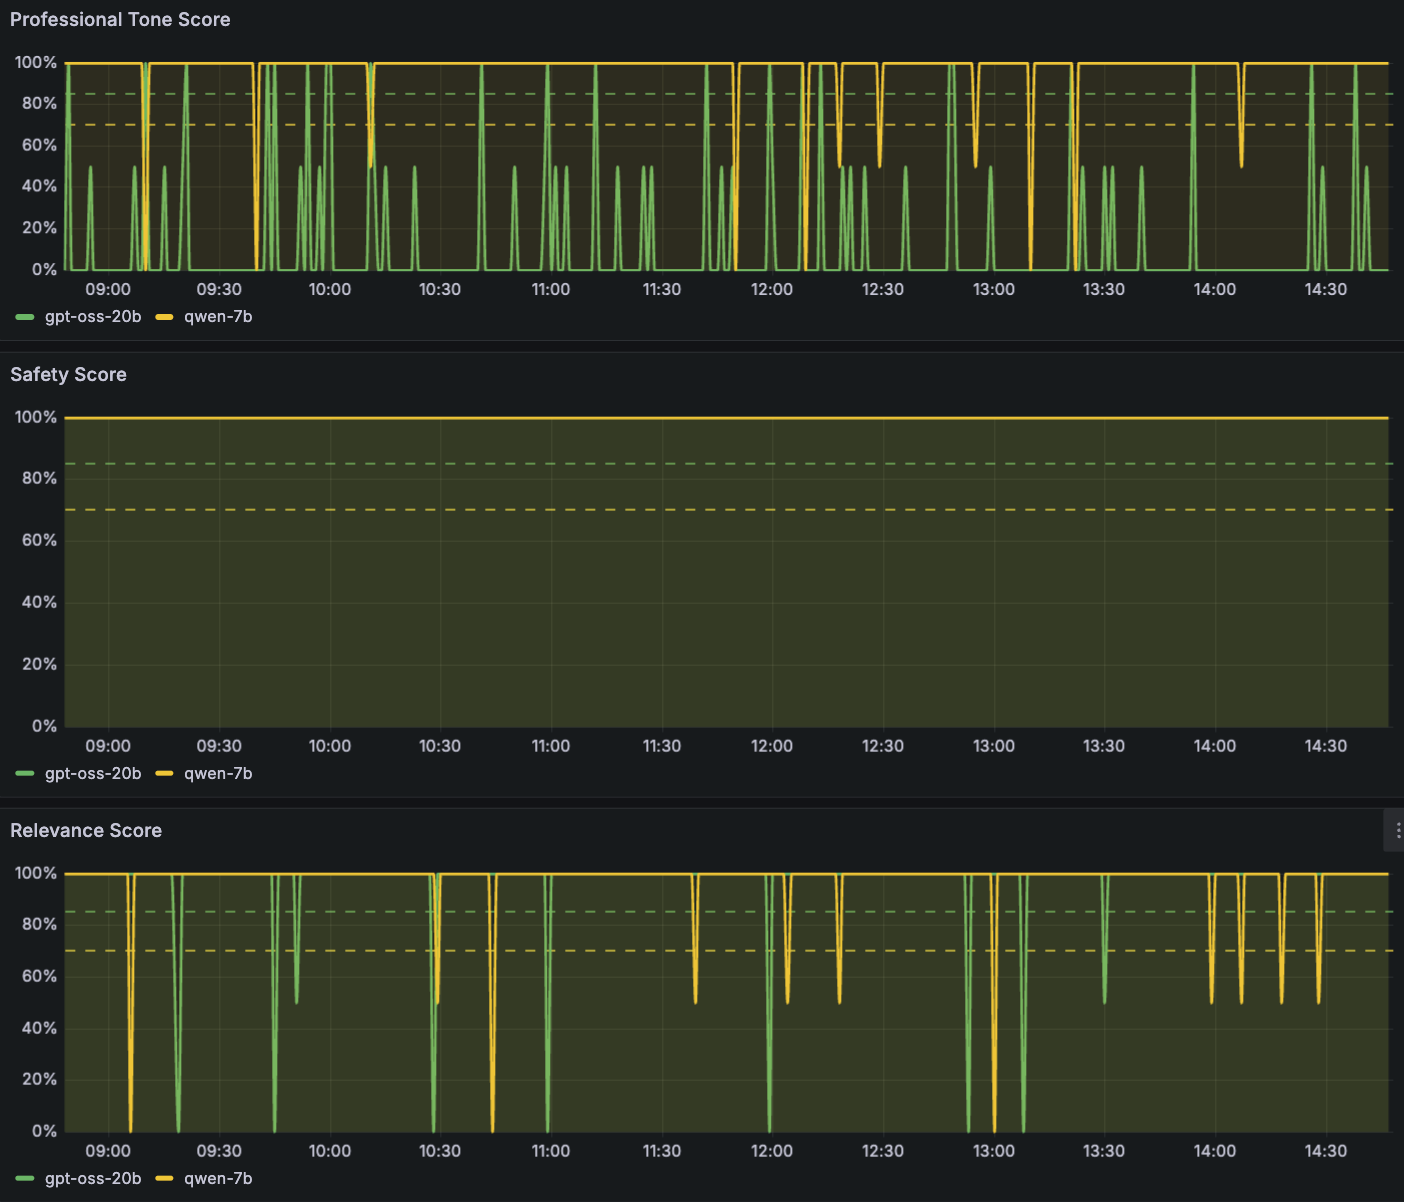
以下の Amazon Managed Grafana ダッシュボードのサンプル出力は、SageMaker AI エンドポイント推論コンポーネント全体(例:LLM gpt-oss-20b および Qwen2.5-7B-Instruct)にわたる品質モニタリングを示しています。このダッシュボードでは 4 つの品質スコアを追跡しており、それぞれが時間系列の折れ線グラフとして表示され、設定可能なアラート閾値(破線で示された約 85% と 95% のライン)を備えています。
最初のパネルは「Composite Quality Score(複合品質スコア)」を示しており、これは複数の品質次元を組み合わせた総合的な健全度指標です。このメトリクスは時間経過に伴う全体的な品質の傾向を表示するため、特定のプロンプトタイプに関連する一時的な品質低下と、持続的な劣化を容易に区別することができます。
次のパネル群では、特定の LLM 応答の品質メトリクスを追跡します。これには「Safety Score(安全性スコア)」、「Relevance Score(関連性スコア)」、「Professional Tone Score(専門的トーンスコア」が含まれます。
Safety Score は有害またはコンプライアンス違反のコンテンツを検出する機能を監視します。ダッシュボード出力では、このスコアは 4 つのメトリクスの中で最も安定しており、常に目標閾値バンド内で推移しています。これは両方のモデルにおいて信頼性の高い安全性ガードレールが機能していることを示しています。
Relevance Score は、LLM の応答がいかにユーザーの意図に応えているかを測定し、チームが LLM の理解力を試す可能性があるプロンプトカテゴリを特定するのを支援します。
Professional Tone Score は、出力がデプロイメントの文脈に適したトーンを維持しているかどうかを評価します。
これらの品質スコアは、設定可能な評価基準を備えた LLM-as-judge パターンなどの評価指標を用いて計算されます。本例では、Amazon Bedrock を介して提供される Anthropic Claude Sonnet 4.6 を評価モデルとして使用しており、これは LLM-as-judge のユースケースにおける標準的な Amazon Bedrock サービス利用規約に準拠しています。ご自身の評価システムを置き換えることも可能ですが、選択したモデルの利用規約が他モデルからの出力の評価を許可していることを確認し、データ居住要件が満たされていることを検証し、また時間経過に伴う品質スコアの比較可能性を維持するために、評価モデルを特定のバージョンに固定する必要があります。
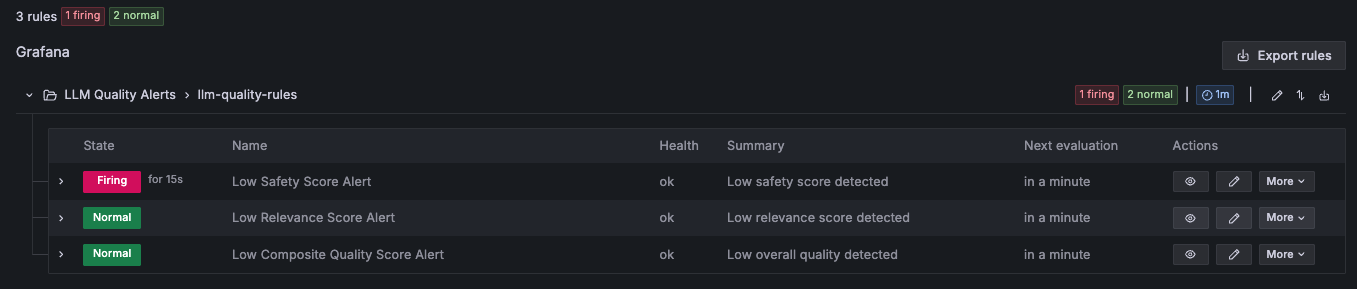
一目見れば、LLM の品質を並列比較でき、どの LLM がより安定しているか、どの品質次元が主要なリスク要因となっているか、そして品質の問題が特定のプロンプトタイプに対する感応性を示す一時的なものなのか、モデルの劣化を示唆する持続的なものなのかを特定できます。可視化を超えて、Grafana Alerting を介して推論コンポーネントごとに次元付けされた閾値ベースのアラートルールが自動的に展開され、各推論コンポーネントに対してアラームが発火します。品質スコアが設定された閾値を超過した場合、Amazon Simple Notification Service (Amazon SNS) を経由してこれらの通知を受け取り、迅速な SRE(サイト信頼性エンジニア)のトリアージが可能になります。現代の SRE チームは、既存の自動化されたトリアージプロセスを活用し、例えばこれらのアラートを Slack、PagerDuty、または OpsGenie と統合することで、ログの自動相関付け、アラート重大度の分類、および緩和のためのインシデントの優先順位付けを行うことで、応答時間を数秒に短縮します。
以下の Grafana Alerting ダッシュボードのサンプル出力は、推論コンポーネントごとに閾値ベースのアラートルールが発火し、即座の SRE トリアージのために設定されたチャネルへ通知がルーティングされる様子を示しています。
このビューは、ガバナンスチームと製品チームに対して、エンジニアリングの調整、是正措置、根本原因分析、モデルの差し替え、その他の改良に関する意思決定を行うために必要なエビデンスを提供します。ご自身の環境でこのダッシュボードを設定し、品質メトリクスについてさらに詳しく知りたい場合は、AWS サンプル GitHub リポジトリーのノートブック をご覧ください。
結論
本番環境における LLM(大規模言語モデル)推論スタックの観測可能性を確保するには、稼働時間やエラー率を追跡するだけでは不十分です。本記事で示した通り、包括的な戦略は、数量と品質という 2 つの相補的な次元に対応する必要があります。数量には、GPU の利用率、コストの帰属、スケーリングの挙動、リクエストのスループットなど、インフラストラクチャの運用上の健全性が含まれます。一方、品質には、応答の関連性、安全性への準拠、事実の正確性、専門的なトーンなど、モデルの継続的なパフォーマンスが含まれます。
Amazon SageMaker AI エンドポイントの拡張メトリクス、Amazon CloudWatch、および Amazon Managed Grafana を組み合わせることで、カスタム計測器なしで統一された観測可能性レイヤーを構築できます。拡張メトリクスにより、モデルごと、GPU ごとの粒度で共有...
原文を表示
Deploying large language models (LLMs) at scale on Amazon SageMaker AI Inference makes observability a critical pillar of any production machine learning (ML) strategy. Unlike conventional software that returns deterministic outputs, LLMs generate variable, free-form responses that are difficult to validate with standard metrics. LLM output quality can change over time as input distributions shift, and quality monitoring helps detect these changes early. For generative AI workloads, observability also includes the model serving infrastructure, where unpredictable token consumption, GPU memory pressure, and latency spikes make capacity planning and cost control a moving target.
A comprehensive observability approach for LLM inference must address two distinct but complementary dimensions: model serving infrastructure (quantity) and LLM quality. Quantity monitoring focuses on the operational health of inference infrastructure, tracking request throughput and resource utilization. These metrics help detect bottlenecks, right-size compute resources, and control costs. Quality monitoring focuses on the performance of the LLMs themselves, evaluating response accuracy, compliance, and consistency over time.
Most teams build LLM observability in stages. The first stage establishes visibility into core operational metrics such as latency, errors, and resource utilization. These signals confirm the reliability of inference endpoints. The next stage adds LLM quality through sampling and evaluation, which surface issues such as model drift, degradation, or unexpected behavior in generated responses.
With both dimensions in place, you can introduce thresholds and automated alerts that combine infrastructure and quality signals. Over time, the practice extends to comparative analysis across models and configurations so you can continuously tune cost, performance, and output quality. Quantity and quality metrics are interdependent: an endpoint can appear operationally healthy while producing poor or unsafe responses, or it can deliver high-quality outputs while running inefficiently on over-provisioned infrastructure. Production-grade LLM observability emerges when both dimensions are monitored, correlated, and optimized together.
This post demonstrates a comprehensive observability solution using Amazon Managed Grafana dashboards that provides a holistic view of both quality and quantity for LLMs served on Amazon SageMaker AI endpoints with inference components.
Workflow architecture
For full visibility into LLMs across the two monitoring dimensions of quantity and quality, we built a solution using three core AWS services, each chosen for a specific role in LLM observability. The following high-level data flow diagram shows the three core components: Amazon SageMaker AI endpoints with inference components, Amazon CloudWatch, and Amazon Managed Grafana.
Amazon SageMaker AI Inference Components serve as the model hosting layer. A single SageMaker AI endpoint can host multiple inference components, each running a different LLM (for example, gpt-oss-20b and Qwen2.5-7B-Instruct as shown in the preceding architecture). Inference components let you deploy, scale, and manage multiple models on shared infrastructure while keeping per-model isolation for traffic routing, scaling policies, and metric attribution.
Amazon CloudWatch serves as the centralized metrics store. It receives two distinct streams of data from each inference component: enhanced metrics and custom quality metrics. Enhanced metrics are published automatically by SageMaker AI when you enable them on the endpoint configuration. The metrics include instance-level, container-level, and per-GPU dimensions, giving you granular visibility into invocation counts, latency, error rates, and GPU/CPU utilization per model. Enhanced metrics are logged to the /aws/sagemaker/InferenceComponents/ namespace (for example, /aws/sagemaker/InferenceComponents/gpt-oss-20b). For details, see the Amazon SageMaker AI enhanced metrics documentation and the enhanced metrics deep-dive blog post.
Custom quality metrics capture LLM output quality, such as composite quality scores, safety scores, and evaluation latency. These are published to a separate user-configured CloudWatch namespace at /aws/sagemaker/inference-quality/, which keeps quality signals cleanly separated from operational metrics. The following table summarizes the two CloudWatch metric namespaces.
CloudWatch Metric Namespace
Captures
Purpose
/aws/sagemaker/InferenceComponents/
Enhanced metrics: instance-level, container-level, and per-GPU dimensions
Provides granular visibility into invocation counts, latency, error rates, and GPU/CPU utilization per model
/aws/sagemaker/inference-quality/
Custom quality metrics: composite quality scores, safety scores, and evaluation latency
Captures LLM output quality signals, kept cleanly separated from operational metrics
Amazon Managed Grafana provides the visualization layer, using CloudWatch as its native data source. In this post, we describe two dedicated dashboards that surface SageMaker AI endpoint LLM quantity and quality metrics, as shown in the following screenshot.
The Grafana quantity-based dashboard displays GPU memory utilization, CPU usage, and invocation metrics per inference component. The quality-based Grafana dashboard displays composite quality scores, safety scores, and quality evaluation latency, compared across models, as shown in the following image. You can extend the Grafana dashboard by creating new dashboards based on your business or application use cases.
Monitoring quantity
Quantity monitoring gives you operational visibility into LLMs served on SageMaker AI endpoints. Without it, you can lose track of traffic patterns, resource saturation, cost attribution, and scaling behavior, all of which directly impact availability and spend. For multi-model endpoints using inference components, quantity monitoring answers critical operational questions: How many requests is each model serving? Are GPUs right-sized or over-provisioned? Which model is driving cost?
Beyond infrastructure metrics, quantity monitoring helps you assess the operational health and business impact of your LLM inference components across performance and reliability, resource utilization, and any business metrics specific to your organization. Together, these views show where latency is occurring, whether cost increases are driven by traffic growth or inefficient GPU allocation, and whether scaling policies are responding appropriately to demand.
The following Amazon Managed Grafana dashboard samples put these quantity monitoring dimensions into practice across three key areas. The first group of panels covers LLM invocations and latency. As shown in the following sample Grafana dashboard output, panels display Model Latency as a time-series trend, Total Invocations comparing models (for example, gpt-oss versus Qwen), and Per-Copy Invocations broken down for each model. These panels help operators understand request throughput patterns, identify latency spikes, and compare invocation distribution across model copies.
The next panel focuses on GPU compute and memory utilization. The following Grafana dashboard samples present GPU Compute percentage and GPU Memory percentage panels for both the models (for example, Qwen and gpt-oss). This cross-model comparison helps ML engineers and site reliability engineers (SREs) quickly determine whether a performance issue is GPU-compute-bound or memory-limited, and whether one model is consuming disproportionate resources on shared infrastructure.
The third set of panels provides endpoint usage and cost details. The following Cluster Overview and Cost Grafana dashboard sample shows Used GPUs versus Free GPUs and Total Instances to visualize cluster capacity, alongside per-model Cost/hour panels (for example, gpt-oss and Qwen). This view shows which model is driving cost, whether GPUs are over-provisioned or saturated, and whether auto scaling policies are responding to demand.
The following table summarizes the three quantity monitoring areas covered in the Grafana dashboard, along with their associated metrics and purpose:
Metric Type
Dashboard Metric Names
Captures
Purpose
Model Invocations & Latency
Model Latency, Total Invocations (gpt-oss vs Qwen), Per-Copy Invocations (gpt-oss), Per-Copy Invocations (Qwen)
Request throughput, response time, and per-copy invocation distribution
Identify latency spikes, compare model throughput, and understand invocation load balancing across copies
GPU Compute & Memory Utilization
GPU Compute % (Qwen), GPU Compute % (gpt-oss), GPU Memory % (Qwen), GPU Memory % (gpt-oss)
Per-model GPU compute and memory utilization percentages
Determine if issues are GPU-compute-bound or memory-limited, and detect disproportionate resource consumption across models
Endpoint Usage & Cost
Used GPUs / Free GPUs / Instances, Cost/hour (gpt-oss), Cost/hour (Qwen)
Cluster capacity, GPU allocation status, and per-model hourly cost attribution
Identify cost drivers, detect over-provisioned or saturated GPUs, and validate auto scaling responsiveness
Together, these dashboards give operators a single pane of glass to correlate cost, capacity, and utilization across models served on the endpoint. To set up these dashboards in your environment, follow the AWS samples GitHub repository sample notebook and extend the solution to create dashboards tailored to your organization’s requirements.
Monitoring quality
While quantity metrics tell you whether the LLM serving infrastructure is healthy, quality metrics tell you whether LLMs are still performing as expected. LLM performance can degrade silently over time because of changes in input prompt distributions, concept drift, or shifts in real-world conditions. Unlike a latency spike or a 500 error, quality degradation rarely triggers traditional alerts.
Quality monitoring addresses this by evaluating model outputs across dimensions that matter to the business: response quality (relevance to user queries, factual accuracy, completeness, and consistency), safety and compliance (harmful content detection, bias monitoring, privacy compliance, and regulatory adherence), user experience quality (helpfulness, clarity, appropriate tone, and multi-turn conversation coherence), and domain-specific quality (technical accuracy for specialized domains, citation quality for Retrieval Augmented Generation (RAG) applications, and code correctness for programming assistants). Together, these dimensions help governance teams enforce guardrails, product owners track user-facing quality over time, and data scientists pinpoint whether a quality drop is caused by a specific prompt pattern, a model update, or a data distribution shift.
The following Amazon Managed Grafana dashboard sample output demonstrates quality monitoring across the SageMaker AI endpoint inference components (for example, LLMs gpt-oss-20b and Qwen2.5-7B-Instruct). The example dashboard tracks four quality scores, each displayed as a time-series line chart with configurable alert thresholds (shown as dashed lines at approximately 85% and 95%). The first panel shows the Composite Quality Score, an aggregate health indicator that combines quality dimensions. This metric displays the overall quality trend over time, making it straightforward to spot sustained degradation versus intermittent quality drops that may correlate with specific prompt types.
The second group of panels tracks specific LLM response quality metrics: Safety Score, Relevance Score, and Professional Tone Score. Safety Score monitors harmful or non-compliant content detection. On the dashboard output, this score remains the most stable of all four metrics, consistently hovering within the target threshold band, which indicates reliable safety guardrails across both models. Relevance Score measures how well LLM responses address user intent, helping teams identify prompt categories that may challenge an LLM’s comprehension. Professional Tone Score evaluates whether outputs maintain an appropriate tone for the deployment context.
These quality scores are computed using evaluation metrics such as an LLM-as-judge pattern with configurable evaluation rubrics. In these examples, we use Anthropic Claude Sonnet 4.6 served via Amazon Bedrock as the evaluator model, which is permitted under standard Amazon Bedrock service terms for LLM-as-judge use cases. You can substitute your own evaluation system, provided you confirm the chosen model’s terms permit evaluating outputs from other models, you verify the data-residency requirements are met, and you pin the evaluator model to a specific version so quality scores remain comparable over time.
At a glance, you can compare quality across LLMs side by side, identifying which LLM is more stable, which quality dimension is the primary risk driver, and whether quality issues are intermittent (suggesting sensitivity to specific prompt types) or sustained (suggesting model degradation). Beyond visualization, threshold-based alert rules are deployed automatically via Grafana Alerting, dimensioned by the inference component so that alerts fire per inference component. When a quality score breaches its configured threshold, you can receive these notifications via Amazon Simple Notification Service (Amazon SNS), enabling rapid SRE triage. Modern SRE teams use their existing automated triage processes, for example by integrating these alerts with Slack, PagerDuty, or OpsGenie to cut response times to seconds by automatically correlating logs, classifying alert severity, and prioritizing incidents for mitigation.
The following Grafana Alerting dashboard sample output shows threshold-based alert rules firing per inference component, with notifications routed to configured channels for immediate SRE triage.
This view gives governance and product teams the evidence needed to make decisions about engineering adjustments, remediation actions, root cause analysis, model swapping, or other refinements. To set up this dashboard in your environment and learn more about the quality metrics, follow the AWS samples GitHub repository notebook.
Conclusion
Observability of LLM inference stacks in production requires more than tracking uptime and error rates. As this post demonstrated, a comprehensive strategy must address two complementary dimensions: quantity and quality. Quantity covers the operational health of your infrastructure, including GPU utilization, cost attribution, scaling behavior, and request throughput. Quality covers the ongoing performance of your models, including response relevance, safety compliance, factual accuracy, and professional tone.
By combining Amazon SageMaker AI endpoint enhanced metrics, Amazon CloudWatch, and Amazon Managed Grafana, you can build a unified observability layer without custom instrumentation. Enhanced metrics give you per-model, per-GPU granularity on share
関連記事
今日のまとめ
AI日報で今日の重要ニュースをまとめ読み