Together AI、LLM推論用自動スケーリングエンドポイントを公開
本文の状態
日本語全文を表示中
詳細モードで約20分の本文を読めます。
同じ出来事の情報源
この情報源を基点に整理
Together AI Blog
Together AI は、LLM 推論専用のデプロイメントにおいて、CPU 指標の限界を克服し、リクエスト数や TTFT などの推論エンジン固有のメトリクスに基づいて自動スケーリングする機能を導入したと発表した。
AI深層分析を開く2026年8月1日 03:45
AI深層分析
キーポイント
LLM 特有のスケーリング課題の提示
GPU の利用率が低くてもキューが溜まる現象や、コールドスタートに数分を要する特性により、従来の CPU ベースの自動スケーリング手法では LLM 推論の負荷を正しく検知できないと指摘している。
過剰・不足プロビジョニングのコスト
GPU を低利用率で待機させる過剰プロビジョニングはコスト増となり、逆にリクエスト処理能力を超えるとキューイングが発生して TTFT が急激に悪化する不足プロビジョニングも深刻な問題となる。
推論エンジン固有メトリクスの採用
Together AI のプラットフォームでは、在-flight リクエスト数、TTFT(Time to First Token)、GPU 利用率、トークンスループットなど、推論エンジンの実態を反映する指標を選択して自動スケーリングを制御できる。
スケーリング挙動の調整機能
レプリカの上限・下限を設定し、スケールアップへの反応速度とスケールダウンへの待機時間を制御する 2 つのウィンドウを調整することで、ピーク時のトラフィックに対するデプロイメントの動作を最適化できる。
予測的なシグナルに基づく早期スケールアップの重要性
スプレッドが到達した後にスケールアップすると遅延が発生するため、良い自動スケーラーは先行指標(leading signals)に基づいて事前に行動する必要がある。
重要な引用
A GPU can read 60% utilized while the engine's request queue is already backing up and utilization is measuring arithmetic intensity, not pressure.
Over-provision - you're paying for GPUs to sit at 15% utilization just so that you can handle the peak traffic when/if it arrives.
Under-provision - your p95 degrades sharply the moment traffic exceeds what your replicas can batch.
This means that you can't scale your way out of a spike because by the time it arrives it's already too late to scale up.
編集コメントを表示
編集コメント
LLM の非線形的な挙動やコールドスタートの遅延を考慮したスケーリング戦略は、実運用における重要な課題である。Together AI が提供するメトリクス選択機能は、従来の汎用クラウドスケーリングの限界を超える具体的な解決策として注目される。
Source Article
元記事を日本語で読む
本文に関係しない購読案内、埋め込み通知、サイト内プロモーションは除いています。
LLM 推論のためのエンドポイント自動スケーリング
 imageimage
要約
Together AI プラットフォームの専用モデル推論(Dedicated Model Inference)を利用すれば、推論エンジンが実際に理解する指標に基づいてデプロイメントを自動スケーリングできます。具体的には、処理中のリクエスト数、最初のトークン到達時間(TTFT)、GPU 利用率、トークンスループットなどが挙げられます。
レプリカの上限・下限を設定し、監視対象の指標と目標値を選んだ上で、スケーリングアップにどの程度迅速に対応するか、スケーリングダウンにはどの程度待機するかを制御する 2 つのウィンドウ(時間幅)を調整します。適切な指標を選択することは極めて重要です。なぜなら、それはピーク時のトラフィック下でデプロイメントがどのように振る舞うかを決定し、ユーザーが体感するレイテンシに直接影響を与えるからです。
以下では、どの指標を選んで自動スケーリングを行うべきかについて解説するとともに、同じ負荷を 3 つの異なる自動スケーリングポリシーの下で再現した実験結果を紹介します。
過剰なリソース確保と不足は、どちらもコストがかかる
専用推論では、レプリカ分ごとに「1 分あたりの利用料」が発生するため、キャパシティプランニングは以下の 2 つの失敗モードの間でのバランスが求められます。
過剰にリソースを確保すると、ピーク時のトラフィックに対応するために GPU を稼働させておくことになりますが、実際には利用率が 15% 程度で放置されることが多く、コストの無駄になります。特に現在の GPU が不足している環境では、このアプローチは現実的ではありません。
逆にリソースを過小評価すると、トラフィックがレプリカの処理能力を超えた瞬間に p95 レイテンシが急激に悪化します。LLM の推論サービスは非線形的な挙動を示すため、レプリカが並列処理の限界に達しても「少し遅くなる」程度で済むわけではありません。キューイングが発生し、最初のトークン生成までの時間(TTFT)が 200 ミリ秒から 15 秒にも跳ね上がることがあります。
「 autoscale すればいい」というのは一見もっともらしい解決策ですが、ステートレスな Web サービスでは機能しても、LLM の推論サービスには通用しません。これは従来の自動スケーリングが前提とする二つの条件を崩すからです。
CPU 型のメトリクスは、実際の負荷を正しく示さないことがあります。GPU の利用率が 60% と表示されていても、エンジンのリクエストキューはすでに溢れ始めており、その数値は演算の集中度を示しているだけで、システムへの圧力を表していません。このように誤った信号に基づいてスケーリングを行うと、実際の課題を反映していない数字に反応する結果となり、適切な対応が遅れてしまいます。
コールドスタートには数分かかることもあります。新しいレプリカが GPU ノード上に配置され、数十ギガバイトの重み付けデータをダウンロードし、VRAM に読み込んでウォームアップするまでに時間がかかるためです。つまり、急激な負荷増加に対して「スケーリングで乗り切ろう」という発想は通用しません。なぜなら、スケーリングが完了する頃にはすでに遅すぎるからです。したがって、優れたオートスケーラーの役割は、先行指標に基づいて早期に行動することにあります。
これらの微妙な違いや、顧客ごとの要件の違いを考慮し、当社のプラットフォームでは推論に特化したメトリクスカタログを提供しています。これにより、デプロイメントのスケーリング方法を自由に選択できます。この記事では、最適な設定を選ぶためのポイントを解説します。
仕組み
各デプロイメントには、スケーリングポリシーが設定されています。これはレプリカの上限・下限、ターゲット値を持つ 1 つ以上のスケーリングメトリクス、そしてタイミングウィンドウで構成されます。
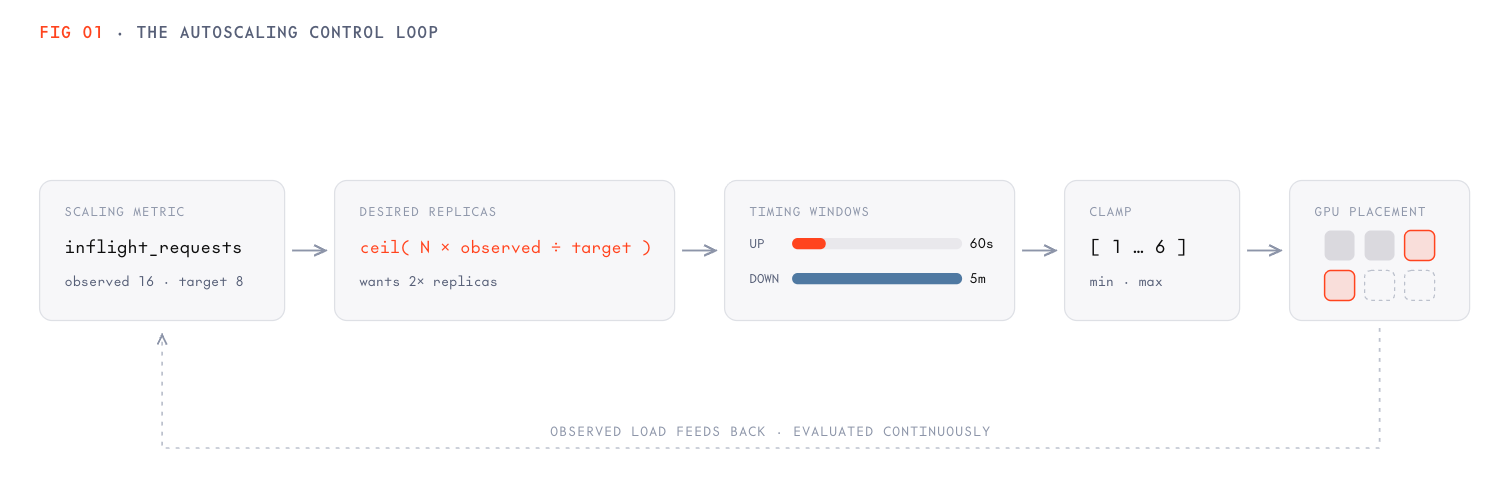
制御ループは以下の手順で動作します。観測されたメトリクス → 目標レプリカ数(ceil(N × observed/target))→ タイミングウィンドウによる減衰 → バウンド値への制限 → GPU 配置。観測された負荷がフィードバックされ、このループは継続的に評価されます。トラフィックの分割も容量に応じて自動的に調整されます。
コアとなるループは比例制御に基づいています。例えば、レプリカあたり8件の並行リクエストを目標とし、実際に16件観測された場合、システムは2倍のレプリカ数を要求します(ただし、その数が最小・最大値の範囲内であることが条件です)。
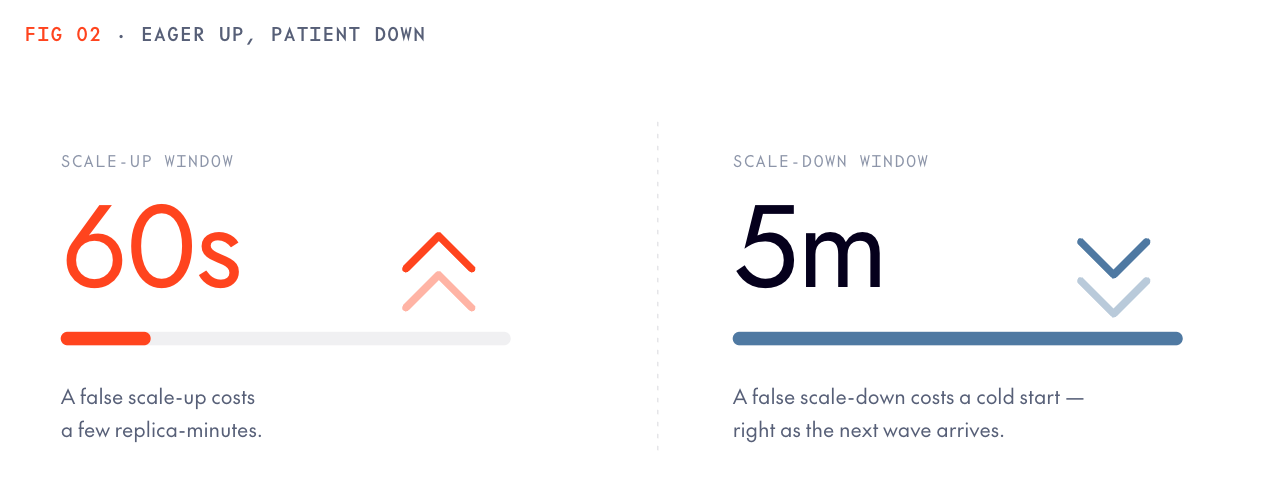
レプリカ数の振動を防ぐために、タイミングウィンドウを活用してデバウンシング効果を持たせることができます。具体的には以下のパラメータを設定します。
- scale_up_window: レプリカを追加する前に圧力が継続する必要がある時間です。短めに設定しましょう。誤ってスケールアップしてもコストは数分間のレプリカ稼働分に過ぎませんが、逆にスケールアップが遅れるとユーザーが体感するレイテンシが増加します。
- scale_down_window(デフォルト5分): レプリカを削除する前にトラフィックが落ち着き続ける必要がある時間です。これはトラフィックの自然なリズムよりも長く設定してください。誤ってスケールダウンすると、次のピーク到来時にコールドスタートが発生するリスクがあります。
「即座にスケールアップし、慎重にスケールダウンする」という非対称的なトレードオフを適切にチューニングすることは極めて重要です。これには、自社のトラフィック分布に対する直感的な理解が不可欠です。アップウィンドウの誤りは金銭的コスト(ドラー)を招きますが、ダウンウィンドウの誤りはレイテンシ増大と金銭的コストの両方を引き起こします。なぜなら、すぐに再びスケールアップせざるを得なくなり、その際にコールドスタートのコストを再度支払うことになるからです。

設定は単一の PATCH リクエストで行えます。
      tg beta endpoints update $DEPLOYMENT_ID \
--min-replicas 1 --max-replicas 6 \
--scale-up-window 60s --scale-down-window 300s \
--scaling-metric ttft --scaling-target 500 --scaling-percentile p95
設定する際に留意すべきポイントはいくつかあります。
- min_replicas と max_replicas を同じ値に設定すると、固定サイズのデプロイとなり、オートスケーリングは事実上無効になります。
- 両方を 0 に設定すると(min_replicas = max_replicas = 0)、デプロイが停止し、ステータスは「STOPPED」になります。この状態では課金も停止するため、開発用エンドポイントを一時停止する手段として利用できます。
- スケーリング範囲を指定すればオートスケーリングが有効化されます。境界値を設定しても指標(メトリクス)を指定しない場合、プラットフォームはデフォルトの「inflight_requests」を採用し、ターゲット値を 8 に設定します。
オートスケーリングの仕組み:対象となるメトリクス
オートスケーリングに使用できるメトリクスは全部で 8 つあります。どの指標を選ぶかは、デプロイを何から守りたいかによって異なります。

オートスケーリングのメトリクスには、並行処理ベース(先頭に来るものが安全なデフォルト)、SLO ドライブ型(後方に位置し、約束に基づいてスケールする)、効率性重視型(コスト最優先)があります。複数の指標を指定した場合、リスト内の最初のものが採用されます。
適切なメトリクスを選ぶための 3 つの視点:
並列処理駆動型(inflight_requests)の指標は、安全なデフォルトとして推奨されます。リクエストがサービス能力を上回った際、レイテンシが可視化される前にインフラント数が上昇するため、これは先行指標となります。このメトリクスにはストリーミングやパーセンタイル値の選択は不要で、エンジンがリクエストをバッチ処理する仕組みに直接対応しています。例えば「各レプリカで約 8 つの並列リクエストを処理したい」という場合、ターゲット値を 8 に設定します。バッチ処理に適した短いプロンプトのチャットワークロードではこの値を上げ、事前計算(prefill)に時間がかかるコーディングエージェント向けの長文コンテキストトラフィックでは下げるなど、用途に応じて調整可能です。
SLO(サービスレベル目標)に基づくメトリクス(ttft, e2e_latency)については、ユーザーとの契約が「最初のトークン生成を 1 秒以内」という場合、ttft の p95 をターゲットにすることでその条件に正確に対応できます。ただし、レイテンシは後行指標であるため、p95 が設定された閾値を超えた時点ではユーザーが既に遅延を感じ始めている可能性があります。そのため、通常は遅延メトリクスと併用し、最小レプリカ数(min_replicas)には十分な余裕を持たせるべきです。
もう一つ注意すべき点は、トークン単位のメトリクスにはストリーミングトラフィックが必要だということです。ttft、デコーディング速度、レプリカあたりのスループットは、ストリーミング経路でのみ出力されます。クライアントがストリーミングを利用しない場合、これらのメトリクスにはデータが存在せず、 autoscale ポリシーの構築に使用すべきではありません。(e2e_latency は例外で、ストリーミング・非ストリーミング両方のワークロードで測定されるため利用可能です。)
効率重視の autoscaling(自動スケーリング)では、GPU 利用率やトークン利用率といった指標を駆使して、ハードウェアの性能を最大限引き出すことが目的です。コスト削減に最適化されたこのアプローチは、「レプリカを常に稼働させ、 fleet(クラスター全体)が実際に飽和した時だけ容量を追加する」という方針に基づいています。
ただし、これらの指標を使う際には、「利用されている状態」があなたのワークロードにおいて何を意味するのかを正しく理解する必要があります。GPU が繁忙であっても、レイテンシの観点からは健全でないケースがありますし、利用率を 100% に近づけると、突発的なリクエスト増加に対応できる余裕(ヘッドルーム)がなくなります。利用率に基づいてスケーリングを行う場合は、Grafana の p95 レイテンシチャートを注意深く監視する必要があります。
どの指標をスケーリングの基準にするか選ぶ際は、以下の表を念頭に置いておくと役立ちます。
| Metric | Measures | Type | Good to use when |
|---|---|---|---|
| TTFT p95 @ c16 | inflight_requests | AVERAGE_VALUE | デフォルト。頑健で、エンジンに依存しない指標です。 |
| ttft | Time to first token | VALUE • percentile (default p95) | 応答性に関するレイテンシ SLO(サービスレベル目標)がある場合。値:323 ms |
| e2e_latency | Full request latency | VALUE • percentile | 全体の完了時間に関する SLO がある場合。値:368 ms |
| gpu_utilization | GPU busy % | UTILIZATION (0–100) | コスト最優先で、レイテンシの変動を許容できるワークロード向け |
| token_utilization | Token-capacity usage | UTILIZATION | エンジンの限界に近いバッチ処理やスループット重視のワークロード向け |
| throughput_per_replica | Tokens/s each replica sustains | AVERAGE_VALUE | 持続的な生成パイプライン向け |
| decoding_speed | Per-request tokens/s | VALUE | ユーザーごとの生成速度を担保したい場合 |
各指標は、コスト最適化かレイテンシ保証か、あるいはスループット最大化など、目的に応じて使い分けるのが効果的です。
キャッシュヒット率
プレフィックス・キャッシュの有効性
リソース利用率
専門的:キャッシュ集約型のサービスパターンに特化
アイドル時のシャットダウンとコールドスタートについて
自動ウェイク機能を備えたスケール・トゥ・ゼロは利用できません。min_replicas を 0 に設定できるのは、max_replicas も同時に 0 にした場合のみです。これはデプロイを明示的に停止するための手段であり、ウェイクには手動でのアクションが必要です。停止中のデプロイ宛てのリクエストはエラーを返すだけで、自動的に起動がトリガーされることはありません。つまり、開発環境やステージング環境のエンドポイント設計では、自動停止機能と手動再起動の時間枠を組み合わせて計画する必要があります。
tg beta endpoints update dep_abc123 --min-replicas 0 --max-replicas 0 # explicit stop
この自動停止機能を利用する際は、「コールドスタートに許容される予算」を理解しておくことが重要です。コールドスタートは、以下のフェーズから構成されると考えられます。
GPU の配置 → 重みのダウンロード → エンジンの読み込み → ウォームアップ
デプロイのイベントフィード(pod.startup_phase_changed)では、これらの各フェーズがタイムスタンプとして記録されます。
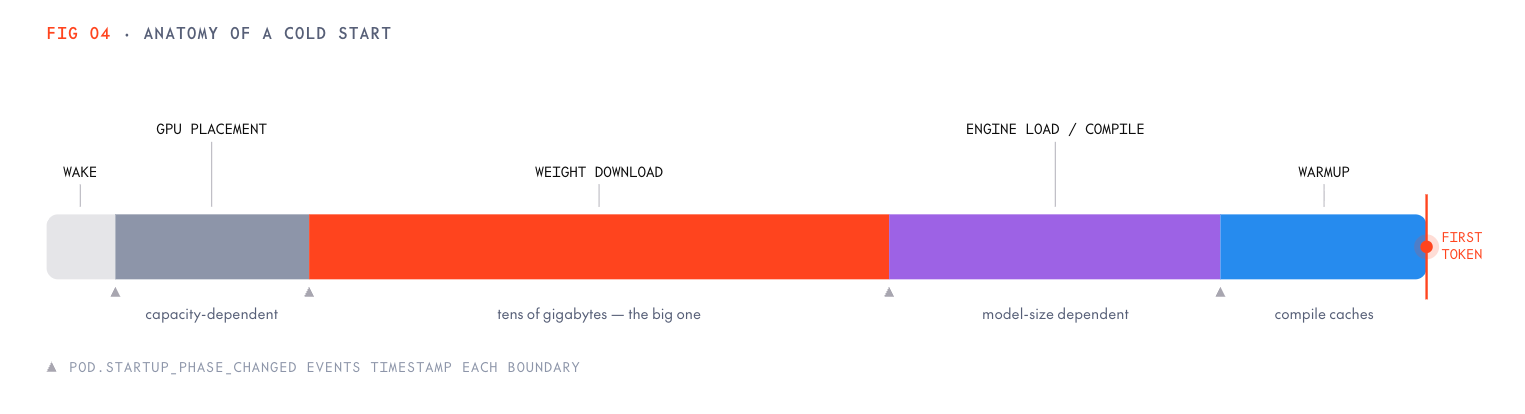
モデルサイズが大きくなるほど、重みのダウンロードやエンジン読み込み、ウォームアップに要する時間は比例して長くなります。これらの数値を具体的に把握するために、以下に 1×H100 レプリカを備えたウォームなクラスターで実行した際の測定結果を示します。
シナリオ 測定値
ベースカタログモデル(Qwen3.5-9B)、作成→レプリカ READY 86 秒(イメージプル約 30 秒 → 起動約 30 秒 → レディ)
カスタムファインチューニング、新規 18GB の重み、作成→READY 145 秒
レプリカが READY 状態から、ルーティングを通じて最初のトークンが提供されるまでには +26〜40 秒かかります。
スケールアップ(レプリカ数を 1 から 2 に増やす)には約 2.5 分かかります。
STOPPED 状態からの再起動(重み付けデータはすでにプラットフォーム側に存在するため)には約 1〜2 分が必要です。
これらの待ち時間はすべて「分」単位で計測されている点に注意してください。つまり、自動停止が効果を発揮するのは、利用間のギャップが再起動時間や最初のユーザーの待機許容度に対して十分に長い場合に限られます。また、アイドル期間後の最初のユーザーが、明示的な開始処理(またはエラー発生後の再試行フロー)を許容できるかどうかも重要な要素です。
このトレードオフは開発用やステージング用のエンドポイントであれば問題ありませんが、p95 の SLO を満たす必要がある場合や、無人で呼び出されるシステムにおいては、通常 min_replicas: 1 を設定して常時稼働させるべきです。
エッジケース
- コールドスタートよりも速いトラフィックの急増が発生した場合、実際には何が起きるのでしょうか?
リクエストは既存のレプリカにキューイングされ、インフライトリクエスト数やエンジンキューの深さが増加します。その結果、TTFT(Time To First Token)が最初に悪化し、その後エラーやタイムアウトのリスクが高まります。新しいレプリカが起動するまでの間、この状態が続きます。つまり、90 秒でトラフィックが 10 倍に急増し、コールドスタートに 4 分かかる場合、対策は「最小レプリカ数の余裕」か「常に予備容量を確保するためのより高いターゲットポリシー」のどちらかに限られます。これはチューニングの問題というよりも、キャパシティ設計に関する問題であり、本番リリース前に解決しておくべき課題です。
- オートスケーラーがロールアウトと競合することはあるのでしょうか?
いいえ、ありません。ロールアウト中もプラットフォームは両方のデプロイメントに対してオートスケーリングの上限・下限を固定します。もしこの制限がない場合、ステップ途中でスケールダウン判断が下されると、ロールアウトによるレプリカ数の変更が元に戻されてしまいます。設定したバウンズ(境界値)は、ロールアウトが完了するか中止された際に自動的に復元されます。
- スケーリングとトラフィック分割はどう連携するのでしょうか?
これはスムーズに処理されます。トラフィック分割の重み付けは「準備完了状態のレプリカ単位」で適用されるためです(キャパシティ = 重み × 準備完了レプリカ数)。デプロイメントがスケールアップすると、自動的に比例してより多くのトラフィックを吸収し、ルーティングの変更は不要です。オートスケーリングとルーティングは、同じキャパシティの状況を共有しています。
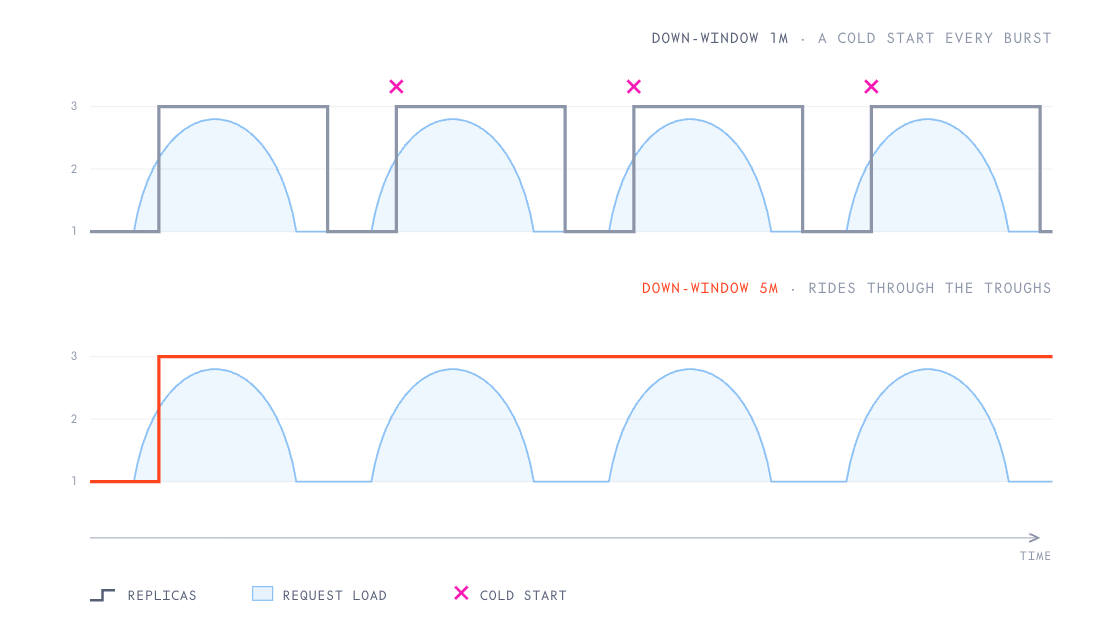
- なぜレプリカ数がノコギリ状(サートゥース)に見えるのでしょうか?
スケーリングダウンのウィンドウが、トラフィックのリズムよりも短いことが引き起こす典型的な症状です。バースト性の高いトラフィックに 1 分間のダウンウィンドウを組み合わせると、谷間では常にスケールダウンし、山場では毎回コールドスタートが発生してしまいます。
これを解決するには、ノコギリ状の波形が平坦化するまで scale_down_window を広げる必要があります。これにより、繰り返されるコールドスタートを解消するために、数分のレプリカ分というコストを払うことになります。
異なるポリシーで同じ負荷を自動スケーリングする実験
Qwen3.5-9B のデプロイメント(レプリカあたり H100 を 1 基、上限・下限はそれぞれ 3 と 1)を対象に、各ラウンド開始前に必ず 1 レプリカにリセットした状態で、同じスクリプトによる負荷を 3 回再生しました。負荷パターンは約 12〜48 RPS の正弦波に、80 rps のスパイクが 2 回加わったものです。
この実験を、以下の 3 つの異なる自動スケーリングポリシーの下で繰り返しました。
- inflight_requests ターゲット:8
- ttft p95 ターゲット:300 ms
- gpu_utilization ターゲット:75%

| ポリシー | スケーリングされたか? | レプリカ・分 | リクエスト数(エラー) | 結果 |
|---|---|---|---|---|
| inflight_requests (8) | 1→2→3 | 26 | 40.6k (536) | 波の動きに即座に対応。追加されたキャパシティにより、ウィンドウ中の p95 が視覚的に低下した |
| ttft p95 (300ms) | なし | 18 | 46.4k (6) | エンジンの TTFT は終始ターゲット値を下回っており、スケーリングは発生しなかった |
| gpu_utilization (75%) | なし | 18 | 46.5k (2) | GPU 利用率が 75% を超えることはなく、スケーリングは発生しなかった |
上記のテスト結果から得られた3 つの教訓があります。
まず、並列処理数のシグナルだけが正しく機能しました。この負荷下ではクライアントの p95 レイテンシが 3〜5 秒に達し、明らかにシステムが飽和状態でしたが、「トークン到達までの時間(TTFT)」に基づくポリシーはスケールしませんでした。これは、エンジン側で連続バッチ処理が行われているためです。エンジンはキューの圧力を「最初のトークンまでの時間」ではなく「全体のレイテンシ」に吸収してしまいます。また、GPU 利用率もスケールしませんでした。短いリクエストがバースト状に来る場合、GPU の使用率は 75% の閾値を下回るままになるからです。両方のポリシーは、システムが飽和しているにもかかわらず健全な信号を出力していました。その中で「同時実行中のリクエスト数(inflight_requests)」だけが、直接キューの圧力を示すシグナルとして問題を捉えることができました。これがデフォルトでこの指標が採用されている理由です。
2 つ目に、キャパシティの増強は約束通り効果を発揮しました。「同時実行中のリクエスト数」ポリシーが 2 つのレプリカを維持していた期間(約 6〜11 分)には、同じ負荷条件下でも p95 レイテンシが単一レプリカのポリシーよりも明らかに低く抑えられており、中央のパネルでその差が明確に確認できます。
3 つ目に、ポリシーを選択する前に各レプリカの飽和点を把握しておく必要があります。1 つのレプリカであれば、p95 レイテンシが 3〜5 秒でも 12〜48 rps のスループットを維持して安定稼働できます。しかし、SLO(サービスレベル目標)を 500 ms に設定している場合、この運用は許容できません。
実際に試してみましょう!
デフォルト設定から始め、その後の調整は実測データに基づいて行ってください:
まず、実際の運用範囲を設定します。最小値はベースロードで必要なリソースに、最大値は予算が許す範囲に設定し、デフォルトの同時実行リクエスト数は 8 にします。
次に、メトリクス API を通じて一週間のトラフィックを監視します。レプリカ数、キューの圧力、p95 レイテンシといった指標を確認してください。
その上で微調整を行います。レイテンシ SLO の要件が厳しい場合は、ストリーミング対応なら TTFT(First Token Time)ポリシーを追加します。コスト削減が優先される場合は、正直な p95 モニタリングに基づいてリソース利用率を最適化します。スケーリングのサワートゥース現象が発生する場合は、ダウンウィンドウを広げて調整してください。
原文を表示
Choosing scaling metrics, tuning windows, and budgeting for cold starts on dedicated inference.
Summary
With Dedicated Model Inference on the Together AI platform you can get your deployments to autoscale on metrics the inference engine actually understands, such as in-flight requests, TTFT, GPU utilization, token throughput. You can set replica bounds, pick a metric and target, and then tune two windows that control how eagerly it scales up and how patiently it scales down. Understanding and choosing the right metric is important because it determines how your deployment will behave under peaky traffic and impacts the latency your users will see. Below we'll cover how to choose the right metric to autoscale on and show an experiment where the same load was replayed under three different autoscale policies.
Over- and under-provisioning are both expensive
With dedicated inference you pay per replica-minute, which makes capacity planning a balance between two failure modes:
- Over-provision - you're paying for GPUs to sit at 15% utilization just so that you can handle the peak traffic when/if it arrives. Almost never viable, especially in the current GPU constrained environment.
- Under-provision - your p95 degrades sharply the moment traffic exceeds what your replicas can batch. LLM serving degrades nonlinearly: a replica at its concurrency limit doesn't get "a bit slower," it starts queueing, and TTFT can blow up from 200ms to 15s.
"Just autoscale it" is the obvious answer, and for stateless web services it mostly works. But LLM serving is a different beast and it breaks the two assumptions that classic autoscaling leans on:
- CPU-style metrics lie about load. A GPU can read 60% utilized while the engine's request queue is already backing up and utilization is measuring arithmetic intensity, not pressure. Scaling deployments on the wrong signal means that the system will respond to a number that doesn't describe the actual problem.
- Cold starts can take several minutes. A new replica has to be placed on a GPU node, pull tens of gigabytes of weights, load them into VRAM, and warm up. This means that you can't scale your way out of a spike because by the time it arrives it’s already too late to scale up. This then means that a good autoscaler's job is to act early on leading signals.
Due to these nuances and the varying requirements of each customer our platform gives you a catalog of inference-native metrics and allows you to choose how your deployment scales. This post helps you choose well!
How it works
Each deployment carries an autoscaling policy: replica bounds, one or more scaling metrics with targets, and timing windows.
The control loop goes as follows: observed metric → desired replicas (ceil(N × observed/target)) → timing windows dampen → clamp to bounds → GPU placement. Observed load feeds back and the loop evaluates continuously with the traffic split following capacity automatically.
The core loop is proportional, meaning that if you target 8 in-flight requests per replica and you're observing 16, the system will want twice the replicas(assuming the 2x replicas are within the min, max bounds). The timing windows can be used to add a de-bouncing effect so that the replica count doesn't oscillate:
- scale_up_window: how long the pressure must persist before adding replicas. Keep it short; the cost of a false scale-up is just a few replica-minutes, whereas the cost of a missed one is increased user-facing latency.
- scale_down_window (default 5m): how long things must stay calm before removing replicas. Keep it longer than your traffic's natural rhythm; the cost of a false scale-down could be a cold start right when the next peak arrives.
This asymmetric tradeoff of an eager up and patient down autoscale window is very important to tune and requires an intuitive understanding of your particular traffic distribution. Up-window mistakes cost dollars while down-window mistakes cost latency *and* dollars (because you'll just want to scale right back up, paying the cold start on the way back up).
Setting it is one PATCH:
tg beta endpoints update $DEPLOYMENT_ID \
--min-replicas 1 --max-replicas 6 \
--scale-up-window 60s --scale-down-window 300s \
--scaling-metric ttft --scaling-target 500 --scaling-percentile p95
A few settings to keep in mind:
- min_replicas == max_replicas : this results in a fixed-size deployment, autoscaling is effectively off.
- Setting both to min_replicas = max_replicas = 0 → the deployment stops (state STOPPED, billing stops). This can be used as a way to pause your dev endpoint.
- Giving a range turns scaling on; if you set bounds but no metric, the platform applies the default: inflight_requests with a target of 8.
Under the hood: metrics to autoscale on
Eight metrics that you can autoscale on. Picking the right one depends on what you're trying to protect your deployment against.
Autoscaling metrics include concurrency-driven (leading; the safe default), SLO-driven (trailing; scale on the promise), efficiency-driven (cost-first). If you attach multiple metrics the first one in the list is used.
Three ways to think about picking the right metric:
- Concurrency-driven (inflight_requests) is a safe default. In-flight count is a leading indicator: it rises when demand outpaces service but before latency visibly degrades. This metric doesn’t need streaming or a percentile choice and it maps directly onto how engines batch requests. A target of 8 for this metric says "I want each replica handling about eight concurrent requests". You can raise it for short-prompt chat workloads that batch well, and lower it for coding agent long-context traffic that takes longer to prefill.
- SLO-driven metrics (ttft, e2e_latency): If your contract with users is "first token in under a second," scaling on ttft p95 targets exactly this. Latency is a trailing signal which means that by the time p95 breaches the set threshold, users can already notice it, so you should typically pair a latency metric with honest headroom in min_replicas.
- Another thing to keep in mind is that per-token metrics need streaming traffic. ttft, decoding_speed, and throughput_per_replica are only emitted on the streaming path. If your clients don't stream, these metrics have no data and you shouldn’t build your autoscale policy on them. (e2e_latency is an exception because it's measured for streaming and non-streaming workloads).
- Efficiency-driven (gpu_utilization, token_utilization): squeezing the most out of your hardware. These optimize for cost: keep replicas busy, add capacity only when the fleet is genuinely saturated. When using these metrics you need to understand what "utilized" truly means for your workload. A GPU can be busy without the workload being latency-healthy, and utilization targets near 100% leave no headroom for arrival bursts. If you scale on utilization you should watch your p95 Grafana chart closely.
This is a good table to keep in the back of your mind when selecting the metric to scale on:
Metric
Measures
Type
Good to use when
TTFT p95 @ c16
inflight_requests
Concurrent requests per replica
AVERAGE_VALUE
Default. Robust, leading, engine-agnostic
368 ms
ttft
Time to first token
VALUE • percentile (default p95)
You have a latency SLO on responsiveness
323 ms
e2e_latency
Full request latency
VALUE • percentile
SLO on total completion time
gpu_utilization
GPU busy %
UTILIZATION (0–100)
Cost-first workloads that tolerate latency variance
token_utilization
Token-capacity usage
UTILIZATION
Batch/throughput workloads near engine limits
throughput_per_replica
Tokens/s each replica sustains
AVERAGE_VALUE
Sustained-generation pipelines
decoding_speed
Per-request tokens/s
VALUE
Guarding generation speed per user
cache_hit_rate
Prefix-cache effectiveness
UTILIZATION
Specialist: cache-heavy serving patterns
Idle shutdown and cold starts
There is no scale-to-zero-with-automatic-wake. min_replicas: 0 is legal only together with max_replicas: 0 which is a way to explicitly *stop* the deployment. Waking requires an explicit action and requests to a stopped deployment return an error rather than triggering a start. This means that you should plan dev and staging endpoints around auto-stop plus explicit restart windows.
tg beta endpoints update dep_abc123 --min-replicas 0 --max-replicas 0 # explicit stop
The cold-start budget is important to understand when using this auto-stop functionality. You can think of a cold start as consisting of the following phases: GPU placement → weight download → engine load → warmup and the deployment's event feed timestamps each of these phases (pod.startup_phase_changed):
Larger models might have proportionally longer weight downloads, engine loads and warmup periods. To get a better feel for these numbers we present what we got across runs on 1×H100 replicas on warm clusters below:
Scenario
Measured
Base catalog model (Qwen3.5-9B), create → replica READY
86s (PullingImage ~30s → Starting ~30s → ready)
Custom fine-tune, fresh 18GB weights, create → READY
145s
Replica READY → first token served through routing
+26–40s
Scale-up 1→2 replicas
~2.5 min
Restart from STOPPED (weights already platform-side)
~1–2 min
Notice that these windows are measured in minutes which means that auto-stop only pays off when the gaps between uses are long relative to the restart and when the first user after an idle period is willing to tolerate an explicit start (or an error-then-retry flow). This tradeoff is okay for Dev and staging endpoints but for anything with a p95 SLO or unattended callers you should typically keep min_replicas: 1.
Edge cases
- A spike arrives faster than a cold start. What actually happens?
- Requests queue on existing replicas (the inflight_requests and engine queue depth will increase) and latency will degrade with TTFT increasing first followed by error/timeout risk while new replicas come up. This means that if your traffic can spike 10× in 90 seconds and your cold start is 4 minutes, the only defenses are min_replicas headroom or a higher-target policy that keeps slack capacity up. This is more of a capacity-shape question than a tuning question, and it's better answered before launch day.
- Will my autoscaler fight a rollout?
- No. While a rollout is in flight, the platform pins autoscaling bounds on both deployments; the rollout's replica counts would otherwise be undone by a scale-down decision mid-step. Your configured bounds are restored automatically when the rollout completes or aborts.
- How does scaling interact with the traffic split?
- This is handled smoothly because traffic-split weights are per ready replica (capacity = weight × ready replicas), a deployment that scales up automatically absorbs proportionally more traffic with no routing change. Autoscaling and routing work off the same capacity picture.
- Why does my replica count look like a sawtooth?
- This is the classic symptom of a scale-down window shorter than your traffic's natural rhythm. Bursty traffic + 1-minute down-window = scale down in every trough, cold start in every crest. To resolve this you should widen scale_down_window until the sawtooth flattens. This allows you to trade a few replica-minutes to eliminate repeated cold starts.
Autoscaling the same load with various policies
We ran this experiment on a Qwen3.5-9B deployment (1×H100 per replica, bounds 1–3), reset to exactly 1 replica before each round, then the same scripted load replayed three times: a sine wave between ~12 and ~48 RPS with two 80 rps spikes. This was repeated under three different autoscaling policies:
- inflight_requests target 8
- ttft p95 target 300 ms
- gpu_utilization target 75%
Policy
Scaled?
Replica-minutes
Requests (errors)
What happened
inflight_requests (8)
1→2→3
26
40.6k (536)
Reacted to every wave; its extra capacity visibly lowered p95 mid-window
ttft p95 (300ms)
never
18
46.4k (6)
Engine TTFT stayed under target throughout; no scaling seen
gpu_utilization (75%)
never
18
46.5k (2)
Utilization never crossed 75%; no scaling seen
Three lessons from the above runs:
- Only the concurrency signal fired. Client p95 ran at 3–5 seconds under this load and clearly saturated yet the ttft policy never scaled, because engine-side time-to-first-token stayed low: continuous batching by the engine absorbs queue pressure into total latency, not first-token latency. And gpu_utilization never scaled because short, bursty requests leave the GPU under its 75% bar. Both policies were reading signals that looked healthy while the system was saturated. inflight_requests , the direct queue-pressure signal was the only one that saw the problem and this is why it's the default.
- Capacity helps exactly as promised. During the stretch where the inflight policy held 2 replicas (minutes ~6–11), its p95 runs visibly below the single-replica policies on the identical load and the middle panel shows the gap.
- Know your replica's saturation point before selecting a policy. One replica served 12–48 rps at 3–5s p95 without falling over but if you have a 500 ms SLO this would be a no-go.
Try it yourself!
Start with the defaults, then tune from evidence:
- Set real bounds (min = what your base load needs, max = what your budget tolerates) and take the default inflight_requests target 8.
- Watch a week of traffic in the metrics API: replica count, queue pressure, p95.
- Only then, tune: latency SLO → add a ttft policy (if you stream); cost pressure → try utilization with honest p95 monitoring; sawtooth → widen the down-window.
📚 Docs: Dedicated Model Inference → Autoscaling
関連記事
今日のまとめ
AIデイリーブリーフで今日の重要ニュースをまとめ読み