LLM プロバイダーの性能評価:レイテンシ、スループット、稼働率を測定する手法
OpenRouter は、同一モデルでもプロバイダごとに性能が異なるため、遅延・スループット・稼働率・量子化の 4 つの指標で評価し、ルーティングポリシーに反映させるべきだと提案している。
AI深層分析を開く2026年7月28日 11:02
AI深層分析
キーポイント
プロバイダごとの性能差異の実態
同じモデル名でも、インフラやルーティング、量子化設定の違いにより、初回トークンまでの時間や負荷時の挙動が劇的に変化する。
評価に用いる 4 つの主要指標
遅延(初回トークンまで)、スループット(出力トークン数/秒)、稼働率、量子化精度の 4 項目を定量的に測定する必要がある。
統計値の適切な解釈と選択
ユーザー体験には平均値より p90/p99 の遅延が重要であり、バッチ処理では p50 で評価するのが適切である。
動的なルーティングポリシーの実装
ベンチマーク結果をハードコードするのではなく、測定値に基づいてプロバイダの優先順位やフォールバック設定を自動化するべきだ。
TTFT とスループットは別々の体験を評価する
最初のトークンまでの時間(TTFT)と生成後の出力速度は、それぞれチャットや長文生成など異なるユースケースで重要となる。一方が優れていても他方が劣っていれば、ユーザー体験全体が悪化する可能性がある。
重要な引用
The same model behaves differently across provider endpoints. Infrastructure, quantization, load handling, and routing defaults all change the result.
Read latency at p90/p99, not the average. The tail is what user-facing apps actually feel.
Quantization is the hidden quality variable.
A provider with strong TTFT can still produce a weak long-form experience if its sustained token rate drops, while a provider with strong throughput can still feel poor in a chat interface if the first token arrives late.
編集コメントを表示
編集コメント
この記事は、大規模言語モデルの導入において「モデル名」に固執する傾向への警鐘として機能する。プロバイダごとのインフラ差を無視した選定が、実際のユーザー体験やシステム安定性に悪影響を与える可能性を指摘しており、実務レベルでの最適化に必要な視点を提供している。
開発者が大規模言語モデル(LLM)の選定を始める際、Claude、Llama、Gemini、DeepSeek といったモデル名から選び、プロバイダーは二次的な判断要素として扱うケースがよく見られます。これは理解できる傾向ですが、モデルを選んだだけでは、特定の提供元のエンドポイントを通じて実際にどの程度パフォーマンスを発揮するかまでは分かりません。
同じモデルでも、複数の提供元エンドポイントを経由して利用可能です。各エンドポイントは、インフラ構成やルーティングの挙動、量子化(quantization)の選択、そして障害のパターンが異なります。ユーザーやシステムは、これらの違いを実用的な形で体感します。あるプロバイダーは最初のトークンを素早く返す一方で、その後の応答では速度が低下することがあります。別のプロバイダーは精度の低いバリアントを提供し、難しいプロンプトに対して結果がずれてしまうこともあります。また、通常のトラフィック下では良好に動作しても、負荷がかかると失敗するケースもあります。
提供元の評価とは、モデルを単体の製品として扱うのではなく、それぞれのサービング環境を比較することです。ユーザーが最初のトークンを受け取るまでの待ち時間はどのくらいか、応答の残りがどれほど速く届くのか、負荷下での挙動はどうなのか、そしてモデルが動作している精度レベルは何か——こうした点を問います。
このガイドでは、実際にアクションを起こせる順序で、すなわちレイテンシ(遅延)、スループット、稼働率、量子化の順にこれらの問いに迫ります。これらのトレードオフを測定できるようになったら、次は測定結果をルーティングロジックに変換する段階です。これにより、単一のベンチマークテストで最も速かった提供元をハードコードしてしまわないよう、アプリケーションが柔軟に対応できるようになります。
Tl;dr
同じモデルでも、プロバイダーのエンドポイントによって挙動が異なります。インフラや量子化(quantization)、負荷処理、ルーティングのデフォルト設定などが結果を変え、モデル名が同一であっても違いが生じます。
プロバイダーのパフォーマンスを決めるのは 4 つの指標です。レイテンシ(最初のトークンまでの時間)、スループット(1 秒あたりの出力トークン数)、稼働率、そして量子化です。
平均値ではなく、p90 や p99 のレイテンシを確認してください。ユーザーが実際に体感するのは「遅い方」のケースであり、バッチ処理などでは p50 で評価しても構いません。
量子化は品質を左右する隠れた変数です。同じモデルでもプロバイダーによって精度が異なる場合があります。品質が重要な場合は、quantizations フィールドで指定した量子化レベルに固定してください。
リーダーボードで候補を絞り込んだら、自社のプロンプトで検証しましょう。ベンチマークは特定の時点の特定のエンドポイントを測るものであり、あなたのワークロードとは必ずしも一致しません。
評価結果をルーティングポリシーに反映させましょう。provider.sort やパーセンタイル閾値、量子化条件、フォールバック設定などを定義し、プロバイダー選択がハードコードされた名前に依存せず、実際の測定値に基づいて行われるようにします。
プロバイダーパフォーマンス評価のための 4 つの指標
チャット製品、ドキュメント生成パイプライン、背景での要約ジョブなど、ワークロードによって必要な性能プロファイルは異なります。最適なプロバイダーは、その用途に依存します。
| 指標 | 測定内容 | 重要なケース | 確認すべきポイント |
|---|---|---|---|
| レイテンシ(最初のトークンまでの時間) | リクエスト送信から最初の生成トークンを受信するまでの時間 | ユーザー向けチャット、エージェント、ストリーミングインターフェース、対話型ワークフロー | 平均値だけでなく、p90 や p99 のレイテンシを確認 |
スループット(出力速度)
生成開始後の1 秒間に生成されるトークンの数
長い回答、バッチ処理による生成、ドキュメント作成、コード生成、要約など
生成全体を通じて維持される 1 秒あたりのトークン数
稼働率と可用性
プロバイダーの健全性、エラー発生率、障害時の挙動(時間経過に伴う変化)
安定した完了動作が求められる本番環境アプリケーション
フェイルオーバーの仕組み、直近のプロバイダーのエラー事例、復旧経路
量子化(Quantization)
モデル重みを読み込む際に使用される精度レベル
品質に敏感なプロンプト、推論処理、コーディング、長いコンテキストを扱うタスクなど
精度を下げることでコストやメモリ使用量を削減できますが、難しいプロンプトの性能低下を招くリスクもあります。
あるプロバイダーは回答開始時は高速に見えても、回答全体が終わる頃には遅く感じられることがあります。TTFT(Time to First Token:最初のトークン到達までの時間)はこの体験の前半部分を捉える指標です。一方、スループットは後半部分を測るもので、生成開始後にプロバイダーが 1 秒間に何個のトークンを出力できるかを計測します。
TTFT が強いプロバイダーでも、持続的なトークン生成速度が低下すれば、長文回答の体験は弱くなります。逆にスループットに優れていても、最初のトークンが遅れるとチャットインターフェースでは使いにくいと感じられる可能性があります。
稼働率は、スピード指標だけではカバーできない本番環境の課題を補います。ベンチマーク条件では良好なパフォーマンスを示すプロバイダーでも、ピーク時の使用時に障害が発生したり、予期せぬレート制限がかかったり、エラーが急増してリトライを余儀なくされたりすれば、アプリケーションに悪影響を与えます。
これらの計測値を分離したら、次は適切な信頼レベルで読み解く必要があります。中央値(メディアン) latency は典型的なリクエストの傾向を示しますが、生産環境では「典型的な時間よりも大幅に遅れるリクエストがどれくらいあるか」を知ることも不可欠です。そこで、平均値よりも有用なのが p50、p75、p90、p99 といったパーセンタイル指標です。
パーセンタイル latency とスループットの見方
平均値は、最悪のユーザー体験を引き起こすリクエストを隠してしまいます。プロバイダーがほとんどのリクエストを高速に処理していても、たまに深刻な遅延が発生すれば、平均値は許容範囲に見えても、ユーザーはその遅延したリクエストを強く記憶に残します。
各モデルとプロバイダーについては、5 分間のローリングウィンドウにおけるパーセンタイル統計を用いて latency とスループット指標 を追跡しています。利用可能なパーセンタイルは p50、p75、p90、p99 です。
| パーセンタイル | 読み方 | 示す意味 |
|---|---|---|
| p50 | リクエストの 50% がこの値より速く完了する | 典型的なパフォーマンス |
| p75 | リクエストの 75% がこの値より速く完了する | 上位中位のユーザー体験 |
| p90 | リクエストの 90% がこの値より速く完了する | リクエストの末尾部分における一貫性 |
| p99 | リクエストの 99% がこの値より速く完了する | 最悪の場合の末尾挙動 |
p50 レイテンシ値はリクエストの中央値を示しますが、分布の遠くにある極端な遅延を隠してしまう可能性があります。あるプロバイダーが p50 は優秀でも p99 が劣っている場合、通常のユーザー体験には問題なくても、わずかな割合のリクエストで目に見える遅延が発生していることになります。
どのパーセンタイルを重視すべきかは、遅延がワークフローに実際にダメージを与えるポイントによります。チャットインターフェースでは最初のトークンが届くまでの待ち時間が重要となるため、p90 や p99 のレイテンシを確認すれば、典型的なリクエストを超えても体験が一貫しているかがわかります。一方、バッチ処理のようにユーザーが各レスポンスの開始を待っていない場合、持続的な出力速度こそが、システムが時間経過とともにどれだけの作業を完了できるかを把握する上でより適切な指標となります。
具体的な例として、2026 年 6 月 24 日 UTC に、anthropic/claude-sonnet-4.5 を提供する 2 つのプロバイダーの 1 日間のレイテンシ曲線を比較したところ、両者とも p50 の値が示唆するよりもはるかに長い p99 のテール(遅延の裾野)を示しました。
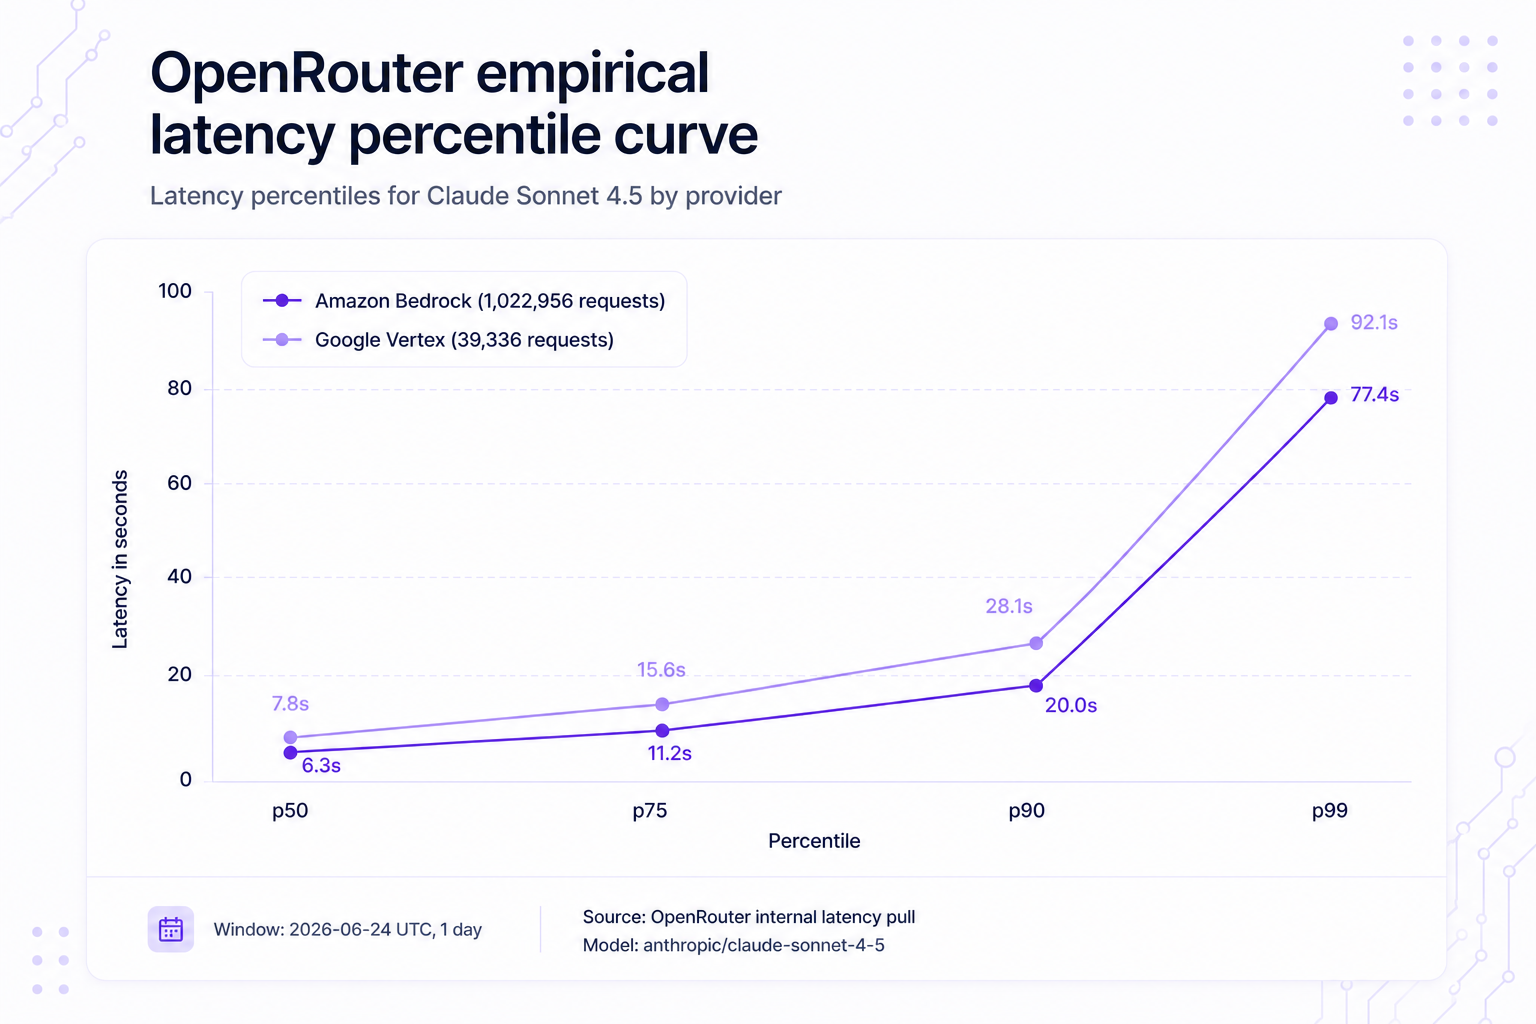
パーセンタイルはプロバイダーの応答の一貫性を示しますが、同じモデルを提供する 2 つのプロバイダー間のすべての違いを説明できるわけではありません。レイテンシとスループットが明確になった後、次に問われるべきは、両者が同じ形式でモデルを提供しているかどうかです。
なぜ量子化(Quantization)がプロバイダーの結果を変えるのか
モデル名だけでは、プロバイダー間の重要な違いである量子化(Quantization)を見逃しやすいものです。同じモデルスラッグを公開していても、実際の推論精度はプロバイダーによって異なる場合があります。ある経路ではモデルの重み精度を原形に近づけて維持する一方、別の経路ではメモリ使用量の削減や推論効率の向上、エンドポイント運用コストの低減を目的に精度を落としている可能性があります。
精度を下げることは、モデルがさまざまなプロンプトに対してどのように振る舞うかを変化させます。精度を下げれば処理速度が上がりコストも抑えられますが、慎重な推論やコードの正しさ、長いコンテキストの扱い、厳格な指示遵守が必要なケースでは、モデルの挙動に悪影響が出るリスクがあります。
私たちは量子化をルーティング判断の要素として提示しています。同じモデル名を持つエンドポイントだからといって、すべて同等とみなして選定すべきではないからです。quantizations フィールドを使えば、アプリケーションが利用可能な精度レベルを選択できます。これにより、品質リスクをプロバイダーの隠れた仕様として扱うのではなく、ルーティングポリシーの一部として明示的に管理できるようになります。
量子化値と実用的な解釈、そして品質リスクの関係は以下の通りです。
- fp32: 最高精度。ただし、ほとんどのホスト型推論では非現実的。リスク:最低
- fp16: 高品質な推論で広く使われる標準的な精度。リスク:低
- bf16: 現代のアクセラレーターでよく使われる高品質推論用精度。リスク:低
- fp8: 浮動小数点による低精度サービス。リスク:低〜中
- int8: 整数による低精度サービス。リスク:中
fp6:低精度浮動小数点サービング
Medium(中程度)
fp4:超低精度浮動小数点サービング
Higher(高)
int4:超低精度整数サービング
Higher(高)
unknown:プロバイダーの精度が不明
Unknown(不明)
この表は、コスト削減や速度向上のために、ワークロードがどの程度の精度を犠牲にできるかを判断するための指針として活用してください。要約パイプラインであれば、テストセット上で出力が安定していれば、低精度のエンドポイントでも許容できる場合があります。一方、コード編集のワークフロー、ツール呼び出しを行うエージェント、あるいは推論を重視するタスクでは、品質の微妙な低下が致命的になり得るため、許容範囲は狭くなります。わずかなズレが回答の誤りや呼び出しの失敗、一見正しそうだが実際には動作しないコードの生成につながるからです。
評価の結果、ワークロードに高い精度が必要であると判明した場合は、quantizations フィールドを使用して、アプリケーションが利用可能なプロバイダーのエンドポイントを制限してください:
{
  "provider": {
    "quantizations": ["fp16", "bf16"]
  }
}
また、評価によって特定のプロバイダーのエンドポイントがプロンプトに対して性能が悪いことが判明した場合は、そのプロバイダーを除外することも可能です:
{
  "provider": {
    "ignore": ["provider-slug"]
  }
}
モデル名は評価の起点となりますが、実際の性能はプロバイダーのエンドポイントによって決定されます。量子化(Quantization)こそが、パブリックベンチマークと本番環境での挙動に乖離が生じる主な理由の一つです。
プロバイダーベンチマークを騙されないで読む方法
公開リーダーボードは候補を絞り込むのに役立ちますが、実際の運用環境でのパフォーマンスを保証するものではありません。ベンチマークは特定の時点において、独自のプロンプトやパラメータ、リージョン、評価手法を用いて選択されたエンドポイントのみを測定します。そのため、ベンチマークで測定されたパスとは異なるエンドポイントやプロンプト形状、ルーティング経路を使用しているアプリケーションの場合、その結果がそのまま当てはまるとは限りません。
ベンチマークの結果を実際の運用環境での根拠として扱う前に、必ず公開されている評価方法論を確認する必要があります。具体的には以下の点をチェックしましょう。
- 初回トークンまでの時間と出力速度を区別しているか?
異なるワークロードでは、重視すべき速度のタイプが異なります。
- 平均値だけでなく、尾部(テール)のパフォーマンスも報告されているか?
平均値だけでは見逃してしまう信頼性の問題が、テール指標によって浮き彫りになります。
- プロバイダーのエンドポイントとサービング環境を特定しているか?
同じモデルでも、プロバイダーによって挙動が異なる場合があります。
- 量子化の影響を考慮しているか?
高速なエンドポイントでは、精度を犠牲にして処理効率を高めている可能性があります。
- 現在の性能を反映したデータか?
プロバイダーの速度や稼働率は、トラフィックの変化、ルーティングの見直し、インフラの更新などによって変動します。
- 自社のプロンプトと一致しているか?
一般的なベンチマークでは、自社製品の実際のワークロードを正確に予測できない場合があります。
ベンチマーク結果が真に有用になるのは、自社のワークロードで再度テストを行うきっかけとなったときです。リーダーボードで高速なプロバイダーを指し示しても、「そのエンドポイントが、あなたのプロンプト長やルーティング経路、品質要件の下でも安定して速いか」という次の問いが重要です。もしそうであれば、その結果をルーティングルールとして活用しましょう。
静的なランキングから単一のプロバイダーをハードコーディングするのは、脆い構成になりがちです。プロバイダーの挙動は、トラフィックや障害、ルーティング経路、サービング設定によって変化します。まさにそれが、私たちが設計したルーティング層が解決すべき課題なのです。
なぜマルチプロバイダー型ルーティングが評価を変えるのか
単一のプロバイダーを孤立して評価しても、測定条件におけるそのプロバイダーの振る舞いしか分かりません。レート制限に達したときや負荷で遅延が生じたとき、あるいは一時的に利用できなくなったときにどうなるかは分かりません。もしアプリケーションが単一のプロバイダーエンドポイントに依存しているなら、プロバイダー側のあらゆる障害がそのままアプリの挙動として現れてしまいます。
ルーティング層を導入することで、評価は「一度きりのプロバイダー選定」から「継続的な選択の問題」へと変わります。各プロバイダーの障害やレート制限、遅延をすべてアプリケーションの失敗とみなすのではなく、これらの状況に応じて自動的に迂回経路へ切り替えることが可能になります。
各プロバイダーの応答時間、エラー率、稼働状況をリアルタイムで監視しています。デフォルトのルーティングでは、直近 30 秒間に大きな障害が発生したプロバイダーを優先順位から外し、安定しているプロバイダー間で負荷分散を行います。この際、低価格帯のプロバイダーに重みを寄せて設定し、それ以外のプロバイダーはフェールオーバー(予備)として確保しておきます。
複数プロバイダーによるルーティングを導入しても、100% の稼働率を保証するものではありません。しかし、特定の提供者が障害を起こしたり利用できなくなったりした場合の代替経路を提供することで、単一エンドポイントへの依存度を下げることができます。
モデルレベルのフェールオーバーも同様の原則に基づいています。プロバイダーレベルでのルーティングでは対応しきれない場合に機能します。例えば、主要なモデルを扱うプロバイダーがダウンしている、レート制限に引っかかった、あるいは回答不能な状態にある場合、OpenRouter はフェールオーバーリスト内の次のモデルを試すことができます。
効果的なルーティング戦略を立てるには、以下の 3 つの問いに答える必要があります。
| 質問 | ルーティングへの影響 |
|---|---|
| 同じモデルでも、異なるプロバイダーを利用できるか? | プロバイダーによるルーティングを採用し、フェールオーバーを許可する |
| 最初のモデルが失敗した場合、別のモデルに切り替えられるか? | モデルのフェールオーバーを活用する |
| コンプライアンスや契約上の理由で、特定の提供者を厳格に制御する必要があるか? | プロバイダー順序指定、プロバイダー限定モードを採用するか、フェールオーバーを無効化する |
評価結果をルーティングポリシーへ反映させる
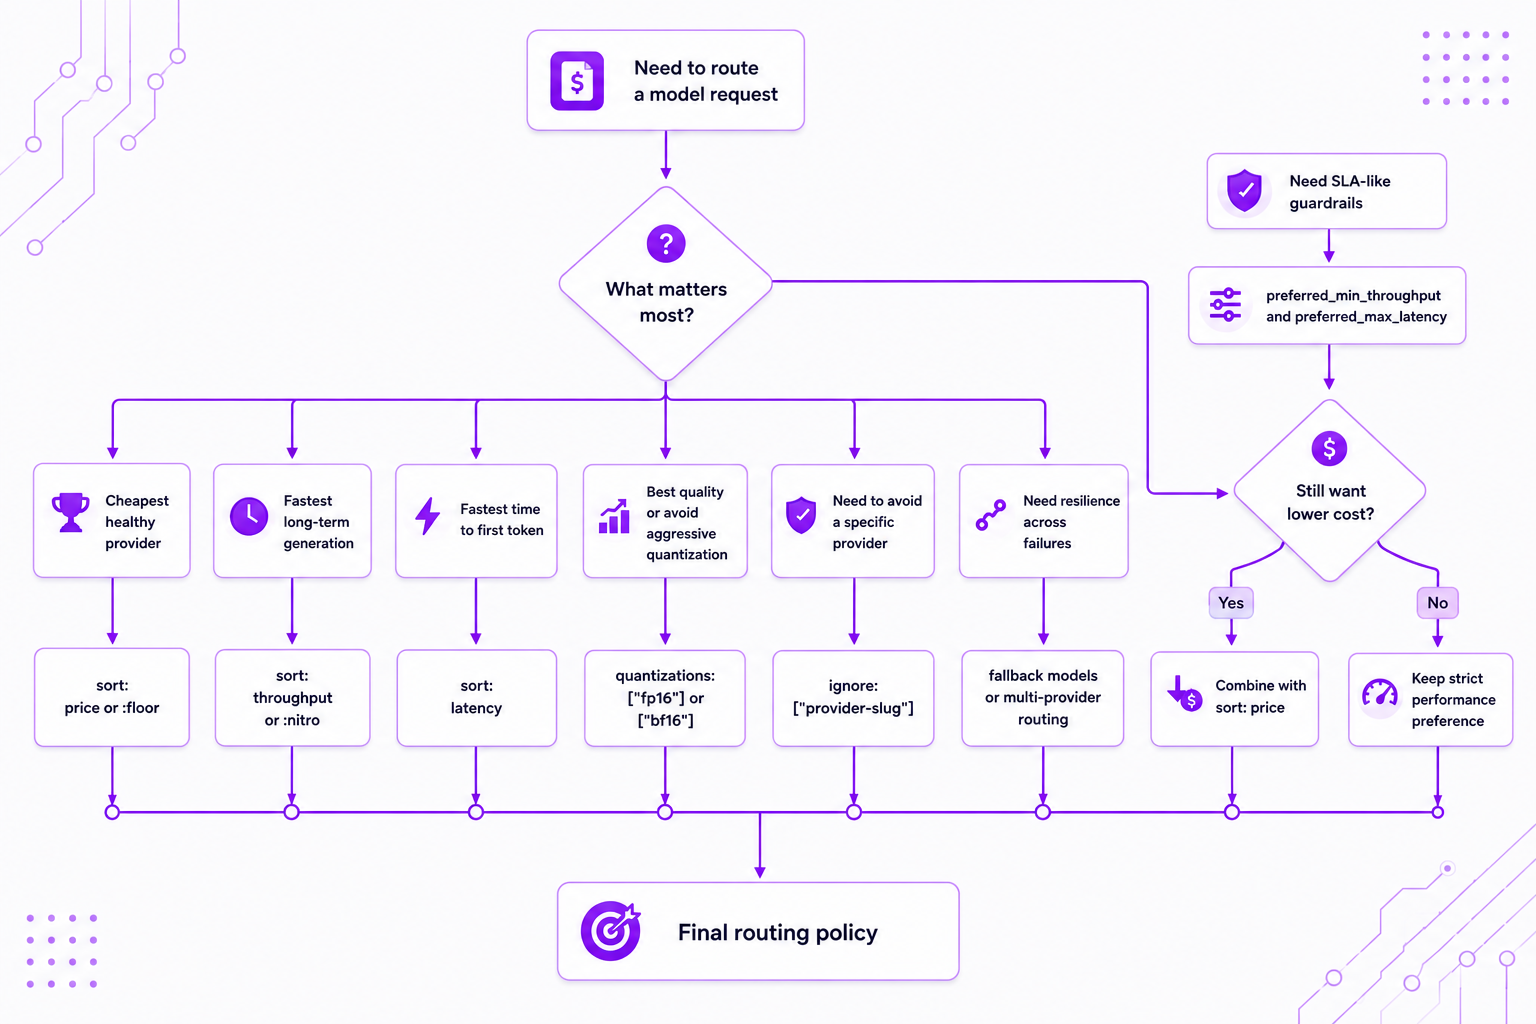
主要なルーティング制御は、プロバイダーオブジェクト内に配置されます。これにより、プロバイダーのソートやパフォーマンス閾値の優先設定、エンドポイントの選択・除外、量子化によるフィルタリング、フォールバックの実行可否などを柔軟に決定できます。モデルのフォールバックには models 配列を使用します。
評価結果に基づき、ルーティング設定を以下のように適用できます。
- リクエストは最安値のプロバイダーから利用する:
provider.sort: "price"または:floorモデルサフィックス - リクエストは出力速度の速い方を優先する:
provider.sort: "throughput"または:nitroモデルサフィックス - リクエストは最初のトークン到達時間を最小化する:
provider.sort: "latency" - スループット閾値を満たしつつ最安のエンドポイントを探す:
preferred_min_throughputを指定した{ by: "price", partition: "none" } - レイテンシ閾値を超えない範囲で最安のエンドポイントを探す:
preferred_max_latencyを指定した{ by: "price", partition: "none" } - 特定の推論精度を必要とするワークロード:
provider.quantizations - 評価に失敗したプロバイダーを除外する:
provider.ignore - 特定のプロバイダーパスを優先的に使用する:
provider.order - 他のプロバイダーへのフォールバックを禁止する:
allow_fallbacks: false
最初のモデルが失敗した場合、別のモデルを使用可能にするには models フォールバック配列を設定します。
最もシンプルな制御方法は、モデルのサフィックスを利用することです。model suffixes を参照してください。
リクエストでスループットの高いプロバイダーを優先したい場合は、:nitro を追加します。
curl https://openrouter.ai/api/v1/chat/completions \
  -H "Authorization: Bearer $OPENROUTER_API_KEY" \
  -H "Content-Type: application/json" \
  -d '{
    "model": "meta-llama/llama-3.3-70b-instruct:nitro",
    "messages": [
      { "role": "user", "content": "Write a concise product summary." }
    ]
  }'
リクエストで低価格を優先したい場合は、:floor を追加します。
curl https://openrouter.ai/api/v1/chat/completions \
  -H "Authorization: Bearer $OPENROUTER_API_KEY" \
  -H "Content-Type: application/json" \
  -d '{
    "model": "meta-llama/llama-3.3-70b-instruct:floor",
    "messages": [
      { "role": "user", "content": "Write a concise product summary." }
    ]
  }'
これらのショートカットは、一つの優先事項がリクエスト全体を支配する場合に有効です。しかし、本番環境でのルーティングでは、より細かなルールが必要になることがよくあります。例えば、サポートワークフローでは、長い要約でも十分なスループットを維持できる範囲で最も安価なエンドポイントを利用したい場合があります。その場合は、価格ソートとスループットの優先順位を組み合わせて設定します。
import { OpenRouter } from '@openrouter/sdk';

const openRouter = new OpenRouter({
  apiKey: process.env.OPENROUTER_API_KEY,
});

const completion = await openRouter.chat.send({
  models: [
    'anthropic/claude-sonnet-4.5',
    'openai/gpt-5-mini',
    'google/gemini-3-flash-preview',
  ],
  messages: [
    {
      role: 'user',
      content: 'Summarize this customer support thread and identify the next action.',
    },
  ],
  provider: {
    sort: {
      by: 'price',
      partition: 'none',
    },
    preferredMinThroughput: {
      p90: 50,
    },
  },
  stream: false,
});
このリクエストは、OpenRouter に指定されたモデル一覧から検索させ、p90 で秒間 50 トークンのスループットを達成できる最も安価なモデルとプロバイダーエンドポイントを選定させるものです。この閾値に満たないエンドポイントは除外されるわけではなく、優先度の高いオプションの後ろに回されます。これにより、すべての優先エンドポイントが失敗した場合でも、バックアップとして利用可能になります。
チャットワークフローにおいても、同様のパターンをレイテンシ(応答遅延)の制御に応用できます。最初のトークン生成までの遅延がユーザー体験上のボトルネックとなる場合、価格順ソートとレイテンシ優先条件を組み合わせて設定します。
このリクエストでは価格を判断基準に含めつつ、p90 レイテンシが 3 秒未満のエンドポイントを優先します。この優先順位は特定のプロバイダを固定するのではなく、プロバイダ評価に基づいています。
同様のパターンは、品質や信頼性の判断にも適用できます。高精度なエンドポイントでワークロードのパフォーマンスが向上する場合、量子化フィルタを追加しましょう。
const completion = await openRouter.chat.send({
model: 'deepseek/deepseek-v3.2',
messages: [{ role: 'user', content: 'Review this code change for logic errors.' }],
provider: {
quantizations: ['fp16', 'bf16'],
},
stream: false,
});
テストセットで失敗した、あるいは運用要件を満たしていないプロバイダがある場合は、ルーティングから除外してください。
const completion = await openRouter.chat.send({
model: 'meta-llama/llama-3.3-70b-instruct',
messages: [{ role: 'user', content: 'Draft a release note from these changes.' }],
provider: {
ignore: ['provider-slug'],
},
stream: false,
});
単一のモデルに固執するよりも、完了の信頼性が重要である場合は、フォールバックリスト を使用します。
const completion = await openRouter.chat.send({
models: [
'anthropic/claude-sonnet-4.5',
'openai/gpt-5-mini',
'google/gemini-3-flash-preview',
],
messages: [
{
role: 'user',
content: 'Summarize this incident report and list the next actions.',
},
],
stream: false,
});
評価基準を決める前に、まず測定を行うべきです。閾値を設定する前に、どの指標が重要かを判断できるシンプルな評価プロセスが必要です。
プロバイダー評価のための5 つのステップチェックリスト
- まずワークロードを定義しましょう。プロバイダー選びから始めるのではなく、製品に必要な振る舞いから考えます。ストリーミング型のチャットアプリなら「初回トークンまでの時間」や p90 レイテンシを測定します。バッチ処理の生成ワークフローではスループットと完了までの総時間を計測します。推論に重きを置くワークフローなら、品質チェックや量子化の見直しも加えてください。
- 外部ベンチマークとプロバイダーの実データで候補を絞り込みます。公開リーダーボードで候補を選んだら、カタログ内の各モデルページにある最新の提供元データを必ず確認してください。
- 自社のプロンプトでテストを実行します。実際の製品ワークロードを反映したプロンプトを使いましょう。短いもの、長いもの、簡単なもの、そして弱いプロバイダーで失敗しやすいケースを含めます。速度、信頼性、出力の品質を同時に測定することが重要です。
モデルの量子化状態とプロバイダーの挙動を確認しましょう。同じモデルを提供していても、難易度の高いプロンプトに対して回答品質に差がある場合は、モデルそのものを責める前に、提供経路(サービングパス)を精査する必要があります。評価結果に基づき、より高精度な設定を選択するか、性能が劣るエンドポイントを除外する判断を下してください。
これらの評価結果はルーティング機能を通じて実装に反映させましょう。評価項目をリクエスト設定として適用し、sort、:nitro、:floor、preferred_min_throughput、preferred_max_latency、quantizations、ignore、fallbacks などのパラメータを活用して、アプリケーションが測定値と整合するよう制御します。これにより、プロバイダーの選択は汎用的な市場ランキングではなく、自社のアプリケーション要件に紐づけられます。また、プロバイダーの挙動が時間とともに変化しても、パフォーマンスレビューを再現可能に保つことができます。
FAQ
LLM プロバイダーにおける「レイテンシ」と「スループット」の違いは何ですか?
レイテンシは、ユーザーが最初のトークンを受け取るまでにかかる待ち時間を計測します。一方、スループットは、生成処理が始まった後にプロバイダーが 1 秒間に生成する出力トークンの数を表します。チャット UI では通常、レスポンスの速さ(レイテンシ)を優先しますが、大量の出力を必要とするワークフローでは、スループットの方が重要視されます。
LLM のレイテンシにおける p50、p90、p99 は何を意味しますか?
p50 は中央値であり、リクエスト体験の中間点を示します。p90 は、リクエストの 90% がその値以下のレイテンシで完了することを意味します。p99 は分布の極端な尾部(ファットテール)を示し、ほぼすべてのユーザーに対して予測可能な応答が求められる場合に必要となる指標です。
同じモデルでもプロバイダーによって性能が異なるのはなぜですか?
プロバイダーのエンドポイントによって、提供環境が切り替わることがあります。量子化(quantization)やインフラストラクチャ、コンテキストのサポート状況、負荷、そしてプロバイダーごとのデフォルト設定など、さまざまな要素が出力の挙動に影響を及ぼします。
モデルのスラッグ(slug)はモデルファミリーを特定するものですが、実際の運用結果にはプロバイダーのパスが大きく関わってきます。
性能の低いプロバイダーを避けるには?
問題がプロバイダーごとに異なることを確認したら、まずは自分自身のプロンプトでテストを行ってください。もしその問題が再現性を持つ場合は、「provider.ignore」を使用して該当するプロバイダーを除外してください。また、精度の低下に起因する問題であることが判明した場合は、「provider.quantizations」を設定して、高精度なエンドポイントを優先するようにしましょう。
複数プロバイダーによるルーティングは稼働率向上に寄与しますか?
複数のプロバイダーを経由させることで、特定のプロバイダーが停止したりレート制限にかかったりした場合のフォールバック経路を確保でき、信頼性を高めることが可能です。これにより単一プロバイダーへの依存を減らせますが、その効果はルーティングポリシーの質や利用可能なプロバイダーの数に左右されます。
いいえ。リクエスト料金は、最終的に完了を処理したモデルとプロバイダーのエンドポイントに基づいて計算されます。OpenRouter はプロバイダーの価格に上乗せを行っていませんし、ルーティング先が 1 つであっても 10 個であっても、失敗したリクエストに対しては課金されません。
最速のプロバイダーへどのようにルーティングすべきですか?
最初のトークンまでの時間を重視する場合は「provider.sort: "latency"」を指定してください。一方、長文生成の速度を重視する場合は、「provider.sort: "throughput"」または「:nitro」サフィックスを使用します。単純な速度優先ではなく、予測可能なパフォーマンスが必要な場合は、パーセンタイル閾値を追加設定しましょう。
原文を表示
Developers often start LLM selection by choosing a model such as Claude, Llama, Gemini, or DeepSeek, then treat the provider as a secondary decision. That’s understandable. But the model choice alone doesn’t tell you how the model performs through a specific provider endpoint.
The same model can run through multiple provider endpoints, and each endpoint can bring different infrastructure, routing behavior, quantization choices, and failure patterns. Your users and systems see those differences in practical ways. One provider may return the first token quickly, but slow down during the rest of the response. Another may serve a lower-precision variant that drifts on harder prompts. Another may perform well under normal traffic but fail under load.
Provider evaluation compares serving environments rather than treating the model as a standalone product. It asks how long users wait for the first token, how quickly the rest of the response arrives, how the provider behaves under load, and what precision level the model runs at.
This guide works through those questions in the order in which you can act on them: latency, throughput, uptime, and quantization. Once you can measure those trade-offs, the next step is to turn the results into routing logic so your application doesn’t hard-code whichever provider looked fastest in a single benchmark run.
Tl;dr
- The same model behaves differently across provider endpoints. Infrastructure, quantization, load handling, and routing defaults all change the result, even when the model slug is identical.
- 4 metrics decide provider performance: latency (time to first token), throughput (output tokens/sec), uptime, and quantization.
- Read latency at p90/p99, not the average. The tail is what user-facing apps actually feel; batch jobs can evaluate on p50.
- Quantization is the hidden quality variable. Two providers can serve the same model at different precision; pin it with the quantizations field when quality matters.
- Use leaderboards to shortlist, then verify on your own prompts. A benchmark measures one endpoint at one moment; your workload isn’t the benchmark’s workload.
- Turn the evaluation into a routing policy. Set provider.sort, percentile thresholds, quantizations, and fallbacks so provider choice stays tied to your measurements instead of a hard-coded name.
The 4 metrics for evaluating provider performance
A chat product, a document-generation pipeline, and a background summarization job don’t need the same performance profile. The right provider depends on the workload.
MetricWhat it measuresWhen it mattersWhat to watch
Latency (time to first token)The time between sending a request and receiving the first generated tokenUser-facing chat, agents, streaming interfaces, and interactive workflowsp90 and p99 latency, not only typical latency
Throughput (output speed)The number of output tokens generated per second after generation beginsLong answers, batch generation, document drafting, code generation, and summarizationSustained tokens per second across the generation
Uptime and availabilityProvider health, error rate, and outage behavior over timeProduction applications that need stable completion behaviorFailover behavior, recent provider errors, and recovery paths
QuantizationThe precision level used to serve model weightsQuality-sensitive prompts, reasoning, coding, and long-context tasksLower precision can reduce cost and memory use, but it can also hurt hard prompts
A provider can look fast at the start of a response and still feel slow by the time the full answer finishes. Time to first token (TTFT) captures the first part of that experience. Output speed captures the second part because it measures how many tokens the provider generates per second after generation begins. A provider with strong TTFT can still produce a weak long-form experience if its sustained token rate drops, while a provider with strong throughput can still feel poor in a chat interface if the first token arrives late.
Uptime adds the production layer that speed metrics can’t cover. A provider that performs well in benchmark conditions can still hurt the application if it fails during peak usage, rate-limits unexpectedly, or creates error spikes that force retries.
Once those measurements are separated, the next step is to read them at the appropriate confidence level. Median latency can describe the typical request, but production systems also need to know how many requests take much longer than the typical one. That’s where percentile metrics such as p50, p75, p90, and p99 become more useful than averages.
How to read percentile latency and throughput
Averages hide the requests that create the worst user experience. If a provider serves most requests quickly but occasionally stalls badly, the average may still look acceptable, but your users will remember the stalled request.
We track latency and throughput metrics for each model and provider using percentile statistics over a rolling 5-minute window. The available percentiles are p50, p75, p90, and p99.
PercentileHow to read itWhat it tells you
p5050% of requests complete faster than this valueTypical performance
p7575% of requests complete faster than this valueUpper-middle experience
p9090% of requests complete faster than this valueConsistency in the request tail
p9999% of requests complete faster than this valueWorst-case tail behavior
A p50 latency value describes the median request, but it can hide the requests that sit much farther out in the distribution. A provider can have a strong p50 and a weak p99, meaning the typical request feels fine while a small but meaningful share of requests take long enough to create visible delays.
The right percentile depends on where the delay actually damages the workflow. In a chat interface, delay appears before the first token arrives, so p90 and p99 latency indicate whether the experience remains consistent beyond the typical request. In a batch job, the user isn’t waiting for each response to start, so sustained output speed provides a better view of how much work the system can complete over time.
As a concrete example, on June 24, 2026 UTC, two providers serving anthropic/claude-sonnet-4.5 showed different latency curves over a 1-day window, and both had a much wider p99 tail than their p50 values suggest.
Percentiles show how consistently a provider responds, but they don’t explain every difference between two providers serving the same model. Once latency and throughput are clear, the next question is whether both providers are serving the model in the same form.
Why quantization changes provider results
Quantization is one of the easiest provider differences to miss because the model name doesn’t always reveal how the model is being served. Two providers can expose the same model slug while running it at different precision levels. One route may preserve more of the model’s original weight precision, while another may reduce precision to lower memory use, improve serving efficiency, or make the endpoint cheaper to operate.
Reducing precision changes how the model behaves under different types of prompts. Lower precision can make a model faster and cheaper to serve, but it can also change how the model handles prompts that require careful reasoning, code correctness, long context, or strict instruction-following.
We expose quantization as a routing decision because provider selection shouldn’t treat every endpoint with the same model name as equivalent. The quantizations field lets you choose which precision levels your application can use, so quality risk becomes part of the routing policy instead of a hidden provider detail.
Quantization valuePractical interpretationQuality risk
fp32Highest precision, usually impractical for most hosted inference economicsLowest
fp16Common high-quality inference precisionLow
bf16Common high-quality inference precision, often used on modern acceleratorsLow
fp8Lower precision floating-point servingLow to medium
int8Lower precision integer servingMedium
fp6Lower precision floating-point servingMedium
fp4Very low precision floating-point servingHigher
int4Very low precision integer servingHigher
unknownProvider precision is not knownUnknown
Read the table as a way to decide how much precision your workload can afford to trade for lower serving cost or higher speed. A summarization pipeline may tolerate a lower-precision endpoint if the outputs stay stable on your own test set. A code-editing workflow, tool-calling agent, or reasoning-heavy task gives you less room for silent quality loss because a small drift can change the answer, break a call, or produce code that looks plausible but fails.
When your evaluation shows that a workload needs higher precision, use the quantizations field to limit the provider endpoints your application can use:
{
"provider": {
"quantizations": ["fp16", "bf16"]
}
}You can also exclude a provider if your evaluation shows that its endpoint performs poorly for your prompts:
{
"provider": {
"ignore": ["provider-slug"]
}
}The model name starts the evaluation, but the provider endpoint completes it. Quantization is one reason public benchmarks and production behavior can diverge.
How to read provider benchmarks without getting fooled
A public leaderboard helps you narrow the candidate set, but it can’t describe your production path. Benchmarks measure selected endpoints at a point in time, using their own prompts, parameters, regions, and scoring methods. Your application may use a different endpoint, prompt shape, or routing path than the one the benchmark measured.
A useful provider benchmark review should check the benchmark’s published methodology before treating the result as production evidence:
QuestionWhy it matters
Does the benchmark separate the time to first token from the output speed?Different workloads care about different kinds of speed.
Does it report tail performance or only average performance?Tail metrics expose reliability problems that averages can hide.
Does it identify the provider endpoint and serving setup?The same model can behave differently across providers.
Does it account for quantization?A fast endpoint may trade precision for serving efficiency.
Does it reflect current performance?Provider speed and uptime drift as traffic, routing, and infrastructure change.
Does it match your prompts?General benchmarks may not predict your product’s workload.
A benchmark result becomes useful when it leads to a second round of testing under your own workload. If a leaderboard points to a fast provider, the next question is whether that endpoint stays fast with your prompt length, routing path, and quality requirements. If it does, convert that result into a routing rule.
Hard-coding a single provider from a static ranking creates a fragile setup. Provider behavior varies with traffic, outages, routing paths, and serving configurations. That’s what our routing layer is designed to handle.
Why multi-provider routing changes provider evaluation
Evaluating one provider in isolation only tells you how that provider behaved under the conditions you measured. It doesn’t tell you what happens when the provider hits a rate limit, slows down under load, or becomes temporarily unavailable. If your application depends on one provider endpoint, every provider-side failure becomes part of your application’s behavior.
A routing layer changes the evaluation from a one-time provider choice into an ongoing selection problem. Instead of treating every provider outage, rate limit, or slowdown as an application failure, you can automatically route around those conditions.
We monitor response times, error rates, and availability across providers in real time. Our default routing deprioritizes providers that saw significant outages in the last 30 seconds, load-balances across the stable ones weighted toward lower prices, and keeps the rest available as fallbacks.
Multi-provider routing doesn’t guarantee perfect uptime. It reduces dependence on a single endpoint by providing an alternative path when a provider fails or becomes unavailable.
Model fallbacks apply the same principle when provider-level routing is insufficient. If the primary model can’t complete the request because its providers are down, rate-limited, or unable to answer, OpenRouter can try the next model in the fallback list.
A practical routing strategy should answer three questions:
QuestionRouting implication
Can the app tolerate a different provider for the same model?Use provider routing and allow fallbacks.
Can the app tolerate a different model when the first model fails?Use model fallbacks.
Does the app require strict provider control for compliance or contractual purposes?Use provider order, provider only, or disable fallbacks.
Turn provider evaluation into a routing policy
The main routing controls sit inside the provider object. They let you sort providers, prefer performance thresholds, choose or avoid provider endpoints, filter by quantization, and decide whether fallbacks can run. Model fallbacks use the models array.
Evaluation resultRouting setting
The request should use the lowest-price provider firstprovider.sort: "price" or the :floor model suffix
The request should prioritize higher output speedprovider.sort: "throughput" or the :nitro model suffix
The request should prioritize lower time to first tokenprovider.sort: "latency"
The request should find the cheapest endpoint that still clears a throughput thresholdprovider.sort: { by: "price", partition: "none" } with preferred_min_throughput
The request should find the cheapest endpoint that stays below a latency thresholdprovider.sort: { by: "price", partition: "none" } with preferred_max_latency
The workload needs a specific serving precisionprovider.quantizations
One provider failed your evaluationprovider.ignore
The request must use one provider path firstprovider.order
The request must not fall back to other providersprovider.allow_fallbacks: false
The application can use another model if the first model failsmodels fallback array
The simplest controls are the model suffixes. Add :nitro when the request should prioritize providers with higher throughput:
curl https://openrouter.ai/api/v1/chat/completions \
-H "Authorization: Bearer $OPENROUTER_API_KEY" \
-H "Content-Type: application/json" \
-d '{
"model": "meta-llama/llama-3.3-70b-instruct:nitro",
"messages": [
{ "role": "user", "content": "Write a concise product summary." }
]
}'Add :floor when the request should prioritize lower price:
curl https://openrouter.ai/api/v1/chat/completions \
-H "Authorization: Bearer $OPENROUTER_API_KEY" \
-H "Content-Type: application/json" \
-d '{
"model": "meta-llama/llama-3.3-70b-instruct:floor",
"messages": [
{ "role": "user", "content": "Write a concise product summary." }
]
}'Those shortcuts work when one preference should dominate the request. Production routing often needs a narrower rule. For example, a support workflow may need the cheapest endpoint that still sustains enough throughput for longer summaries. In that case, combine price sorting with a throughput preference:
import { OpenRouter } from '@openrouter/sdk';
const openRouter = new OpenRouter({
apiKey: process.env.OPENROUTER_API_KEY,
});
const completion = await openRouter.chat.send({
models: [
'anthropic/claude-sonnet-4.5',
'openai/gpt-5-mini',
'google/gemini-3-flash-preview',
],
messages: [
{
role: 'user',
content: 'Summarize this customer support thread and identify the next action.',
},
],
provider: {
sort: {
by: 'price',
partition: 'none',
},
preferredMinThroughput: {
p90: 50,
},
},
stream: false,
});This request asks OpenRouter to look across the listed models and prefer the cheapest model and provider endpoint that reaches 50 tokens per second at p90. Endpoints below that threshold don’t disappear from the route. They move behind preferred options, which keep them available if all preferred endpoints fail.
A chat workflow can use the same pattern with latency. If the first-token delay creates the user-visible bottleneck, combine price sorting with a latency preference:
const completion = await openRouter.chat.send({
  models: ['anthropic/claude-sonnet-4.5', 'openai/gpt-5-mini'],
  messages: [
    {
      role: 'user',
      content: 'Answer this user message in a support chat.',
    },
  ],
  provider: {
    sort: {
      by: 'price',
      partition: 'none',
    },
    preferredMaxLatency: {
      p90: 3,
    },
  },
  stream: false,
});
This request keeps price in the decision, but it prefers endpoints that keep p90 latency under 3 seconds. The preference comes from the provider evaluation rather than from a fixed provider choice.
The same pattern works for quality and reliability decisions. If a workload performs better on higher-precision endpoints, add a quantization filter:
const completion = await openRouter.chat.send({
  model: 'deepseek/deepseek-v3.2',
  messages: [{ role: 'user', content: 'Review this code change for logic errors.' }],
  provider: {
    quantizations: ['fp16', 'bf16'],
  },
  stream: false,
});
If a provider failed your test set or doesn’t meet your operational requirements, exclude it from the route:
const completion = await openRouter.chat.send({
  model: 'meta-llama/llama-3.3-70b-instruct',
  messages: [{ role: 'user', content: 'Draft a release note from these changes.' }],
  provider: {
    ignore: ['provider-slug'],
  },
  stream: false,
});
If completion reliability matters more than staying with a single model, use a fallback list:
const completion = await openRouter.chat.send({
  models: [
    'anthropic/claude-sonnet-4.5',
    'openai/gpt-5-mini',
    'google/gemini-3-flash-preview',
  ],
  messages: [
    {
      role: 'user',
      content: 'Summarize this incident report and list the next actions.',
    },
  ],
  stream: false,
});
The routing policy should come after measurement, not before it. Before you set thresholds, you need a simple evaluation process that tells you which thresholds matter.
A 5-step provider evaluation checklist
- Define the workload first. Don’t start with the provider. Start with the product behavior you need. A streaming chat app should measure time to first token and p90 latency. A batch-generation workflow should measure throughput and total completion time. A reasoning-heavy workflow should add quality checks and quantization review.
- Shortlist with external benchmarks and live provider data. Use public leaderboards to identify candidates, then check current provider data on the model’s page in our catalog.
- Test with your own prompts. Run prompts that represent your product’s real workload. Include short prompts, long prompts, easy prompts, and the prompts that usually break weak providers. Measure speed, reliability, and output quality together.
- Check quantization and provider behavior. If two providers serve the same model but one gives worse answers on hard prompts, check the serving path before blaming the model. Pin higher precision or exclude the weaker endpoint when your evaluation supports that decision.
- Enforce the result through routing. Turn the evaluation into request settings. Use sort, :nitro, :floor, preferred_min_throughput, preferred_max_latency, quantizations, ignore, and fallbacks to keep the application aligned with the measurements. That keeps provider choice tied to your application rather than to a generic market ranking, and it makes performance review repeatable as provider behavior changes over time.
FAQ
What is the difference between latency and throughput for LLM providers?
Latency measures how long the user waits before the first token arrives. Throughput measures the number of output tokens the provider generates per second after generation starts. A chat UI usually prioritizes latency, while a long-output workflow prioritizes throughput.
What do p50, p90, and p99 mean for LLM latency?
p50 is the median request experience. p90 means 90% of requests complete at or below that latency value. p99 shows the far tail of the distribution, which you need when your application must respond predictably for nearly all users.
Why does the same model vary by provider?
The provider endpoint can change the serving environment. Quantization, infrastructure, context support, load, and provider defaults can all affect output behavior. The model slug identifies the model family, but the provider path affects the production result.
How do I avoid a poorly performing provider?
After you confirm the problem varies by provider, test it against your own prompts first. If the problem is repeatable, use provider.ignore to exclude that provider. If the issue appears tied to lower precision, use provider.quantizations to prefer higher-precision endpoints.
Does multi-provider routing improve uptime?
Multi-provider routing can improve reliability by adding fallback paths when a provider fails, rate-limits, or goes down. It reduces single-provider dependency, but it still depends on the quality of the routing policy and the available providers.
No. The request is priced using the model and provider endpoint that ultimately serve the completion. OpenRouter doesn’t mark up provider pricing, and failed requests aren’t billed, whether you route to one provider or ten.
How should I route to the fastest provider?
Use provider.sort: "latency" when you care about time to first token. Use provider.sort: "throughput" or the :nitro suffix when you care about long-form generation speed. Add percentile thresholds when you need predictable performance rather than a simple speed preference.
AI算出
技術分析ainew評価高い
記事は LLM の選定においてプロバイダーごとのインフラ差や量子化の影響を分析し、レイテンシ・スループット・稼働率の測定方法を体系的に解説しており、開発者が実装に活用できる独自の実践知見を含んでいる。
6つの評価軸を見る
- AI関連度
- 100
- 情報源の信頼性
- 25
- 新規性
- 75
- 調べる価値
- 75
- 重複の少なさ
- 100
- 日本での有用性
- 50
関連記事
今日のまとめ
AIデイリーブリーフで今日の重要ニュースをまとめ読み