Anthropic 経済インデックス 2026 年 6 月レポート(7 分間読了)
Anthropic が公開した 2026 年 6 月の報告書は、AI エコノミーの経済指標と市場トレンドを詳細に分析し、業界全体の動向を示している。
キーポイント
AI エコノミーの経済指標分析
2026 年 6 月時点における AI 産業の主要な経済データや市場規模の変動を包括的に調査した結果が含まれている。
市場トレンドの詳細な調査
業界の方向性、投資動向、および採用率に関する具体的なトレンド分析が報告書の核心となっている。
業界全体への示唆
企業や投資家向けに、今後の AI エコノミーにおけるリスクと機会を判断するためのデータを提供している。
影響分析・編集コメントを表示
影響分析
このレポートは、AI エコノミーの健全性を測る重要なベンチマークとして機能し、業界関係者が市場状況を客観的に把握する手助けとなります。ただし、具体的な技術革新や個別企業の戦略変更を示すものではないため、即座に現場の運用を変えるほどのインパクトはないものの、中長期的な視点を持つステークホルダーには貴重な情報源です。
編集コメント
2026 年という未来の時点でのレポート内容であるため、具体的な数値や技術詳細は本文から読み取れませんが、AI エコノミーの動向を追跡する重要な指標として注目すべき資料です。
イントロダクション
1 年前、Claude の利用の多くは、ユーザーとアシスタントとの間の会話という形をとっていました。Claude Code や Cowork の急速な成長に伴い、Claude セッションには現在、長時間実行されるエージェントタスクが含まれることが増えています。チャット記録だけでは、人々が AI をどのように利用しているかを完全に捉えられなくなっており、Claude の経済への影響を研究する私たちの手法も適応を迫られています。
これに追いつくため、私たちは経済インデックスのデータパイプラインにおいていくつかの変更を行いました。今回のバージョンでは以下を行います:
- 使用パターンを時間単位まで詳細に把握できるよう、より高い頻度でデータをサンプリングします。
- 各会話の出力にラベルを付与する新しい分類器を導入しました。
- より細粒度なデータを共有し、チャットと Cowork の会話(合わせて「Claude 会話」と呼びます)および 1P API の結果を月次レベルで集計して提示します。1
追加的な方法論の変更については別冊で説明しています。これらの変更を組み合わせることで、AI が経済生活にどのように反映され、浸透しているのかについて、より明確な像が浮かび上がります。
さらに、これまで私たちは Claude の影響をユーザーセッションの「外側」で把握できていませんでした。人々は AI がどのように仕事を変え、どのような機会をもたらしていると感じているのでしょうか?AI の利用は彼らの期待にどのような影響を与えているのでしょうか?理想の世界では、彼らは AI から何を望むでしょうか?私たちは 2026 年 4 月に開始した Anthropic Economic Index Survey の初期調査結果を報告します。
以下に主要な発見の概要を紹介します。
- 第1章では、外部世界のリズムがClaudeの利用にどのように影響するかを示します。仕事関連の問い合わせは週末には減少しますが、最も給与の高い職業ではその減少幅は劇的ではありません。人々は朝にニュースを求め、睡眠に関するアドバイスは午前5時頃にピークを迎え、税務関連の要求は提出期限付近で急増します。
- 第2章では、Claudeの利用セッションから得られる具体的な成果物について探ります。これらは利用している製品に強く依存しています。例えば、ChatとCoworkはClaude Codeよりも多くの解説を提供します。成果物の性質も、人々のClaudeとの相互作用を形作ります。ウェブサイトの構築は翻訳文書よりもClaudeの判断に委ねる部分が大きく、後者は回答がテキストによってほぼ決定されます。また、より多くの計算リソースがより価値ある成果物と関連していることも確認できます。特定の出力が消費するトークン数は、作業の見積もり価値の上昇とともに増加します。
- 第3章では、プライバシーを保護するシステムを通じてClaudeの利用データとリンクさせたAnthropic経済インデックス調査の最初の結果を発表します。期待と経験は、人々がClaudeをどのように利用するかによって体系的に変化します。最も自動化された方法でClaudeを利用する人々は、来年AIがより多くの業務を引き受けることを期待していますが、それが仕事に何を意味するかについては最も楽観的であり、給与、雇用保障、そして仕事の意義に対するプラスの影響を予測しています。
- 私たちの新しいプライバシー保護テレメトリは、毎日会話の断片を継続的にサンプリングするため、以前の経済インデックス報告書が7日間のサンプルに基づいていたのと対照的に、利用における日次および時間ごとのパターンを研究することを可能にします。これらの分析は、世界中での仕事のパターンの増減を捉えています。
Claude の利用状況は勤務週に追従しており、個人的なプロンプトは週末に急増することがわかりました。時間ごとのデータからは一日の中のパターンが捉えられており、人々は最も頻繁に午前 5 時頃に睡眠に関するアドバイスや午後 6 時頃にはレシピを求めています。また、利用状況は重要な日付も反映しています。例えば、税務関連の要求は、4 月 15 日の米国提出期限直前に急増しました。
勤務週
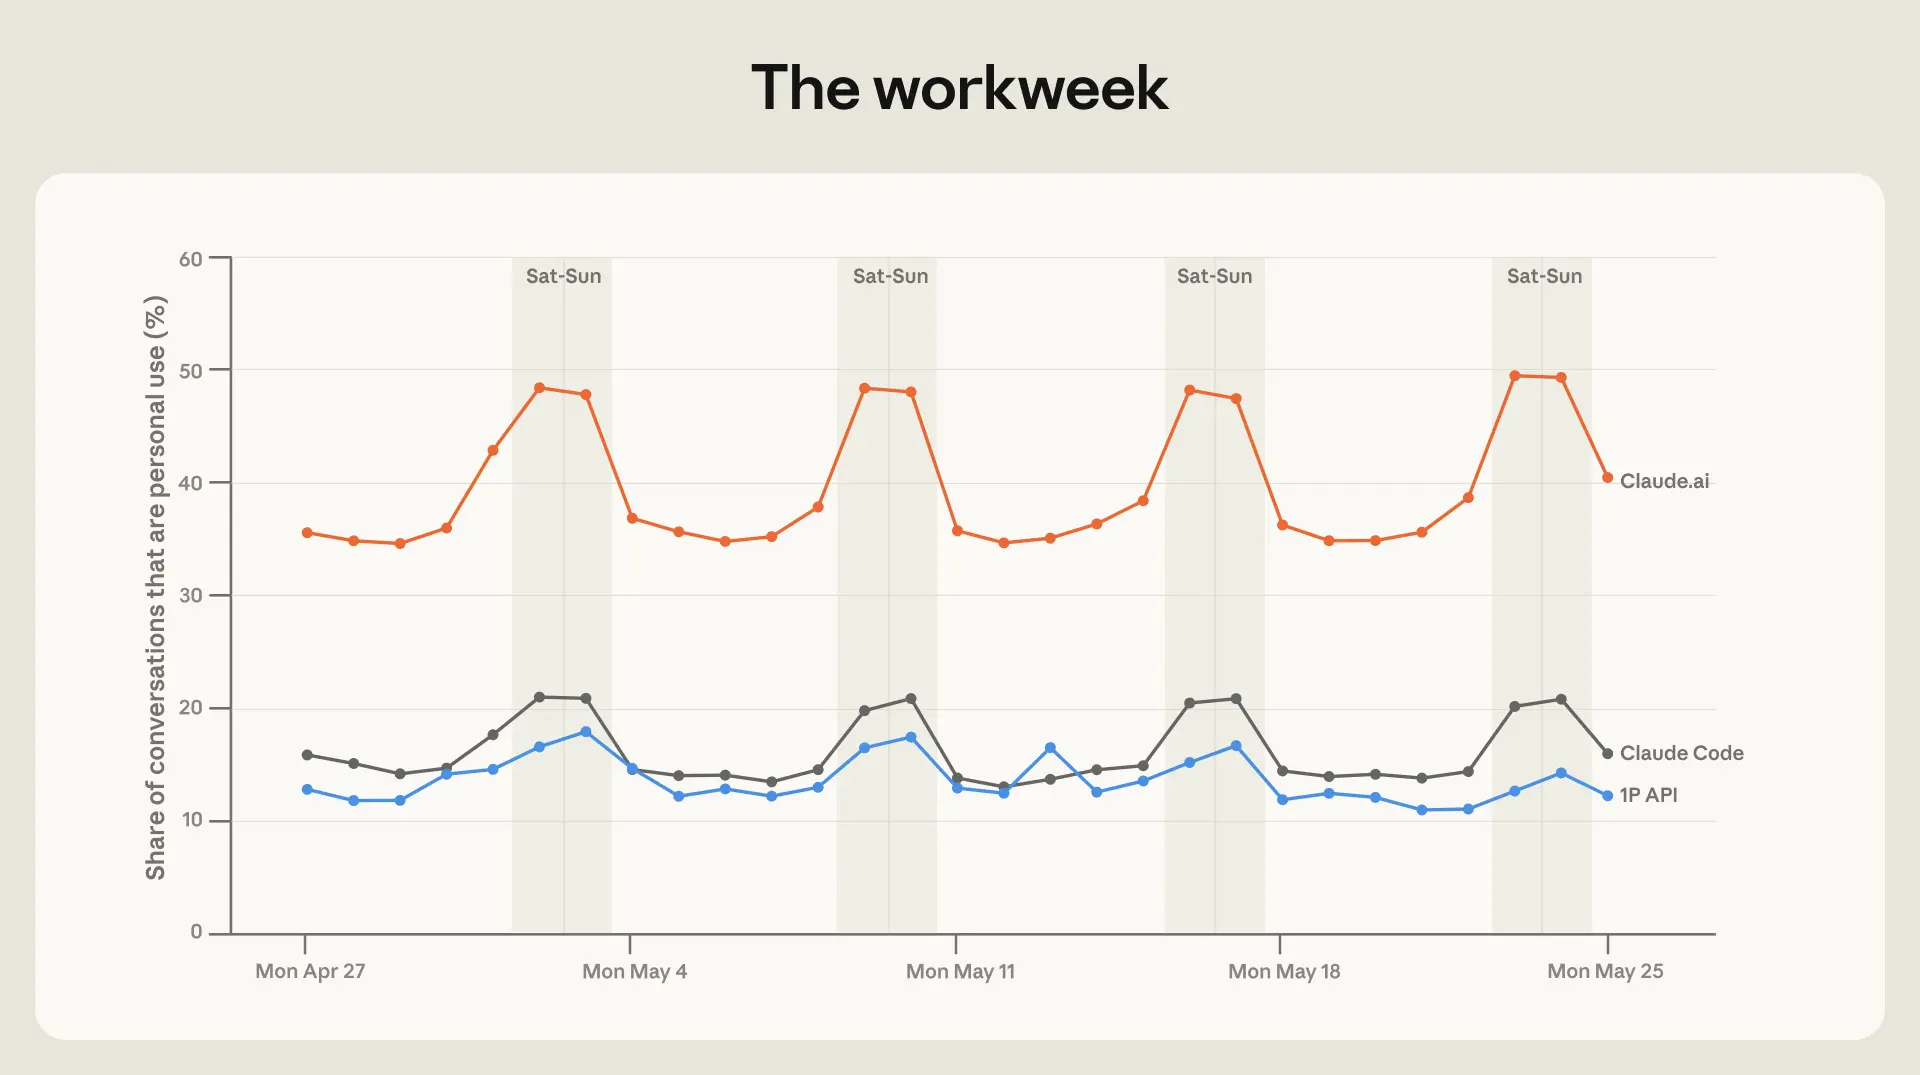
サンプル期間中、チャットと Cowork3 の会話のうち個人的な用途に分類される割合は、平日で約 35% から週末にはわずかに 50% を下回る水準まで上昇します(図 1.1)。勤務週以外では、ユーザーの会話はビジネス文書、マーケティングコピー、スライド資料から、情緒的サポート、医療に関する質問、投資助言へとシフトします。この変化は高所得国で最も顕著です。
 image***図 1.1: 週末に個人的な会話が増加します
**Claude.ai、Claude Desktop、Claude Code、および 1P API(Anthropic を経由して直接ルーティングされる API トラフィック)における、個人的な用途の会話の日別割合。土曜日と日曜日は灰色で塗りつぶされています。*
同様のパターンは Claude Code と 1P API のトラフィックにも見られますが、両者とも個人的な利用のベースライン率は低くなっています。4
リクエストクラスター 5 を用いることで、平日と週末の間で最も変動する特定の Claude Code タスクをさらに深く分析できます。週末において最も減少する Claude Code の使用クラスターには、バックエンドアーキテクチャ、API デバッグ、データストレージが含まれます。一方、最も増加するクラスターは、AI エージェント設計、クオンツ取引(quant trading)、ゲーム開発です。
週末は人々が新たな事業に挑戦するための時間を生み出すこともあります。国を問わず、起業に関する会話は土曜日と日曜日に最も活発になります。しかし、求人への応募活動やその他の業務関連タスクは、週末には減少します。
1 日のリズム
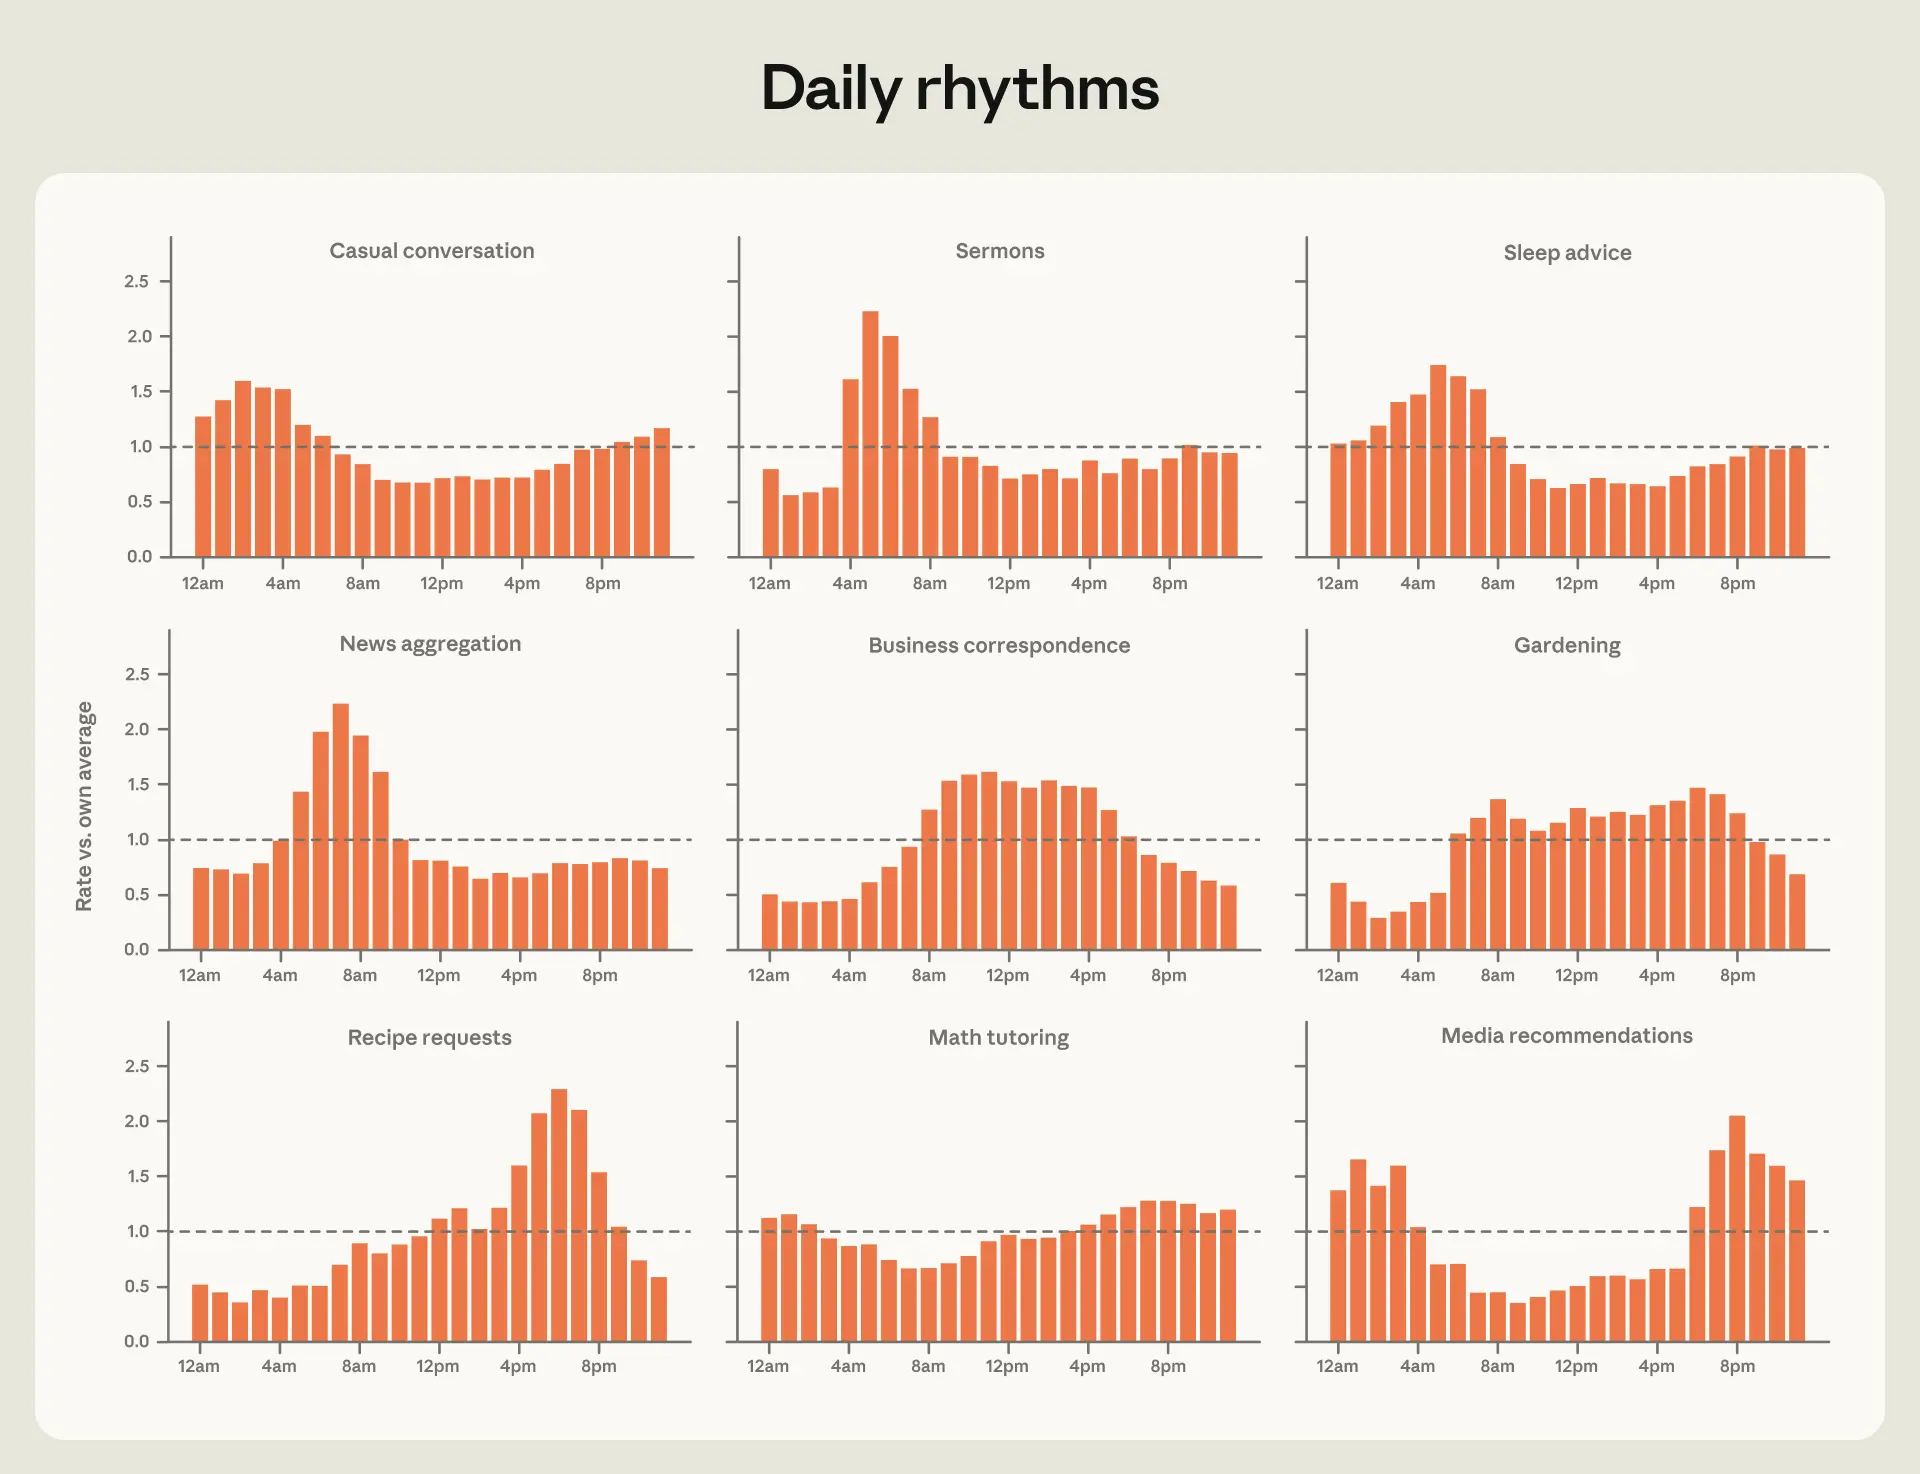
時間ごとに、Claude の使用状況は日常生活のリズムを反映しています。図 1.2 は、グローバルトラフィックにおける各リクエストクラスターの時間別頻度を、全体の平均値に対して示したものです。
人々は現地時間の午前 7 時にニュースを求めます。ビジネス文書(例:メール作成)は勤務日の流れに沿って推移し、午前 10~11 時にわずかなピークを示します。最も大きなスパイクの一つがレシピの問い合わせで、これは平均値と比較して午後 6 時に 2.3 倍の頻度になります。メディアの推薦は夕方に集中しており、人々は夜明け直前の数時間に睡眠に関するアドバイスを求めます。
 image*図 1.2: 一日を通じたリクエストのクラスタ*
**Claude チャットおよび Cowork データに限定し、異なるリクエストクラスタに分類される会話の時別正規化シェア。*
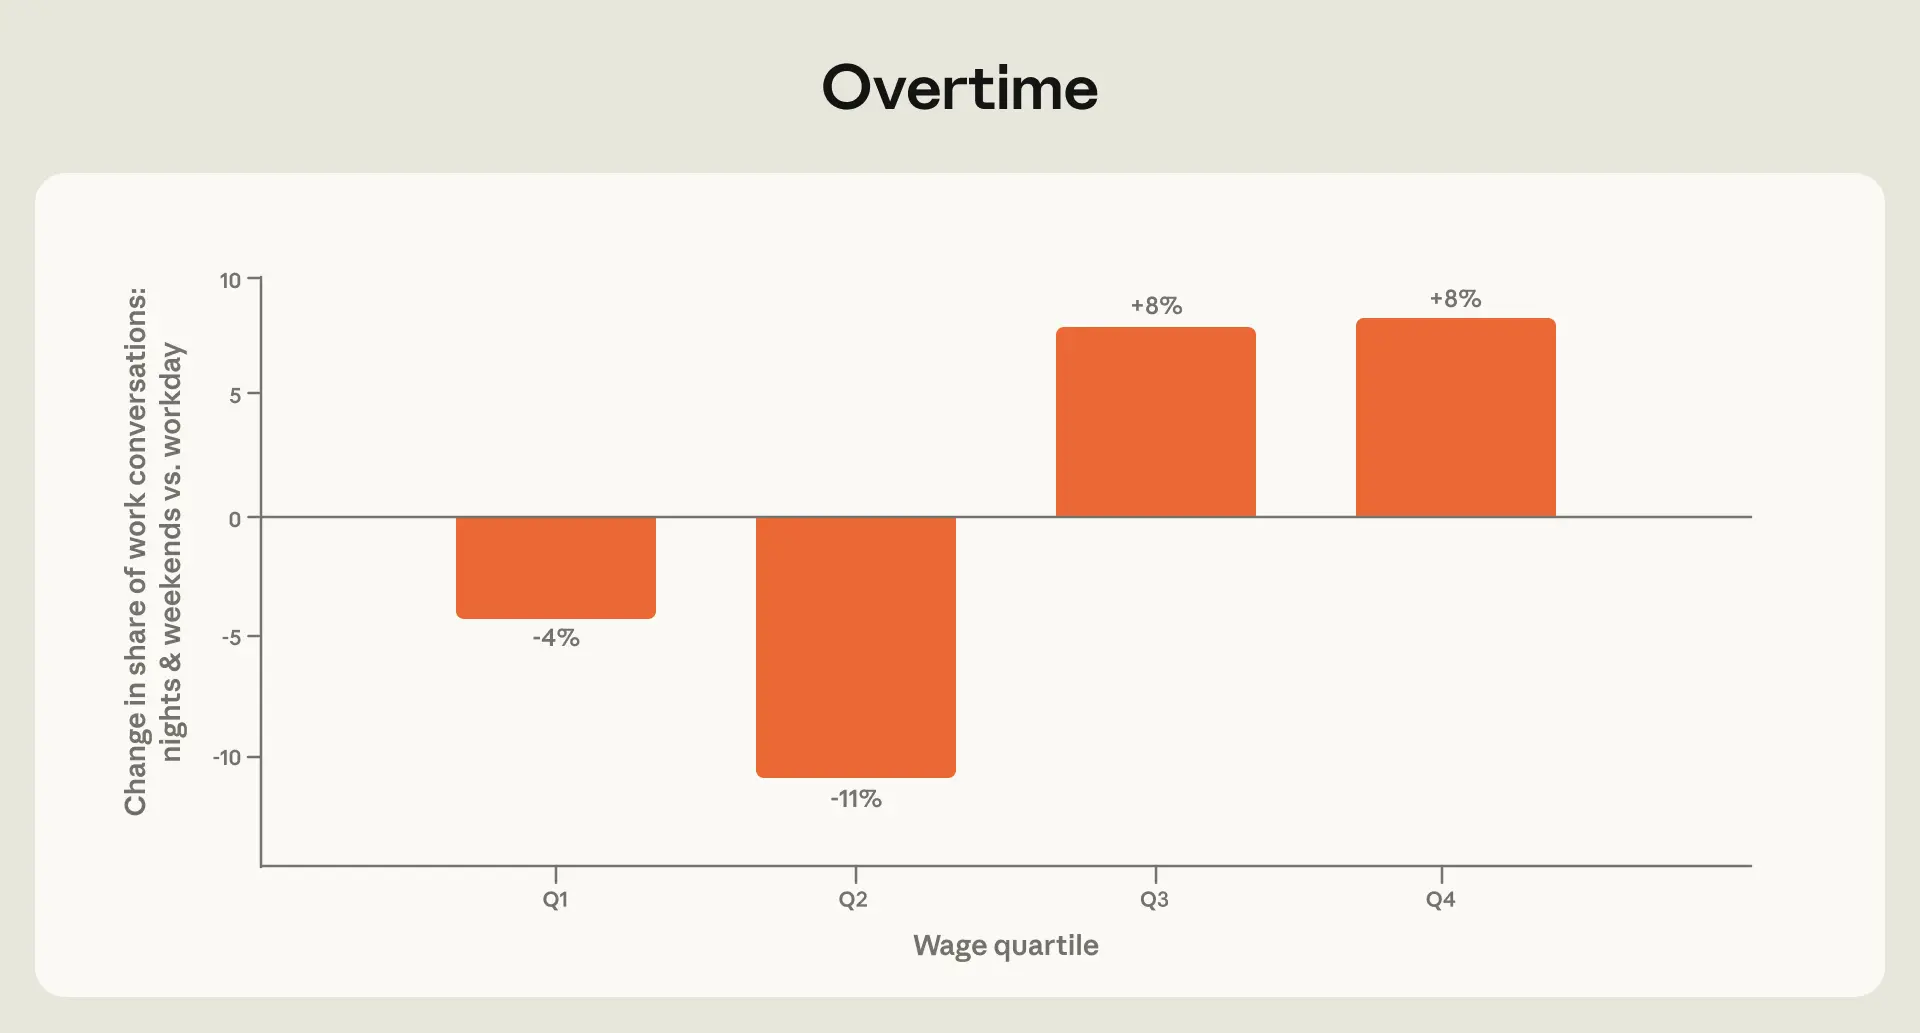
夜間や週末において、人々が Claude を仕事のために利用する際、タスクはより高賃金の職業(図 1.3)へと偏ります。これらのリクエストを行った人々の職種を確定的に特定することはできませんが、これはマーケティングマネージャーやコンピュータプログラマーなど、高収入の職業に従事する人々が伝統的な勤務時間外で働く可能性が高いという事実を反映している可能性があります。対照的に、テレマーケティングや事務作業など、賃金水準の下位 2 クォータイル(四分位数)に属する職種に関連するタスクは、会話全体におけるシェアが小さくなります。このパターンはコンピュータおよび数学関連のタスクによってのみ駆動されているわけではありません:堅牢性チェックにおいてこれらの職業を分析から除外した場合でも、上位クォータイルのタスクは夜間や週末に依然として増加していました。
 image*図 1.3: 夜間および週末における業務関連会話の割合の変化(職業別賃金四分位で分割)
**各棒グラフは、指定された賃金四分位の業務関連タスクが、平日の勤務時間に対する夜間および週末に占める割合の百分率変化を示しています。賃金四分位は、BLS(米国労働統計局)データを用いて計算され、トランスクリプト数で加重されています。*
納税期限日
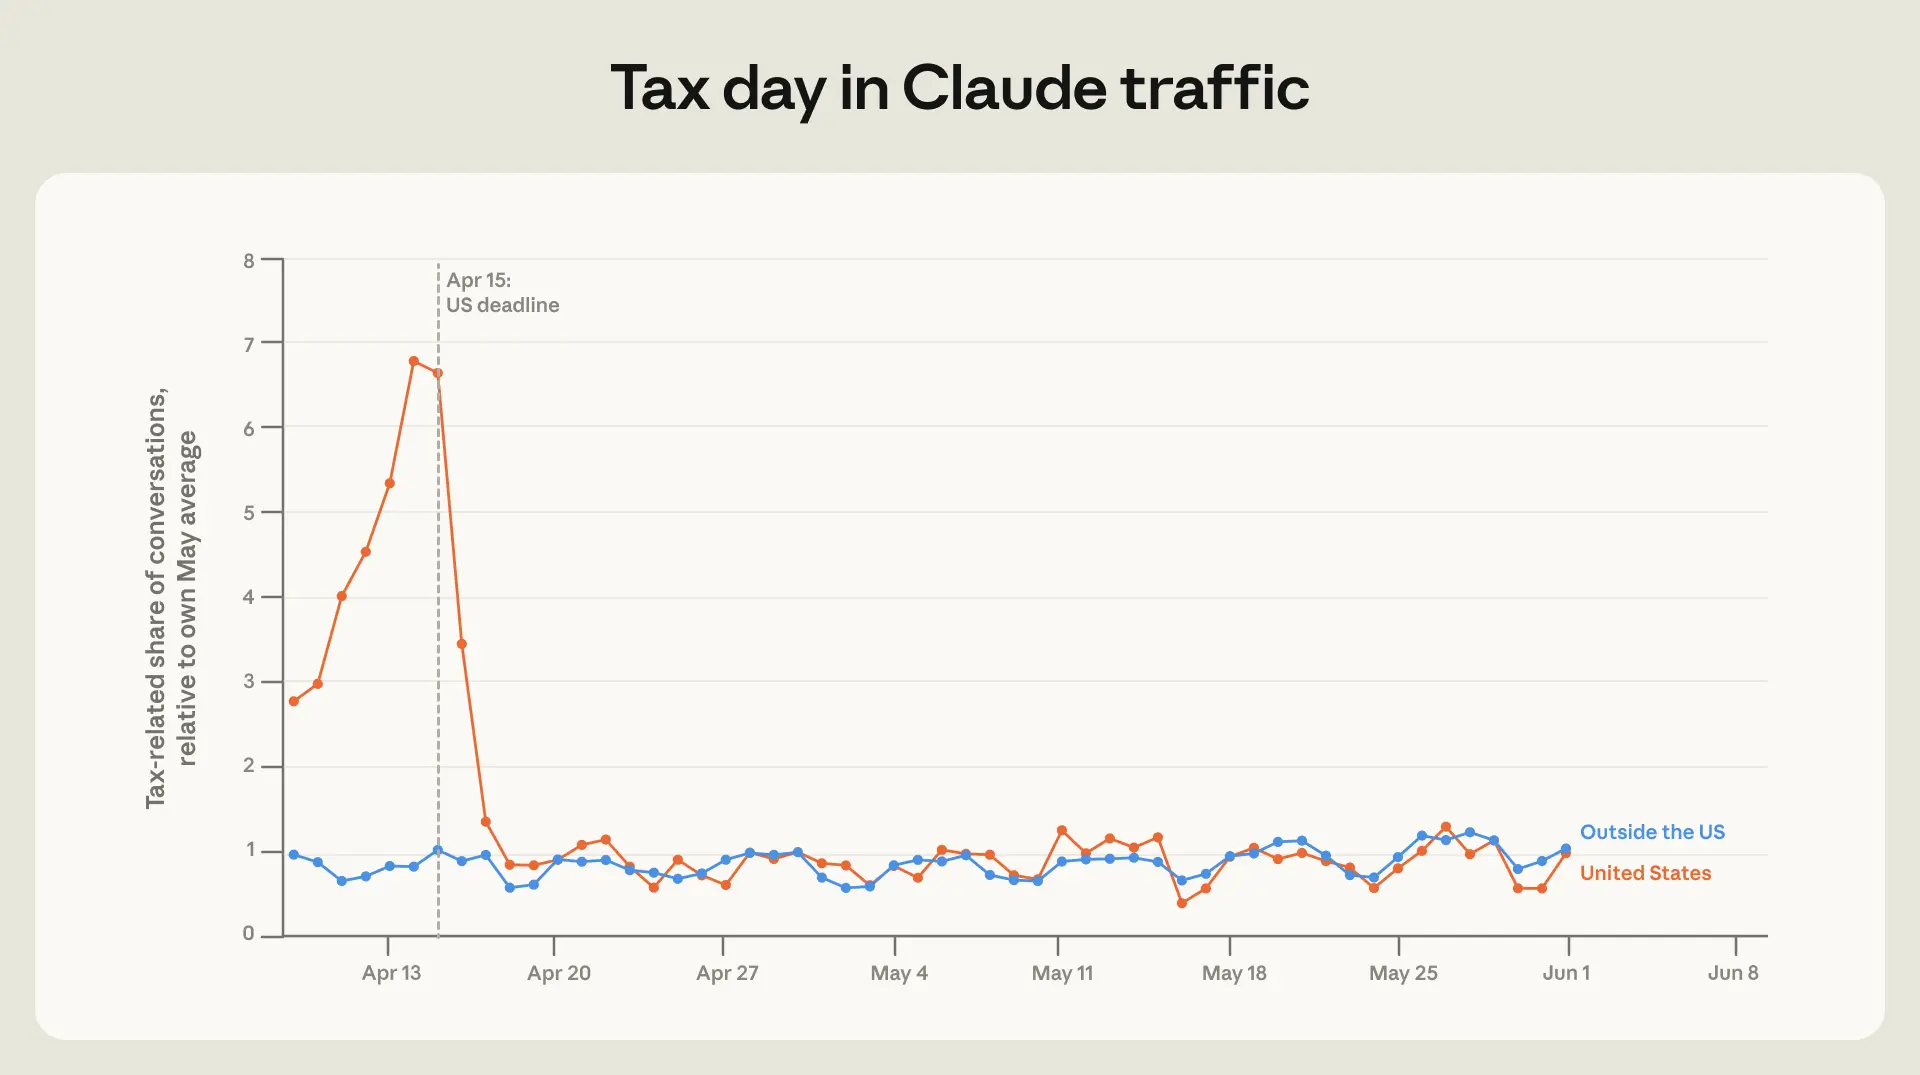
本レポートの対象期間には、アメリカ合衆国における納税申告期限が含まれています。図 1.4 は、期限直前に税務関連の会話の割合が急増している様子を示しています。4 月 14 日には、税務関連のクラスタ(群)は 5 月の平均的な日の 8 倍もの頻度で発生し、4 月 15 日にもほぼ同水準の高い状態が続きました。しかし、4 月 16 日には急激に減少しています。
 image*図 1.4: アメリカの申告期限直前に税務関連の会話が急増
**アメリカおよび世界全体の会話における税務関連の割合。*
Artifacts
この章では、チャットおよび Cowork(以降「Claude 会話」と呼ぶ)上の各会話を生成されるアーティファクトによって分類し、30 以上のカテゴリに整理します。ここでは、会話内で Claude が主に生成する出力——チャットウィンドウ内または別個のドキュメントとして提示される文書、説明、コード、学術論文など——を「アーティファクト」と呼びます。アーティファクトの完全なリストは付録に記載されています。
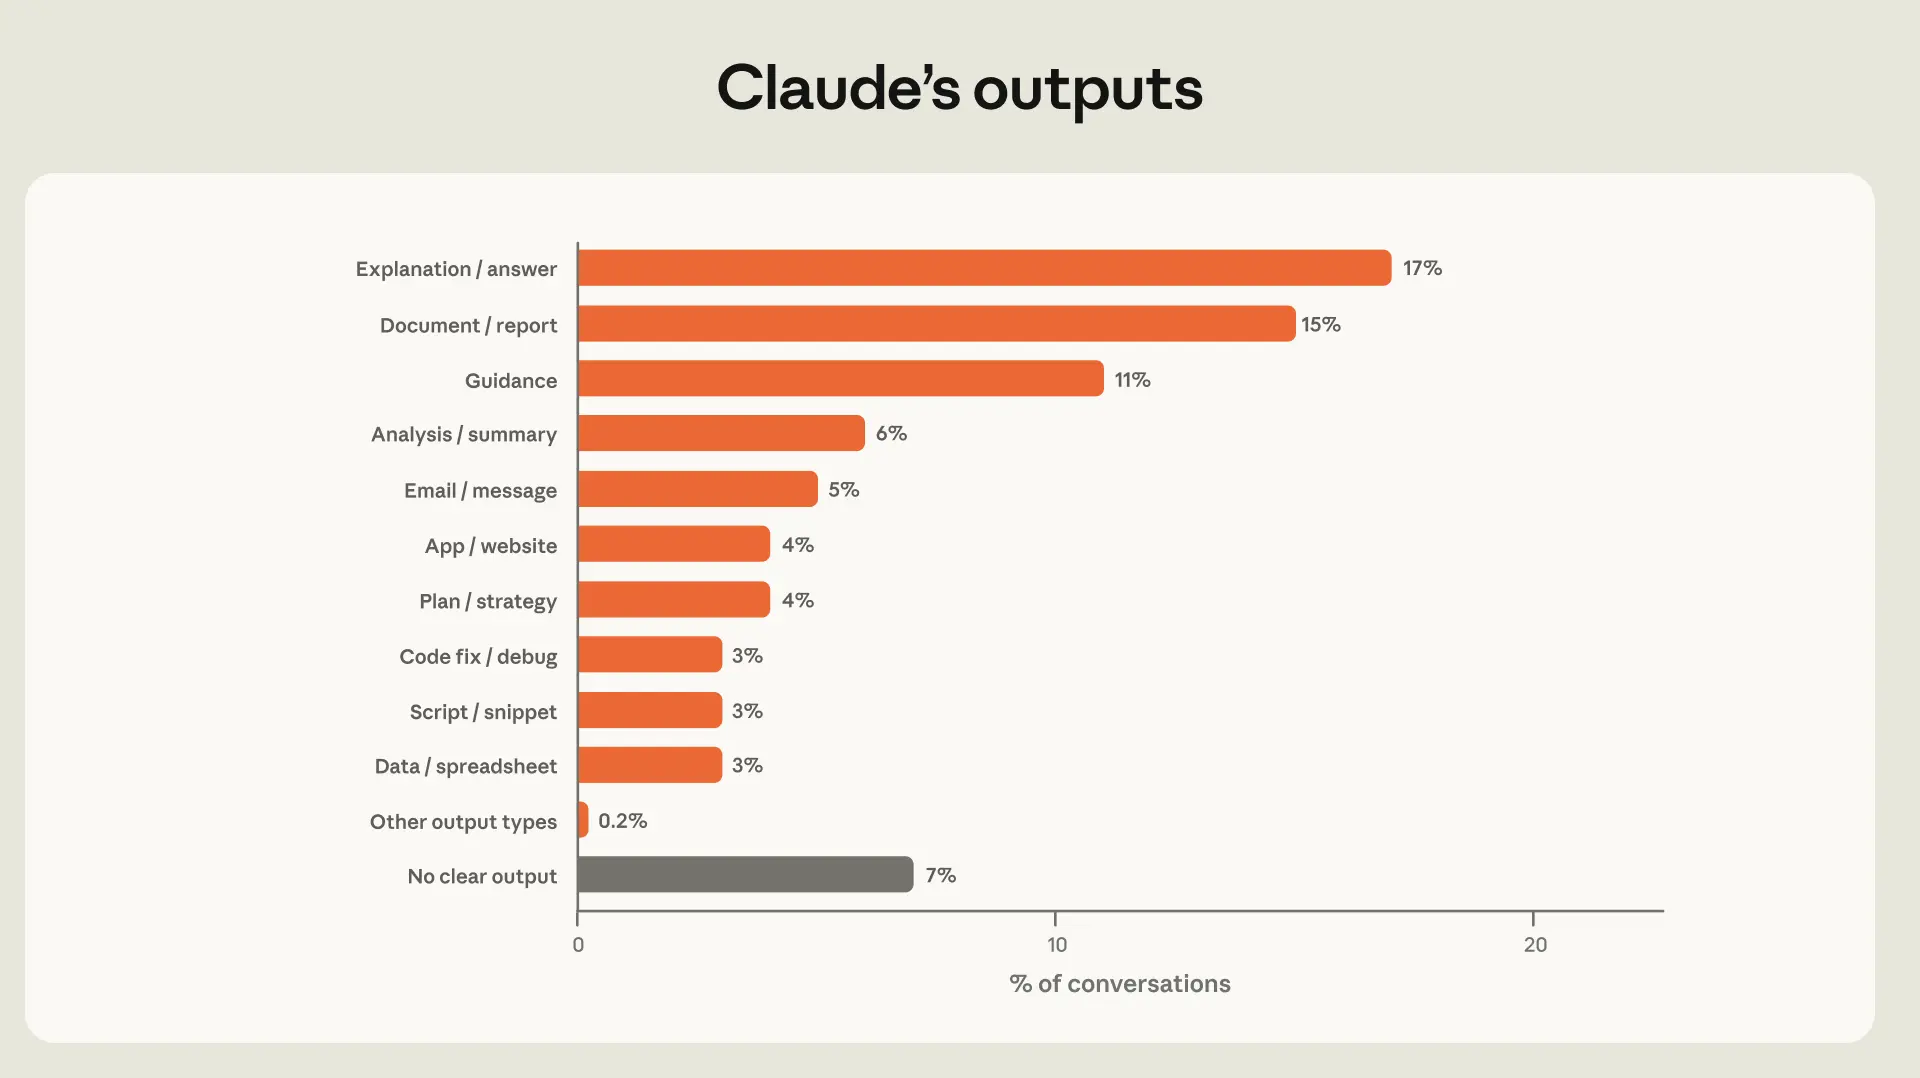
分類器は、Claude 会話の 93% がアーティファクトを生成していることを特定しました(図 2.1)。最も一般的なアーティファクトは説明(会話の 17%)、文書およびレポート(15%)、ガイダンス(11%)です。対話型出力(説明やガイダンスなど)と文書型成果物(文書やプレゼンテーションなど)はそれぞれ会話の約 3 分の 1 を占め、コードおよび技術作業(アプリやスクリプトなど)は約 6 分の 1を占めています。
 image*図 2.1: Claude の出力
**特定の出力を伴う会話の割合。この図は、Claude 会話における最も一般的な 12 の出力タイプを示しています。1P API のミックスについては付録をご覧ください。
出力物が何であるかは、それが何のためにあるかを示すものではありません。同じ成果物は業務用納品物也可以是個人プロジェクトになり得ます。この内訳については次に見ていきます。
各成果物の用途は何ですか?
私たちの1 月の経済インデックスでは、会話を「業務」「個人」「学習」のいずれかに分類するプリミティブを紹介しました。ここでは、その内訳を Claude での会話で生成された成果物(図 2.2)に適用します。
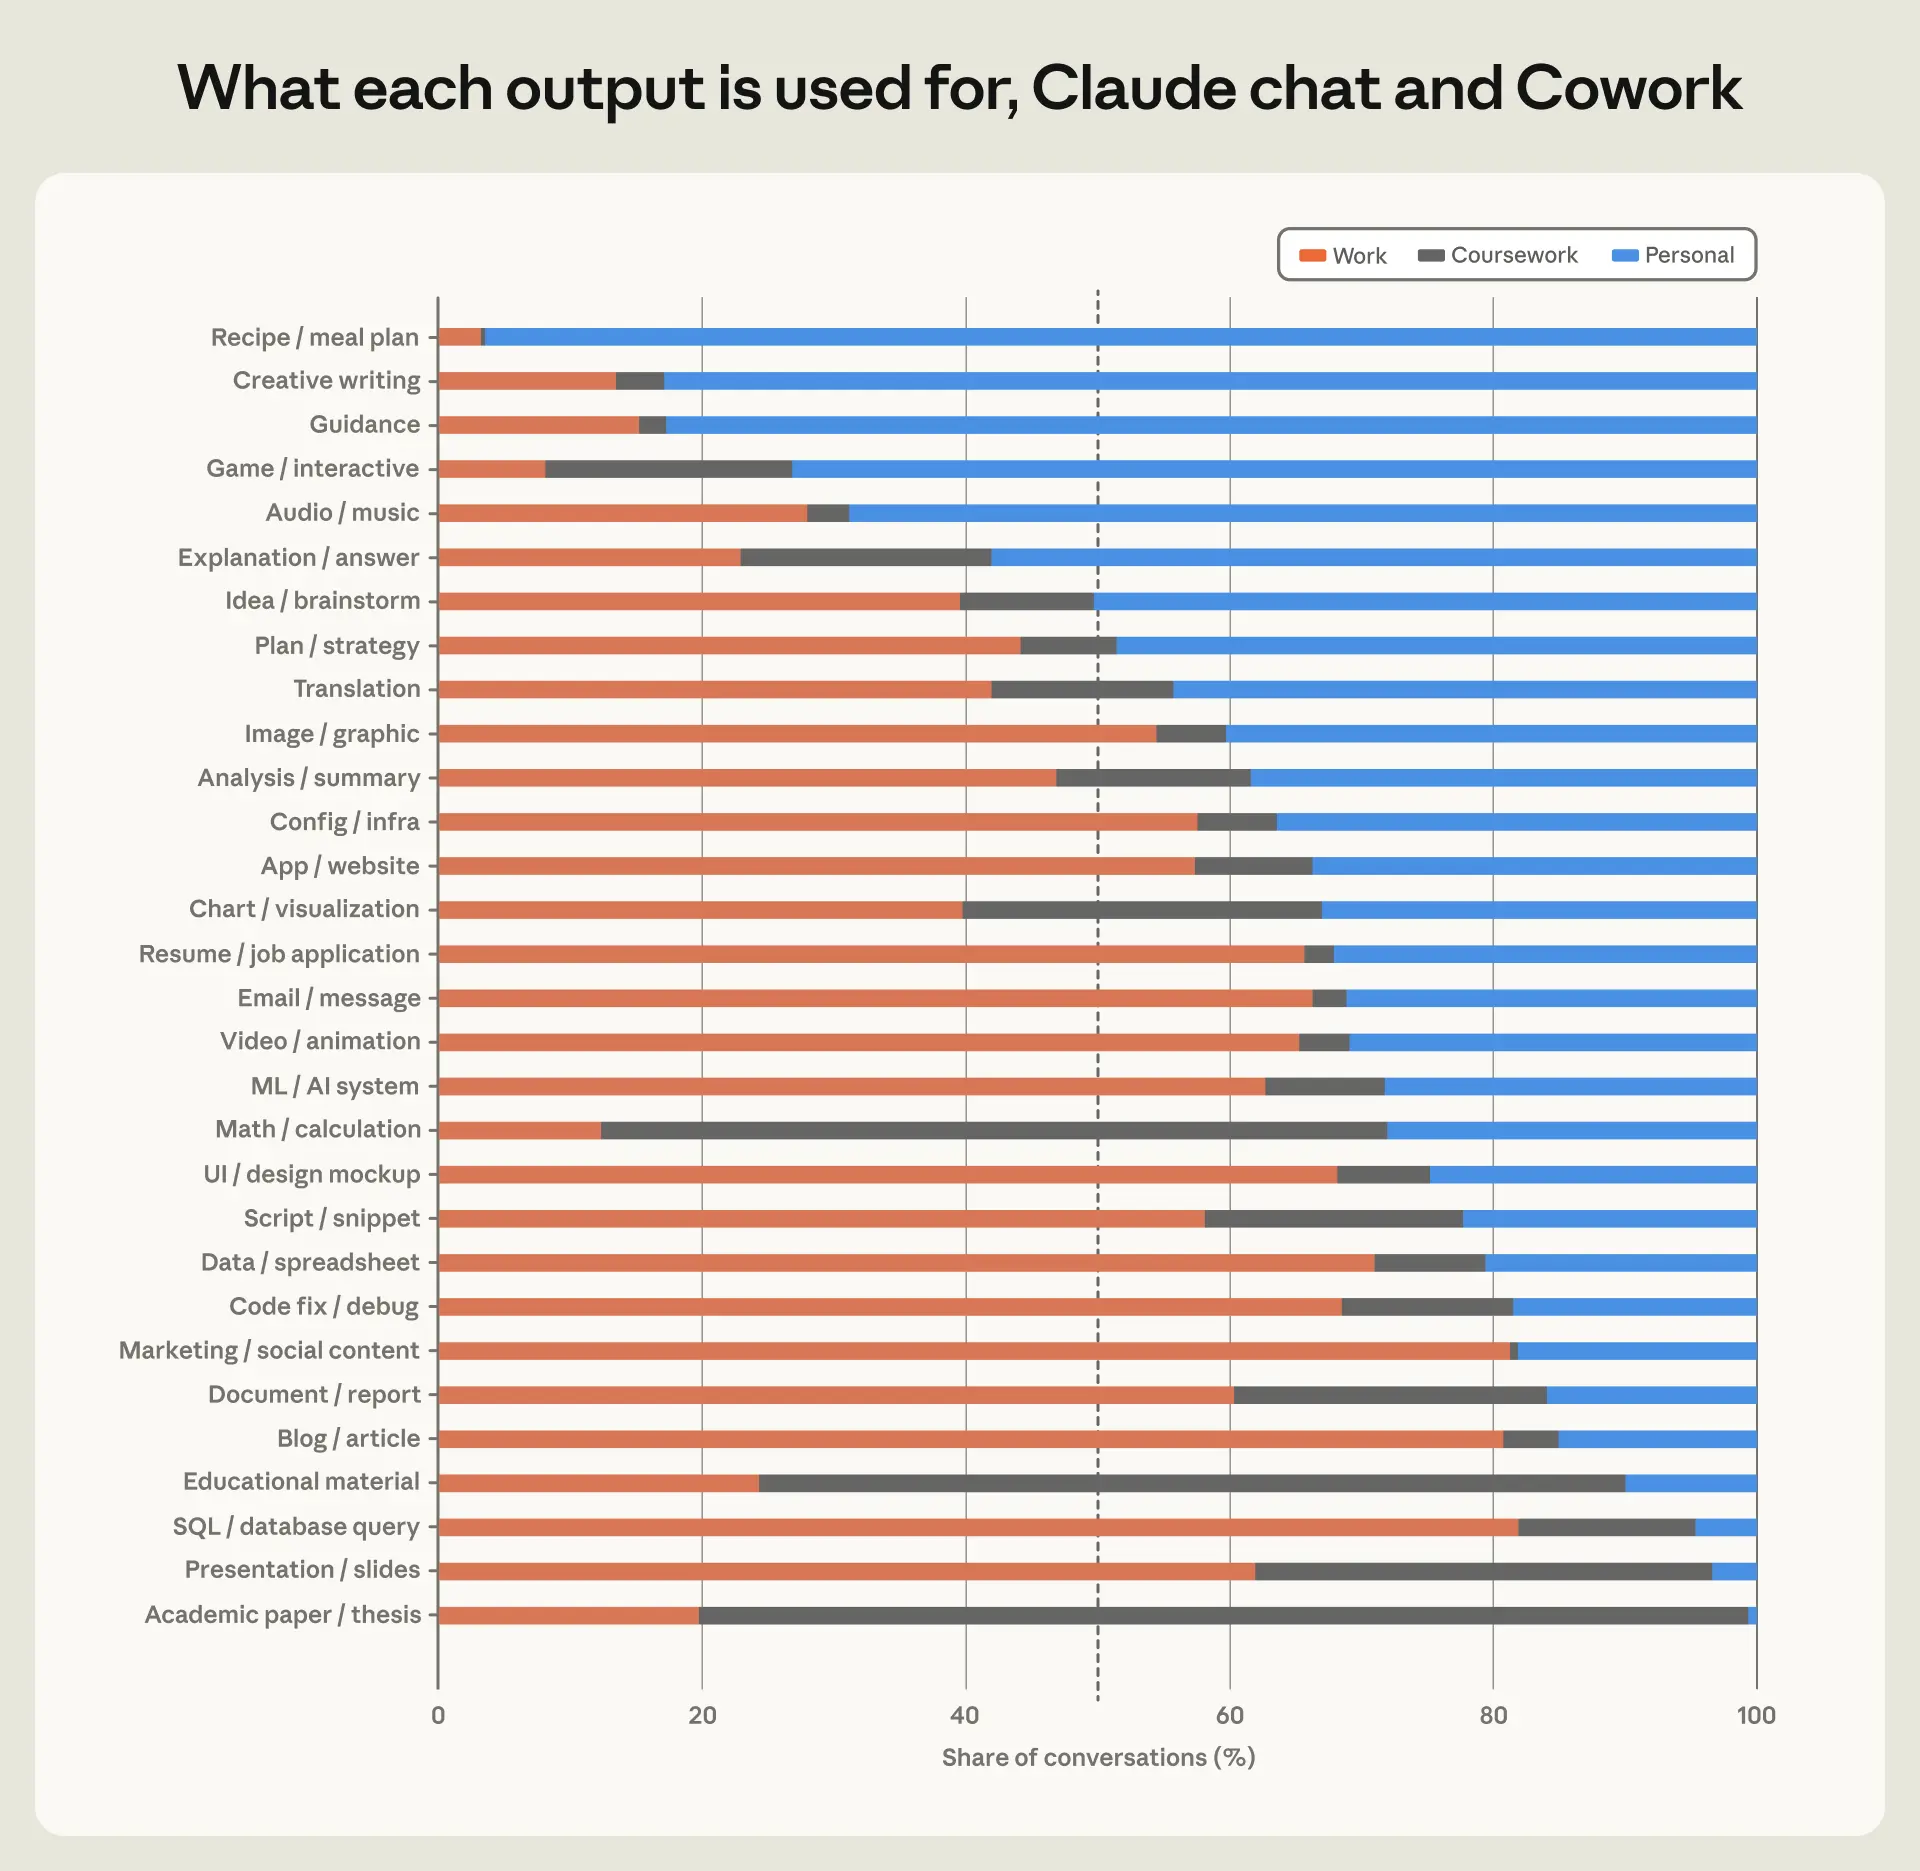
いくつかの成果物のカテゴリはほぼ常に個人用途です。創作ライティング、ガイダンス、レシピを生み出す会話を調べると、80% 以上が個人用途と分類されました。カテゴリ内でも、個人用途と業務関連の用途は大きく異なる場合があります。例えば、個人の創作ライティングではファンフィクション、世界構築、詩が支配的ですが、13% の業務関連部分は主にショート動画のスクリプト、脚本、スピーチという形式をとっています。業務関連である可能性が高いカテゴリには、マーケティングコンテンツの作成(80%)、ブログや記事の作成(81%)、データベースクエリの記述(82%)が含まれます。
多くの出力物は、個人用と業務用のどちらにも等しく使用される可能性があります。例えば、計画や戦略の作成(44% が業務関連、49% が個人用途)や翻訳(42% が業務、44% が個人)が該当します。具体的には、最も一般的な個人の計画成果物には旅行の itineraries やトレーニングスケジュールが含まれますが、業務関連の計画は主に起業家活動やコンテンツ戦略に関するものです。
最後に、課題学習に特徴的な成果物としては、学術論文や学位論文の作成、教育資料、数学関連の問い合わせなどが挙げられますが、それぞれの項目には無視できない割合で業務および個人利用のカテゴリーにも属するものが含まれています。
 image*図 2.2: 利用ケース別の成果物の割合
**特定の出力を持つ会話のうち、その目的に応じて業務・個人・課題学習のいずれに分類されるかの割合。*
逆に問いを転換することもできます。各出力が何に使われるかを問うのではなく、業務用、個人用、および課題学習用の会話がそれぞれどのような種類の成果物を生成する傾向があるのかを問うのです。業務会話では最も頻繁に文書や報告書(20%)が生成され、次いで説明(9%)、メールの草案(7%)、分析と要約(6%)が続きます。課題学習の会話は全体的に類似した傾向を示し、同様に文書や報告書が最多(21%)で、次いで説明(20%)、教育資料(11%)、学術論文(6%)となっています。一方、意外なことに個人会話では成果物が文書として生成されるのはわずか 6% に過ぎません。代わりに最も一般的な結果は説明(25%)と推奨事項(22%)です。
コストは仕事の価値を追跡する
これらの成果物を生成するには計算リソースが必要であり、計算リソースは仕事の価値に比例してスケールする傾向があることが分かっています。私たちは各会話の計算コストをトークン数(処理および生成されたテキスト量、Claude の内部推論を含む)で測定し、各会話が分類されたタスクを通常その業務を行う職業にマッピングすることで、職業間での比較を行います。このセクション全体を通じて、分析は仕事関連の会話に限定されます。
図 2.3 の左パネルは、会話レベルの中央値トークン数とマッピングされた職業の中央賃金との間に正の相関関係があることを示しています。10 例えば、マーケティングマネージャーの賃金は編集者の約 2 倍(時間あたり 80 ドル対 37 ドル)ですが、それぞれのタスクにマッピングされる会話で消費されるトークン数は約 2.5 倍です。確かにこの関係にはノイズが多く、顕著な外れ値も存在します。例えば、薬剤師の賃金は統計アシスタントのほぼ 3 倍(時間あたり 68 ドル対 24 ドル)ですが、薬剤師のタスクにマッピングされた会話で消費されるトークン数はわずか約 1/20 です。
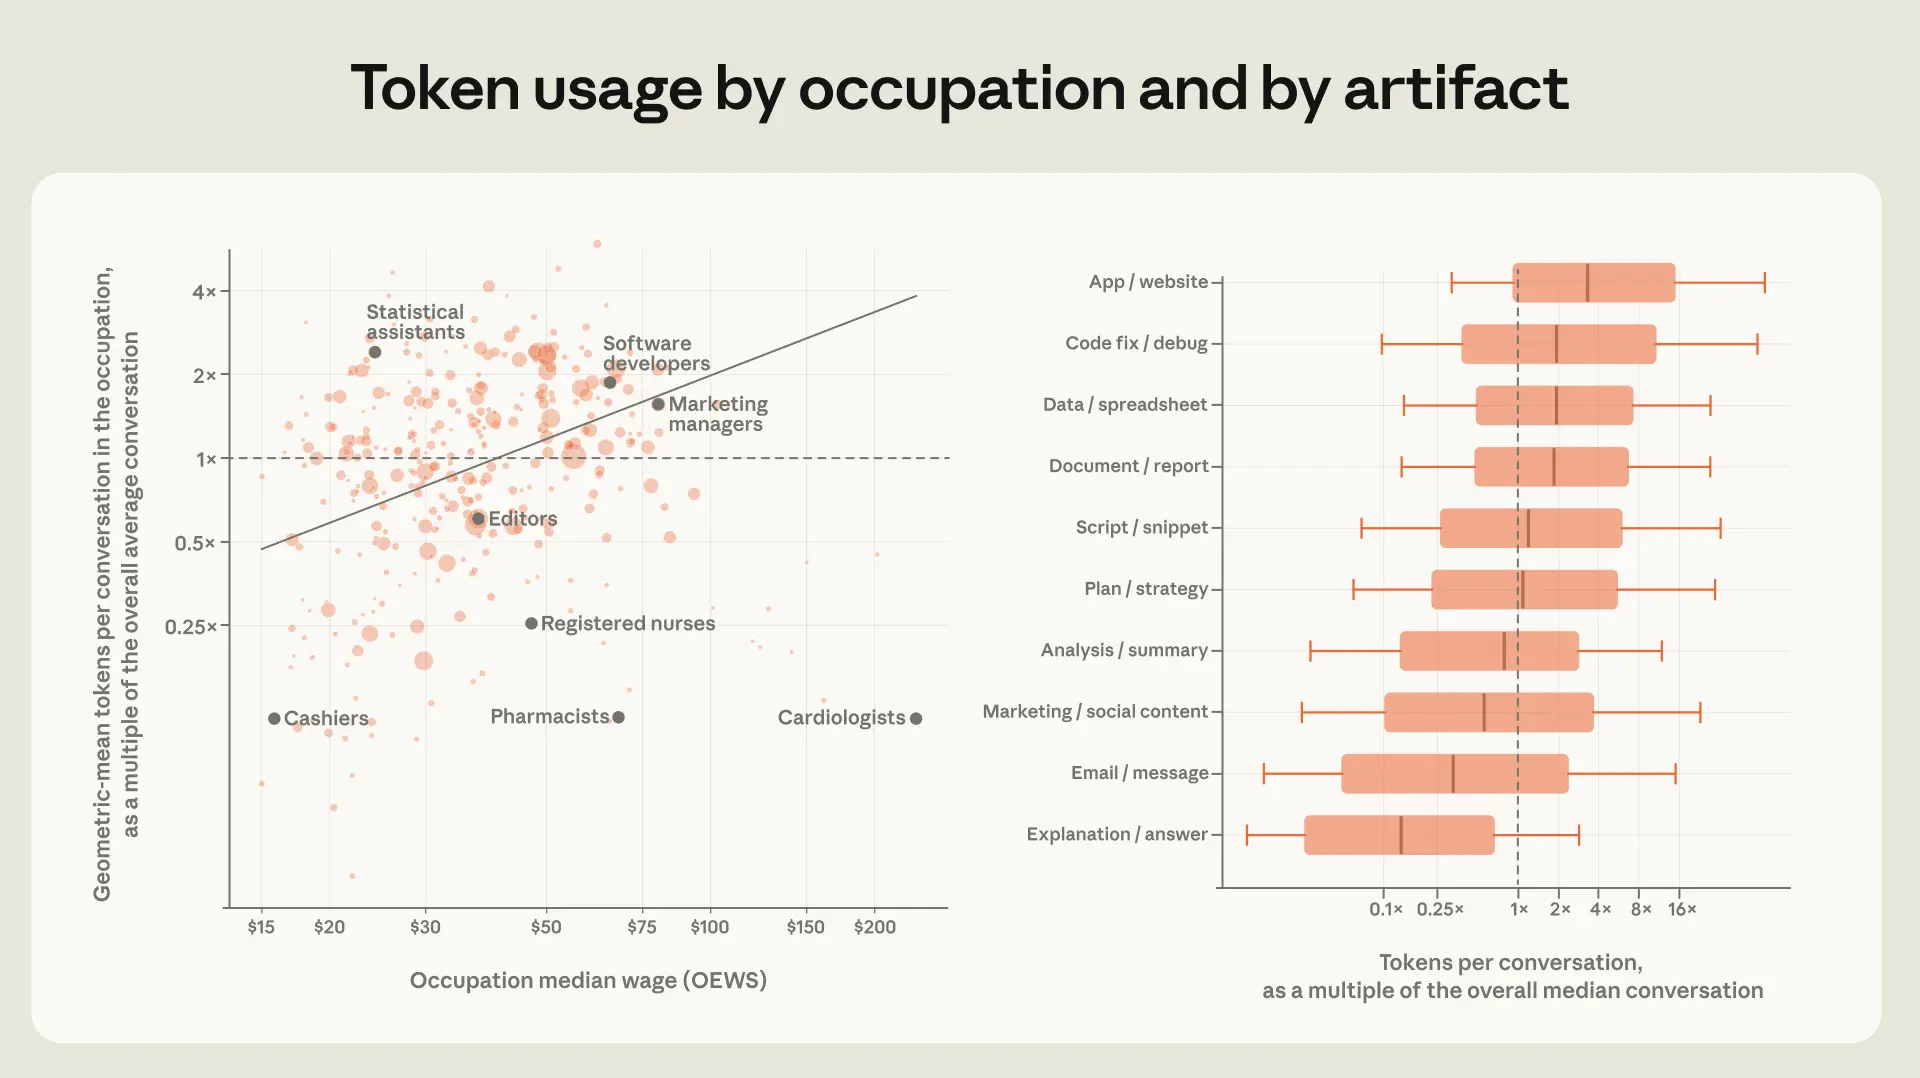 image*図 2.3: 高賃金職種における会話では、より多くのトークンが消費される
**左パネル:特定の職種の中央値賃金と、その職種に分類されるタスクのいずれかに属する会話における典型的な(幾何平均)トークン数の関係を示しています。このトークン数は全体平均で正規化されています。両変数は対数スケールで表されています。右パネル:特定のアートファクトを生成するために使用されたトークンの分布です。黒線は中央値を表し、箱は p25 と p75 を、ひげは p10 と p90 を示します。すべての数値は全体の中央値トークン数で正規化され、対数スケールで提示されています。両パネルのデータはチャットと Cowork に限定され、業務関連と分類された会話にのみ適用されます。トークン数は、どのモデルがその会話を担当したかについては調整されていません。*
異なる種類の成果物を生成するために消費されるトークンの数は、似たような物語を語っています。より複雑で価値の高い出力は、単純な出力に比べて著しく多くのトークンを消費する傾向があります。例えば、アプリ構築に関する会話は、中央値の会話よりも3倍以上のトークンを使用します。一方、このスペクトルの反対側では、典型的な説明は中央値の会話の約5分の1のトークンしか使用しません。トークン消費における賃金勾配の約44%は、出力ミックスによって説明されます。つまり、より高賃金の職業ほど、計算集約型の成果物を生成する可能性が高くなります。
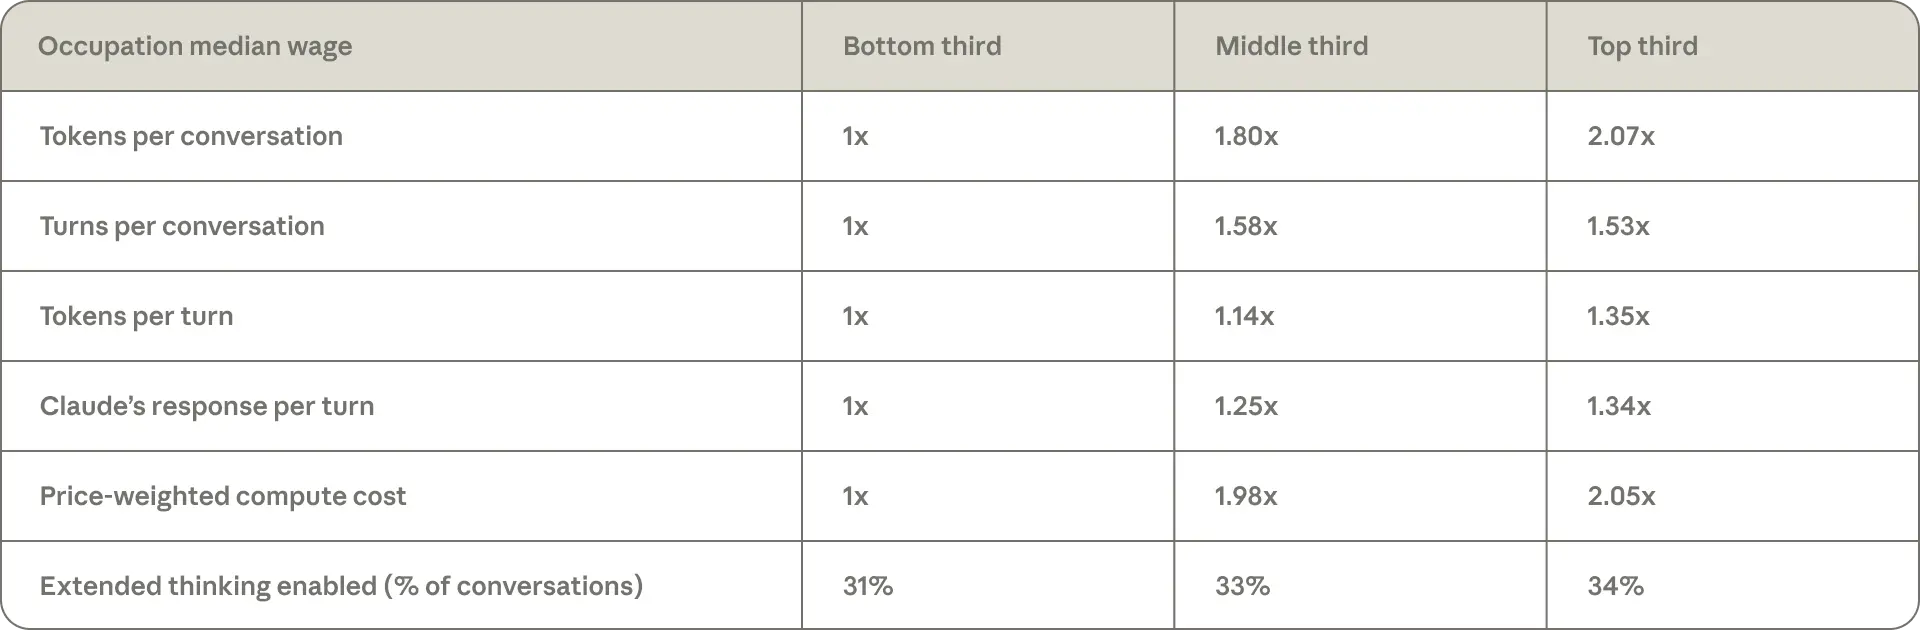
これが経済的になぜ重要なのかというと、高賃金職種に割り当てられた会話では、Claude はより多くの出力(1 回転あたり1.34倍の出力)を生成し、ユーザーはより深く関与し(1.53倍のターン数)、拡張思考もより頻繁に活用しています(34% の会話に対して31%; 表2.4)。決定的なのは、これらが連動している点です。Claude からの生産量が増えることは、ユーザーからの生産量が減ることを意味しません。人間が最も価値の高いタスクに関与し続ける限り、このパターンは労働を代替するものよりも労働を補完するものであるように見えます。また、ある程度までは、より価値のある出力にはコストがかかることも示しています。次のセクションでは、各会話内の意思決定のどの部分が Claude に委譲されているかを検討します。
 image*表 2.4: 高賃金職種でトークン消費量が増加する要因
高賃金職種に分類された会話において、トークン消費量を増大させる会話の特徴。職種は、各職種にマッチした会話数で加重した中央値賃金に基づいて下位・中位・上位の 3 つのグループ(terciles)に分類されています。計算関連の指標は、下位グループの幾何平均値によって正規化されています。例えば、最初の行では、上位グループの職種に分類された典型的な会話が、下位グループの職種に分類された典型的な会話よりも 2.07 倍多くのトークンを消費することが示されています。
Claude はどの程度の自律性を持って自ら決定できるのか?
これは「なし」から「極端」までの 1〜5 のスケールで測定します。記述や指定が容易なタスクでは自律性は低く、最も自律性の低い出力は数学計算、翻訳、および Q&A です。一方、自律性の高いタスクとは、多数の選択肢の中から選択を要するものであり、具体的にはアプリやウェブサイトの作成、ゲーム、プレゼンテーションなどが該当します。持続的な判断力を必要とするこうした業務は、歴史的に自動化が困難とされてきました。Claude Chat と Cowork の自律性レベルを Claude Code と比較することで、この状況に変化が生じつつあることを示しています。
ほぼすべての出力タイプ(表示されている31種類のうち26種類)において、Claude Code における AI の自律性はチャットや Cowork よりも高いです。11 例えば、スクリプトやコードスニペットを生成する会話では、同じ出力をチャットまたは Cowork で作成する場合と比較して、Claude Code を使用した場合の方が平均で 0.53 ポイント(1〜5 スケール)だけ自律性が高くなります。すべての会話を通じて見ると、自律性の平均差は 0.37 ポイントであり、この差には主に2つの要因があります。12
この差の約3分の2は、同じタスクを Claude Code ではより多くの委任(デレゲーション)によって実行されることで説明できます。ブログ記事や記事がその例を示しています:両方のインターフェースにおけるリクエストと背後にあるタスクは似ていますが、人々が Claude とどのように作業するかという点では明確な違いがあります。ブログ記事や記事を作成するチャットおよび Cowork の会話の中央値では、13 回のやり取り(バックアンドフォース)が必要ですが、ブログを生成する Claude Code セッションの中央値には人間のプロンプトが1回だけ含まれています。残りの3分の1は、両方のインターフェース間で出力タイプのミックスが異なることを反映しています。
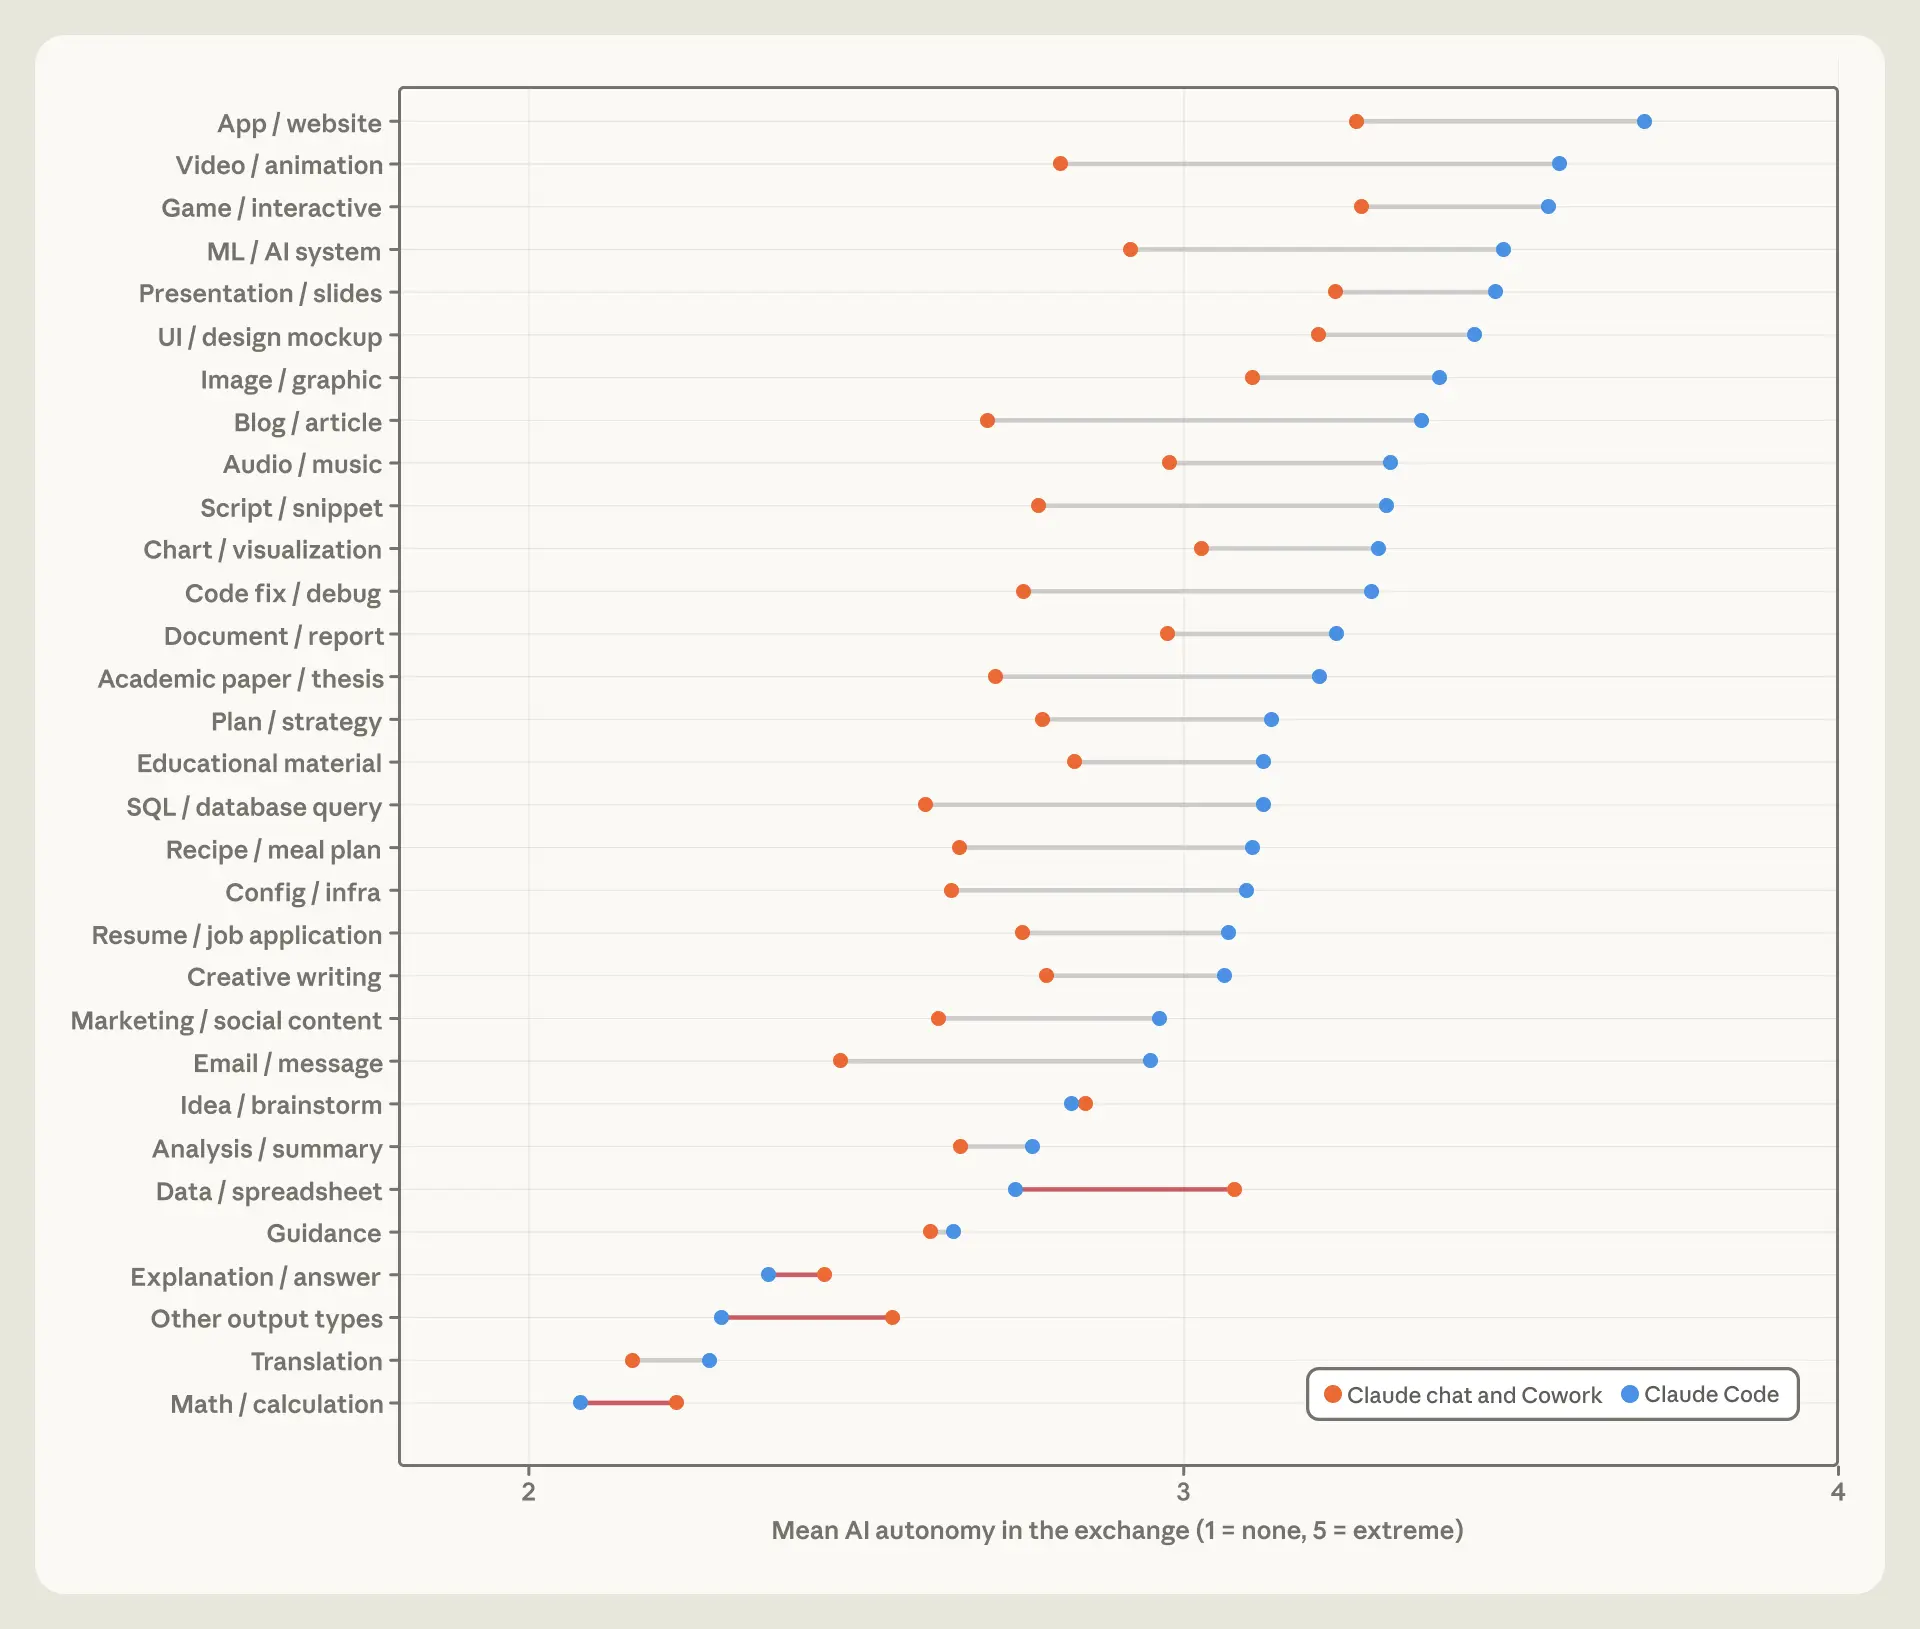 image*図 2.5: *出力タイプ別の AI 自律性
**会話の出力およびインターフェース別における AI 自律性の平均レベル。AI 自律性は「なし」から「極端」までの 1〜5 スケールで評価されます。
この違いは単にモデルの選択を反映しているだけだと疑う人もいるかもしれません。Claude Code セッションでは、最も能力の高いモデルが使用される頻度がはるかに高く(Opus による提供が 54% であるのに対し、チャットや Cowork の会話では 10% に過ぎません)。しかし、同じモデルによって提供された会話を比較しても、この格差はpersistします。例えば、Sonnet を使用する会話の中でさえ、Claude Code セッションでは自律性が 0.26 ポイント高いことが示されており、これは製品自体が基盤となるモデルよりも重要である可能性を示唆しています。
表面的な比較から一歩引いて考えると、ユーザーが最も委任する出力タイプは、計算リソースを最も消費するものと同じです。アートの種類全体を通じて、平均的な自律性と中央値のトークン使用量は同時に上昇します(チャットおよび Cowork において r = 0.68; Appendix 図 A.2)。
Claude は要求されたレベルを超えて回答する
各会話において、分類器は2つの読解レベルを推定します。1つはユーザーの問い合わせに対するもの、もう1つは Claude の応答に対するもので、それぞれテキストを理解するために必要な教育年数として表されます。13 私たちの調査では、アーティファクトの種類によって読解レベルが大きく異なることがわかりました。学術論文を生成する平均的な問い合わせには、16 年以上の教育が必要であり、これはおよそ学士号レベルに相当します。また、これらの会話の 15% は博士号レベル以上(20 年以上の教育)です。一方、レシピやガイダンスを生成する会話では、問い合わせを理解するために必要な教育年数は 10 年以下です。
一般的に、読みレベルの高い出力を生成するアーティファクトタイプは、それに対応して高い読みレベルのプロンプトを持つ傾向があります(会話全体で相関関係 0.87)。しかし、私たちはほぼすべてのカテゴリにおいて、Claude の出力がプロンプトよりも約 1 年分の教育水準に相当する高い理解度にあることも観察しています。この差が最も顕著なのは、ユーザーが構築すべきものを記述する場合です。具体的には画像・グラフィック(+2.6 年)、ゲーム(+1.9 年)、アプリ・ウェブサイト(+1.7 年)などです。この差の一部は単に文体の違いによるものかもしれません。プロンプトはしばしば簡潔で非公式であるのに対し、Claude は洗練された文章で応答する傾向があるためです。しかし、読者向けライティングにおいては、その差はほぼゼロです(ブログ −0.1、学術論文 +0.0、メール +0.3)。これはおそらく、プロンプトが意図する出力と同じ文体で書かれた言語やソース資料の草案であることが多いためと考えられます。
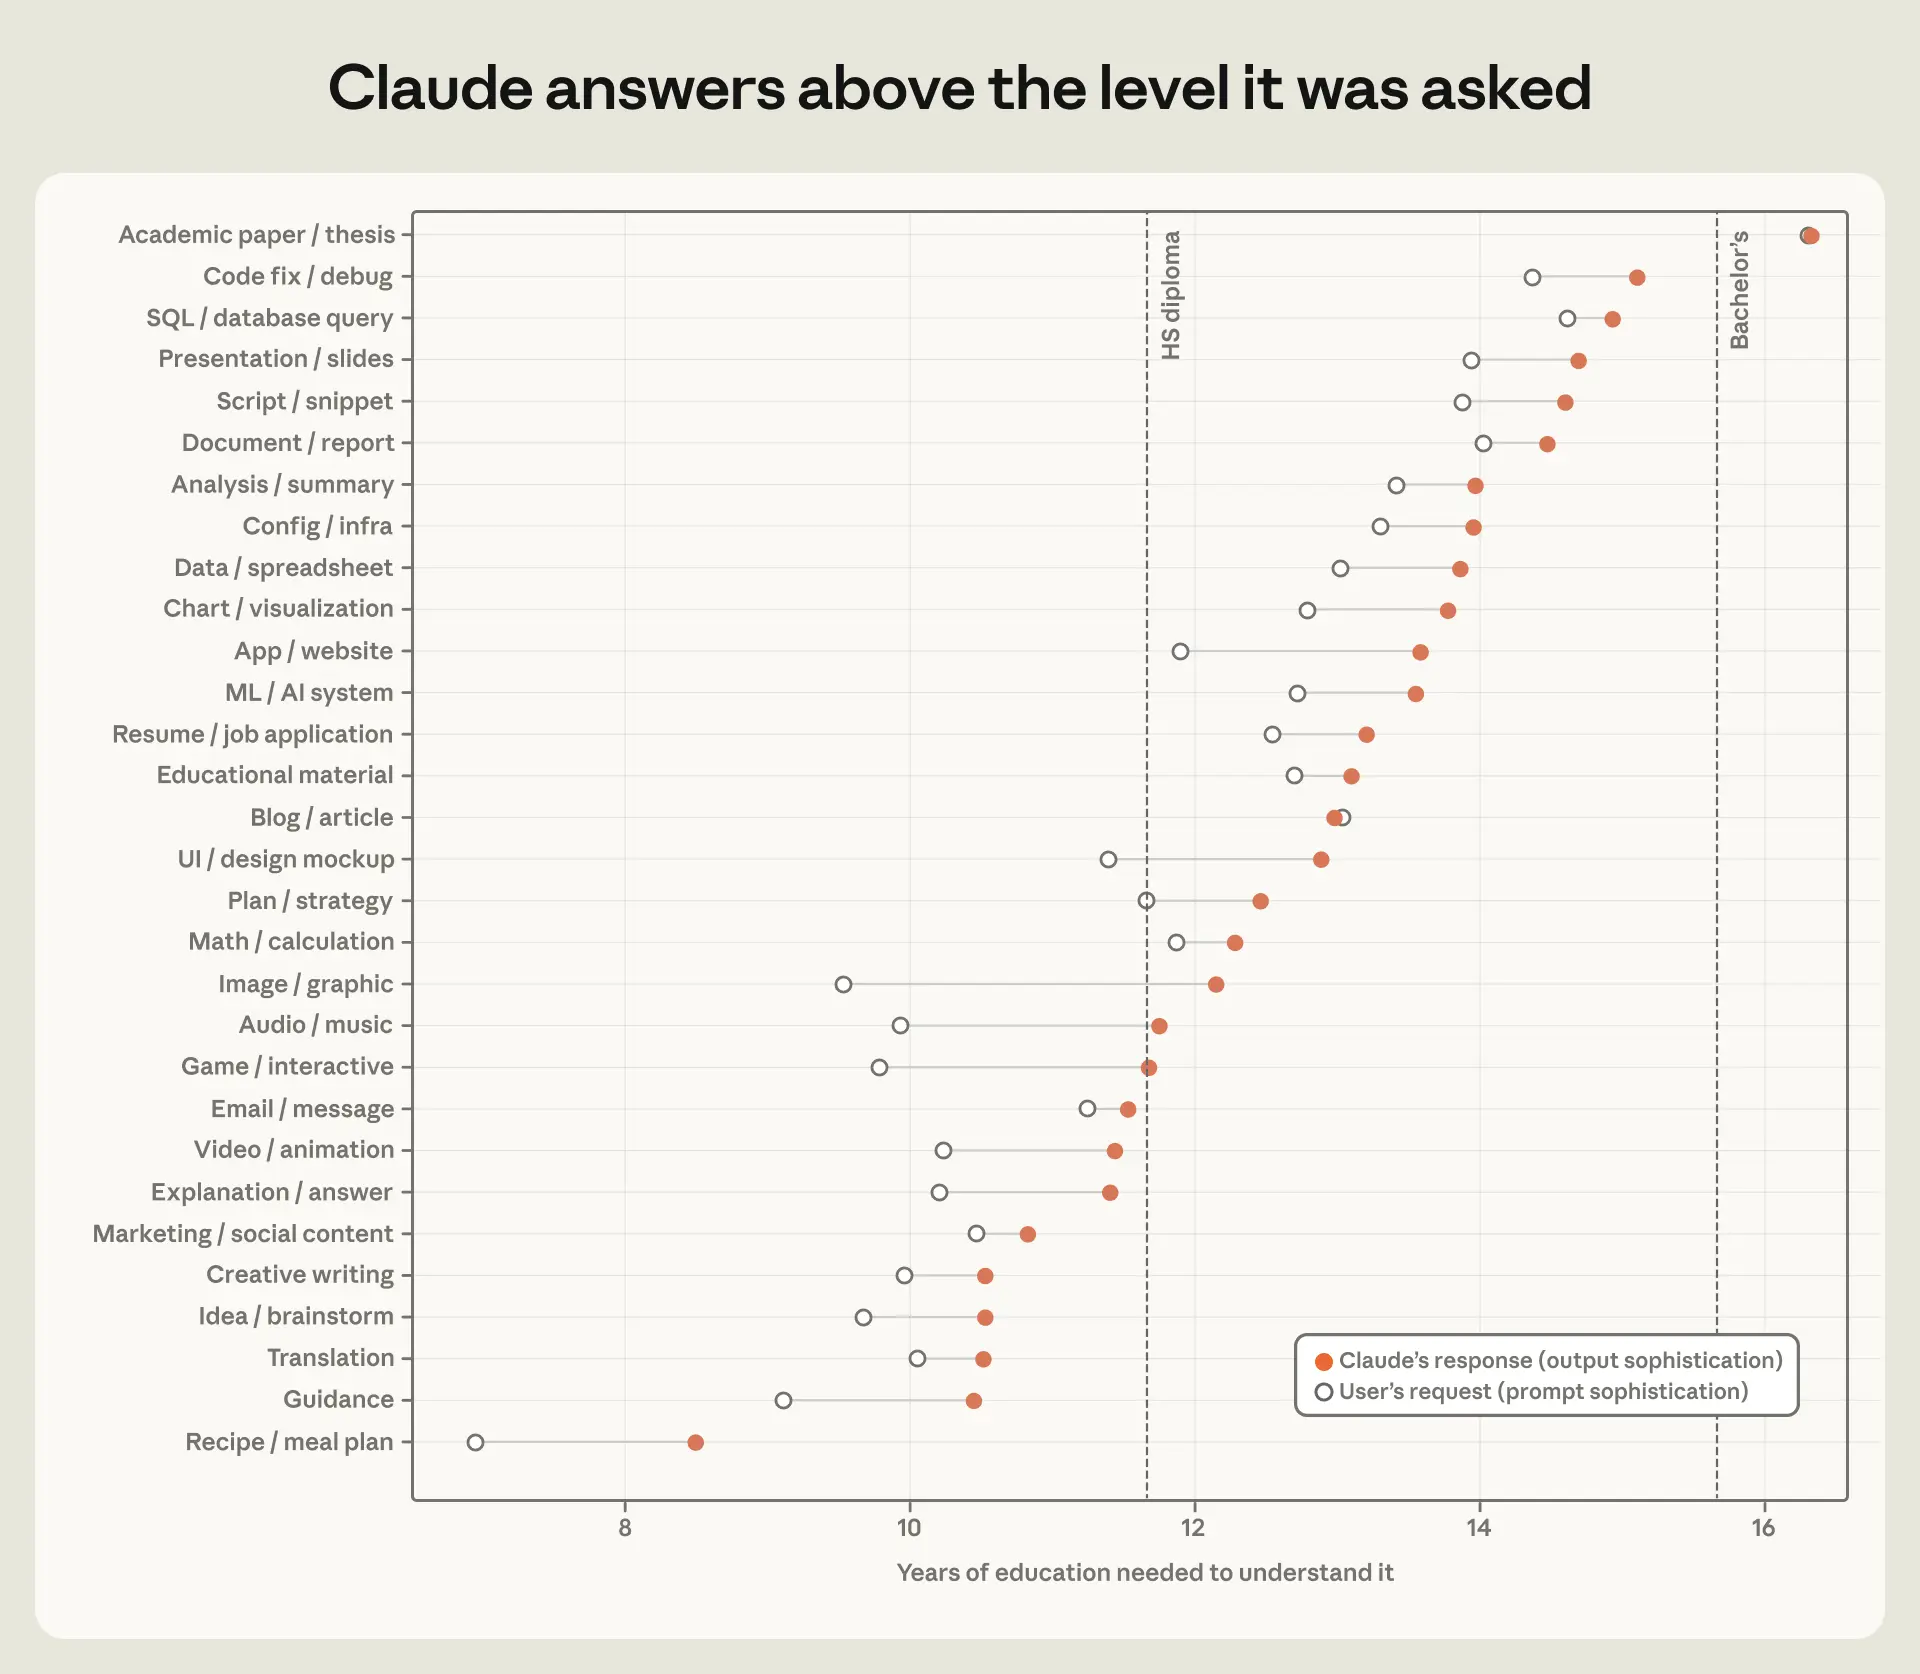 image*図 2.6: アーティファクト別、ユーザープロンプトと Claude の応答の読みレベル
***ユーザーのプロンプトと Claude の応答を理解するために必要な推定教育年数。チャットおよび Cowork に限定。
認識
最初の 2 つの章では、人々が Claude をどのように使用しているかが示されていますが、職場における AI の体験について、仕事や職場がどう変化すると期待されているか、AI の現状および潜在的な影響に対して人々がどう感じているか、そして技術から何を望んでいるかについては、あまり洞察を提供していません。2025 年 12 月に Anthropic Interviewer を通じて実施した 81,000 人の Claude ユーザーへのインタビュー は、その姿を浮き彫りにしました: 回答者は大きな生産性向上を報告しましたが、同時に職の代替に対する懸念も表明しました。これらの懸念は、主にキャリア初期の労働者や、Claude が最も多くの業務を担当していると観察される職種に集中していました。14
2026 年 4 月、私たちはこの取り組みをさらに発展させるために Anthropic Economic Index Survey を開始しました。本調査では、人々に AI と仕事に関する経験を直接尋ね、Claude の利用状況によって回答がどのように変化するのかを探求することができます。私たちは、プライバシーを保護する手法 privacy-preserving methods を用いて、5 月中旬から 6 月初旬にかけての期間における調査回答と利用データをリンクさせています。各回答者の利用パターンを特徴づけるため、この期間内に個人あたり最大 20 セッション(Claude.ai、Cowork、および Claude Code にわたる)をランダムにサンプリングし、各セッションの組み合わせがその人の一般的な利用状況(各種プラットフォーム全体での利用)を反映するようにしています。サンプリングノイズを低減するため、5 セッション未満の利用者については回答者を除外しました。最終的にリンクさせたサンプルには約 9,700 名の調査回答者が含まれています。
私たちは、ほとんどの回答者が今後 1 年間にわたり AI の著しい進歩を期待していることを発見しました。人々の AI 能力に対する認識は、その人の経験や居住地、そして仕事が AI にさらされる度合いによって異なりますが、将来の進展速度に関する彼らの期待は驚くほど均一であり、「rising tide」(AI 能力が全体的に向上する状況)という概念と一致しています。
その進展が各自のキャリアに何を意味するかという見解は、必ずしも一様ではありません。キャリア初期の労働者は、AI が自分の業務の中で最も高い割合を担うことができると報告し、雇用喪失について最も懸念を示しています。しかし、一般的な懸念とは逆に、Claude への委任を最も多く行う人々が、将来の労働市場における成果に対して最も楽観的であり、自身のスキルの価値が高まっていると感じています。そして、AI の最前線に近いにもかかわらず(あるいはそのせいで)、平均的な回答者の次の十年間に対する希望は、代替ではなく協働に集中しています。彼らは AI が意味のある仕事を維持し、単調な作業を自動化することを望み、その成果が広く共有されることを期待しています。
経済指数調査に回答したのは誰か
経済指数調査は一般人口を代表するものではありません。私たちは Claude ユーザーの無作為なサンプルにアプローチしていますが、調査への回答者には選択バイアスが生じる可能性があり、分析からは頻度の低いユーザーを除外しています。図 3.1 は、調査回答者の職業構成(オレンジ色)と米国の雇用統計(灰色)を併せて示しています。コンピュータおよび数学関連の職種は最も過剰に代表されており、調査回答者の約 30% を占めています。これは Claude の利用シェアと同程度ですが、米国の雇用における 4% というシェアとは比較にならないほど高い水準です。管理職も回答者の 23%(注記 15)を占めており、その雇用シェアが 7% であることと比較して著しく過剰に代表されています。なお、管理職はセッション数の 4% にしか寄与していません。このギャップは、マネージャーが管理業務自体以外のタスクのために Claude を利用していることを示唆しています。調査では、判断力や管理能力について、多くの回答者(特に経験豊富な方)が AI が欠いている能力として挙げています。運輸・資材運搬、食品準備・サービス関連、建設・採掘といった物理的作業を伴う職種カテゴリーは、Claude のセッション内でも同様ですが、調査においても過小に代表されています。
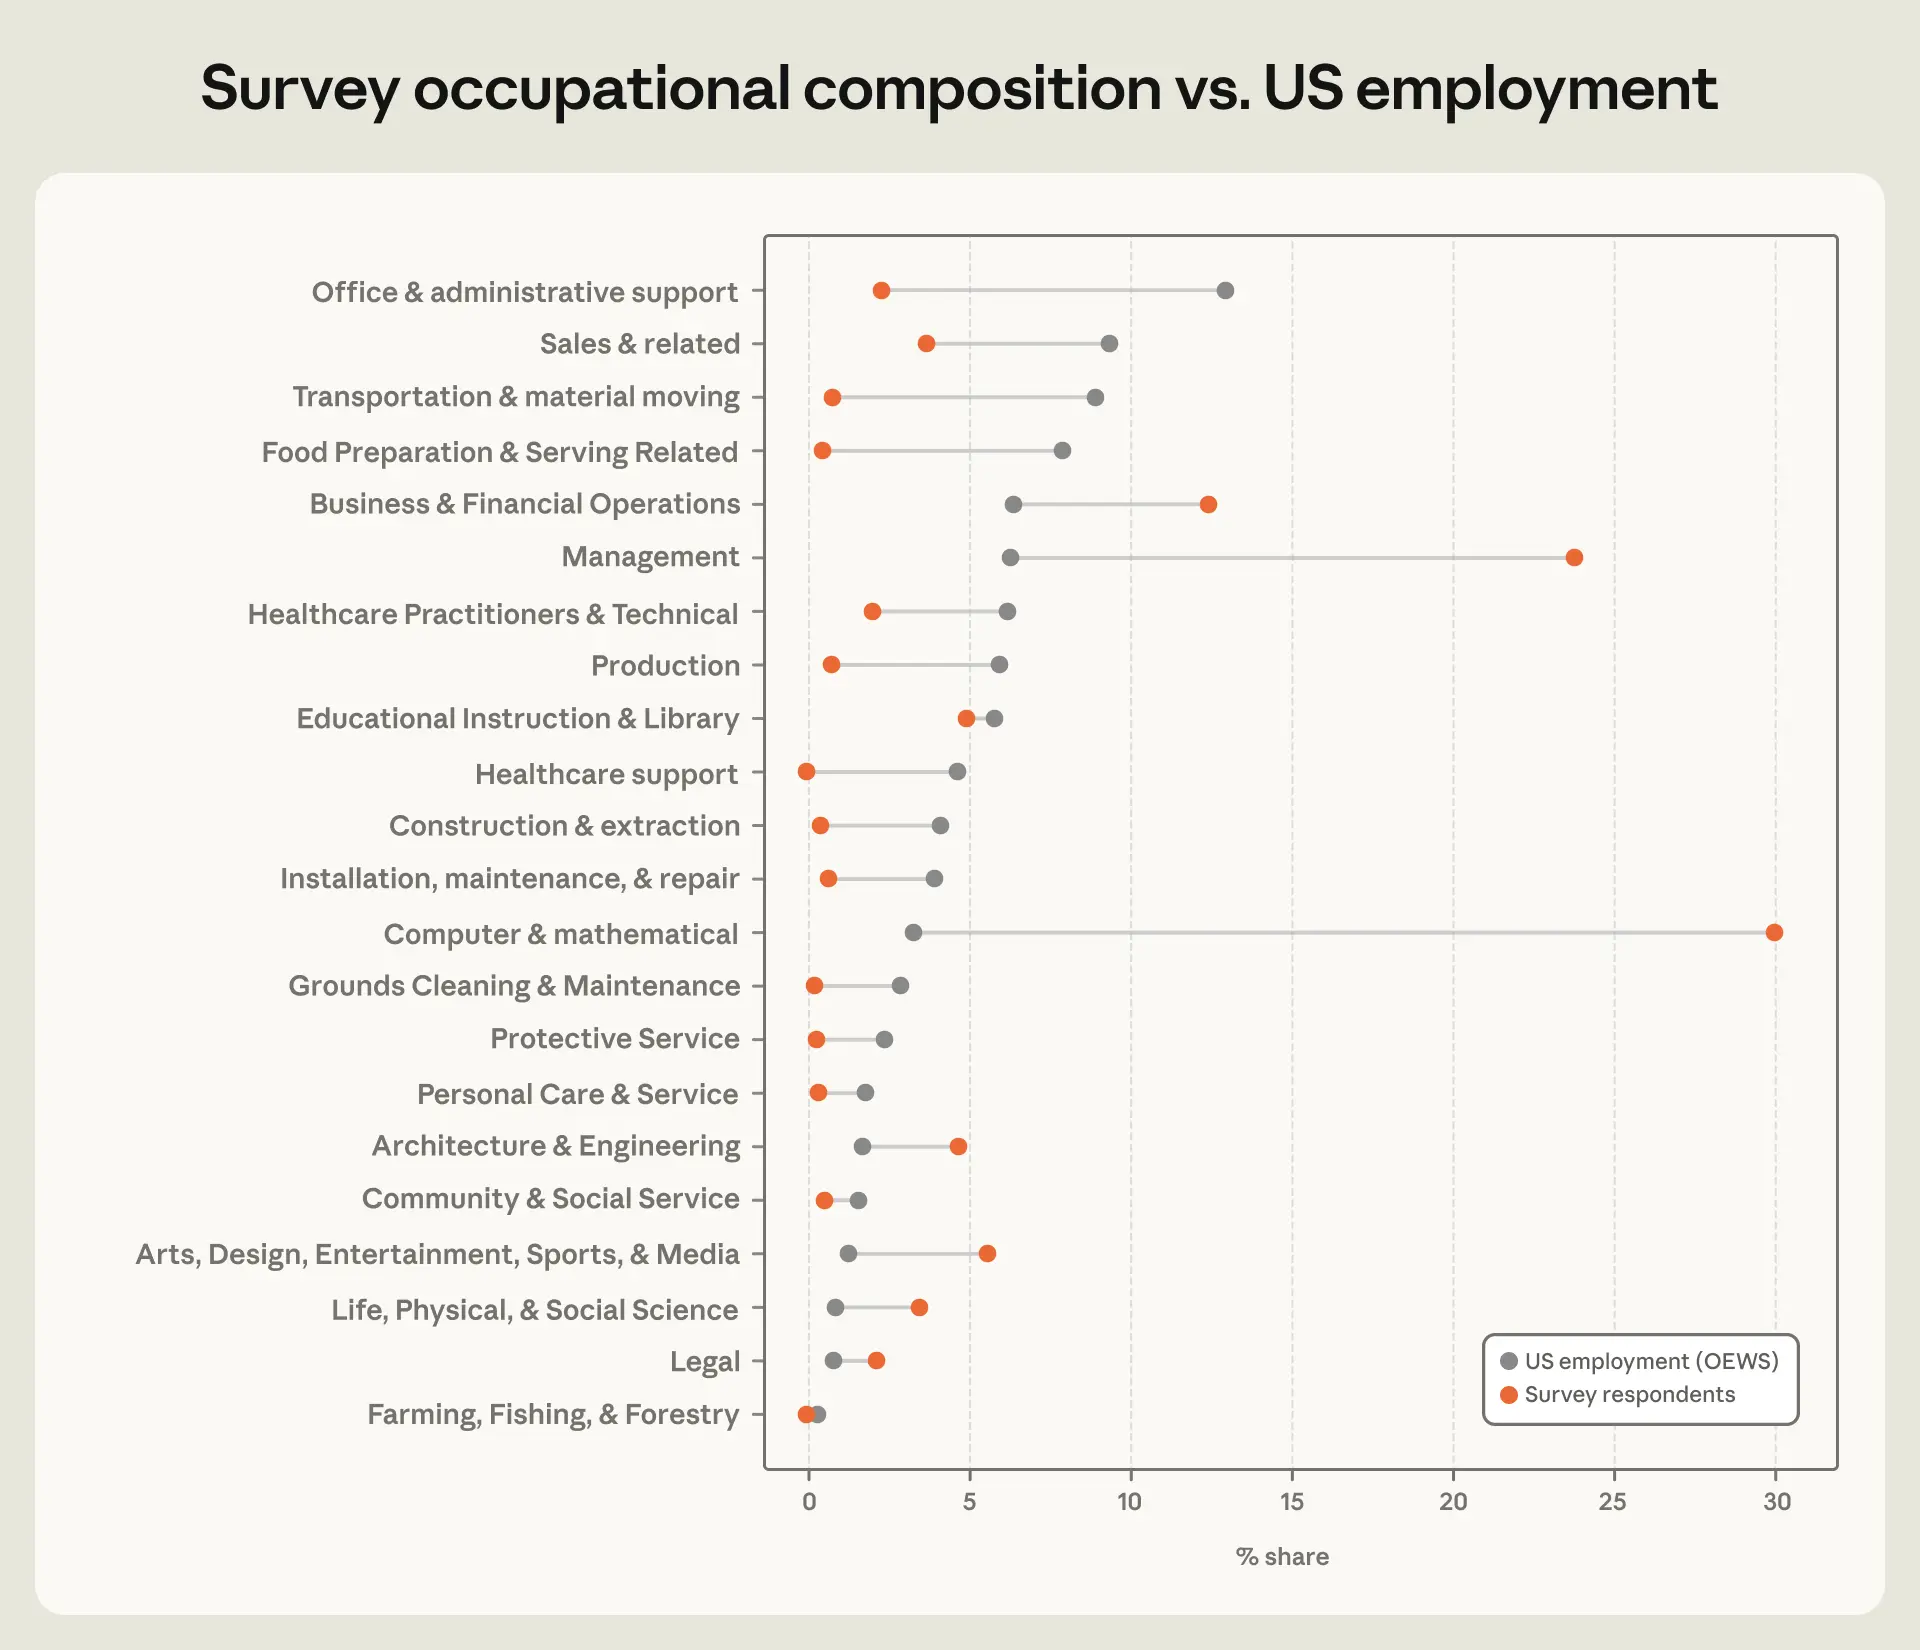 image図 3.1: *調査回答者は、米国の雇用統計と比較して、コンピュータ・数学および管理職に著しく偏っている
**各主要な SOC(標準職業分類)グループ 22 のうち、自身の職業を報告した調査回答者の割合。16 比較対象は、OEWS(Occupational Employment and Wage Statistics:職業雇用および賃金統計)に基づく各職業の米国雇用における割合。*
AI と業務タスク
AI の影響に関する研究は往々にして、職業への曝露度、つまり特定の職務内でどの程度のタスクが AI で実行可能かという点に焦点を当てています。過去の研究において、私たちは「観測された曝露度(observed exposure)」と呼ばれる指標を構築しました。これは、すでに Claude を用いて行われている職業タスクの割合を捉えたものです。これを、大規模言語モデルが理論上実行可能である職業タスクの割合を示す、一般的に使用される「理論的曝露度(theoretical exposure)」[1] と比較しました。
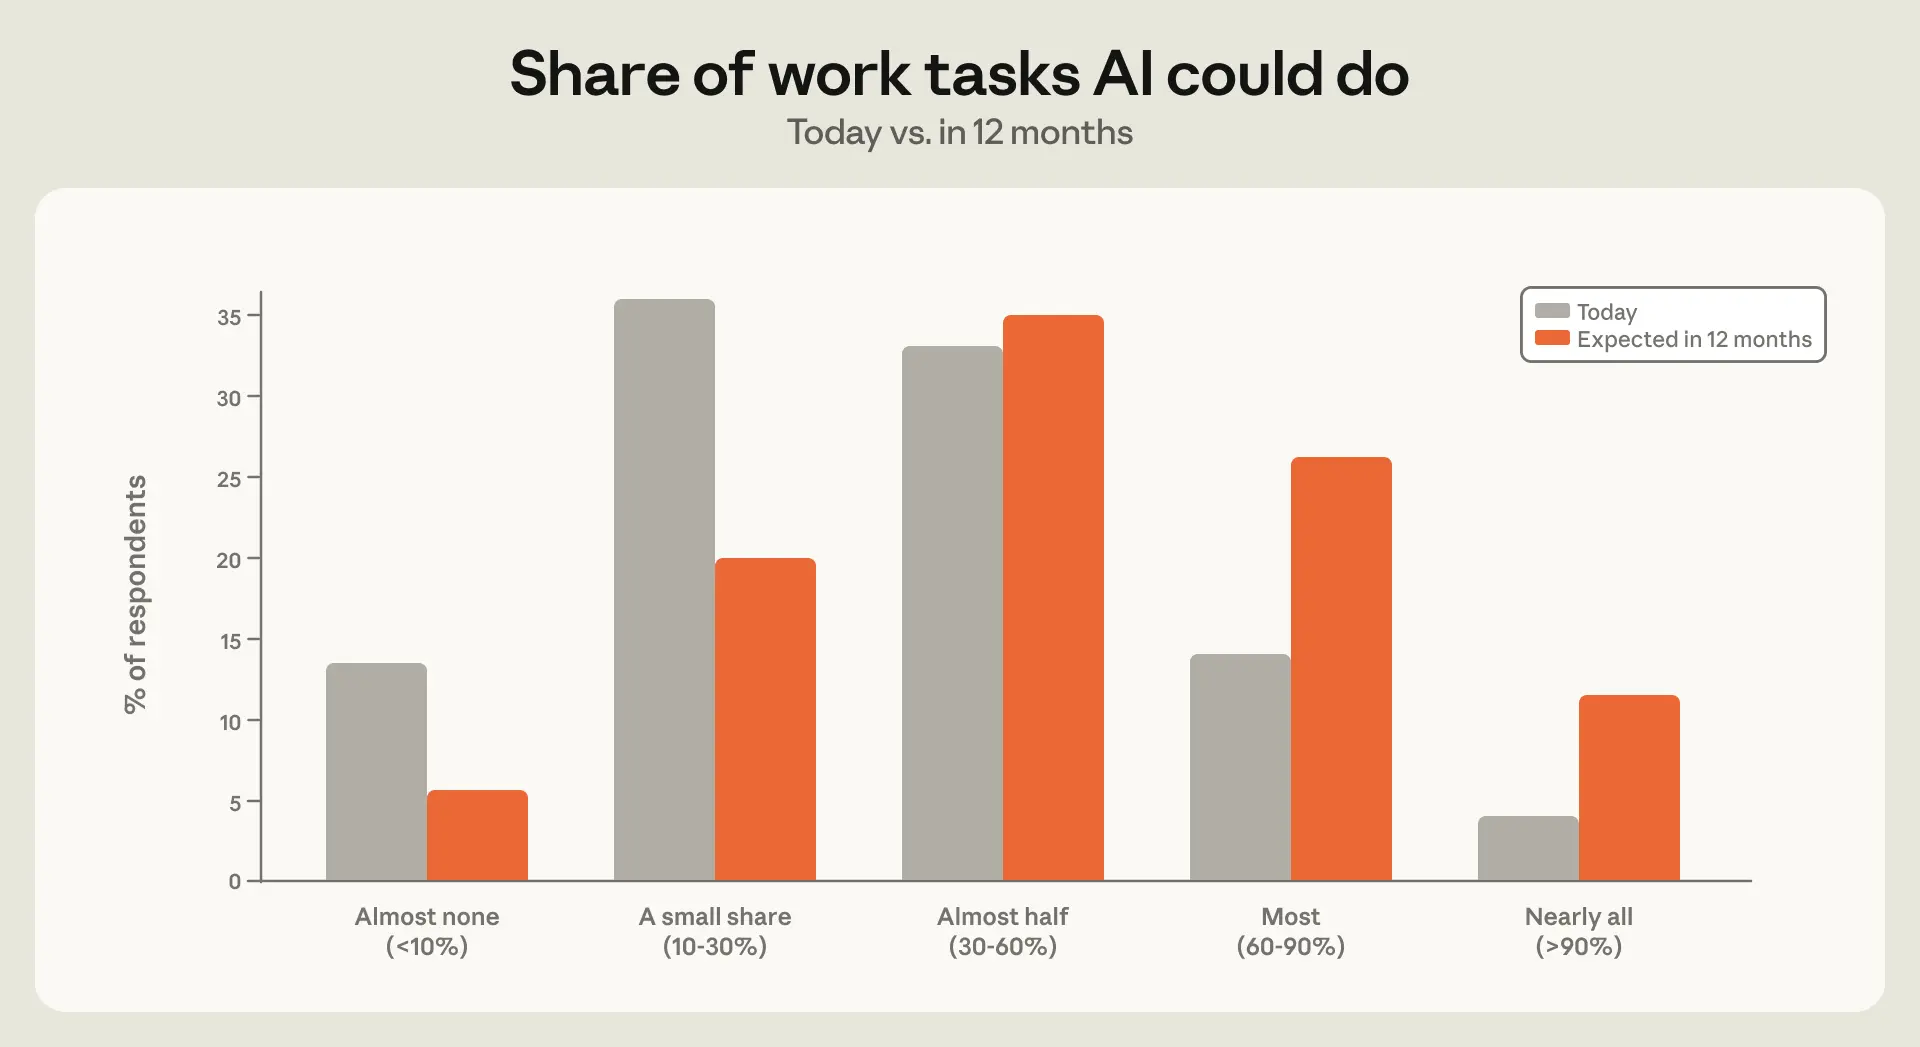
職業への曝露を理解する別の方法として、人々に「AI が現在の職務のどの程度を完全に遂行できるか」を直接尋ねるという手法があります。本調査では、回答者に対し、「今日において AI が独自に完全に処理できると考える業務タスクの割合(以下、報告された曝露)」と、「12 ヶ月後に AI が処理できると予想する割合(以下、予測される曝露)」について質問し、選択肢は「ほとんどない」から「ほぼすべて」までの 5 つの段階から選んでもらいました。回答者の約 6 割が、来年に対する評価を今日よりも高い段階で選択しました。また、3 分の 1 以上が、来年には AI が業務タスクの大半、あるいはほぼすべてを処理できると予想しています(図 3.2)。
 image図 3.2: *ほとんどの回答者は、今後 12 ヶ月間に AI が処理できるとする業務タスクの割合が増加すると予想しています
**この図は、回答者が「今日」と「12 ヶ月後」において AI が処理できると考える業務タスクの割合の分布を示したものです。*
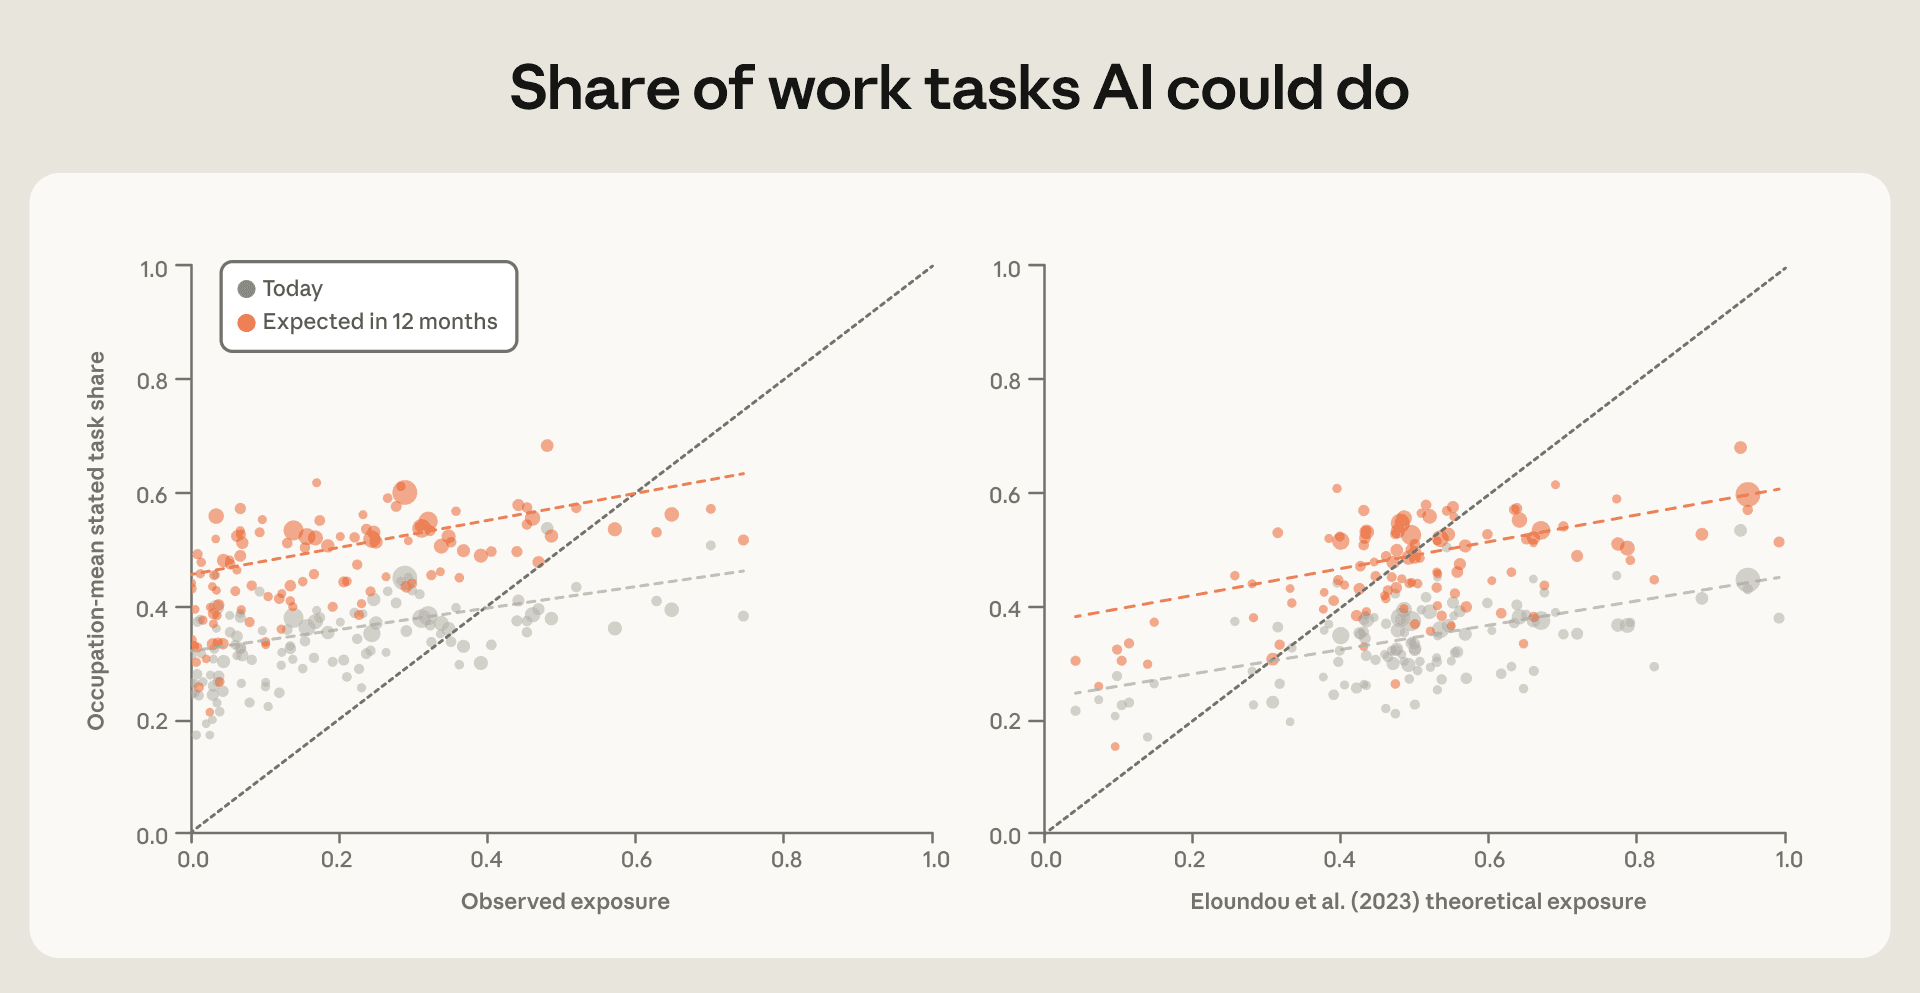
図 3.3 は、報告されたおよび予測されるエクスポージャーと、観測されたおよび理論的なエクスポージャーを比較しています。人々が報告し、AI に期待する能力が、職業全体にわたる観測値および理論的エクスポージャーの測定値と一致しているか、また観測値または理論的エクスポージャーのスコアが高い職業に属する回答者が、今後 1 年間でより急速な進展を予想しているかを問うています。最初の問いに対する答えは「はい」です:報告されたエクスポージャー(灰色の点)は、観測されたおよび理論的なエクスポージャーの両方と正の相関関係にあります。2 つ目の問いに対する答えは「いいえ」です:今後 12 ヶ月後の報告されたおよび予測されるエクスポージャーの最良適合線(オレンジ色の点)は実質的に平行であり、これは観測値または理論的エクスポージャーが高い役割の人々が、今後 1 年間に AI が担当できる業務タスクの割合について、観測値や理論的エクスポージャーが低い役割の人々とほぼ同じ*増加*を予想していることを意味します。17 つまり、ソフトウェアエンジニアと建設管理者は、それぞれの職業内でほぼ同程度の進展増を予測しています。
また、報告されたエクスポージャーが体系的に観測されたエクスポージャーを上回っている点にも注目に値します。これに対する一つの説明は、すべての人が職業内のすべてのタスクを行うわけではなく、当社の調査では AI をより多く使用する層に偏って回答者が集まっていることです。18 同様に、理論的エクスポージャーは現在の使用量の測定値ではなく、可能なことの上限であるため、報告されたエクスポージャーを体系的に過大評価します。
図 3.3:報告および予測されるエクスポージャーとその他の指標
人々が AI が今日できるというタスクの割合(報告されたエクスポージャー、灰色)と 12 ヶ月後(予測されるエクスポージャー、オレンジ色)を、観測されたエクスポージャー(左パネル)および理論的なエクスポージャー(右パネル)に対してプロットしたものです。各点は職業を表しており、サンプル数が少ない職業はプライバシー保護のため、エクスポージャーの近隣にある職業とグループ化されています。報告されたエクスポージャーと予測されるエクスポージャーは、調査回答者が選択したビンの中間値として計算されます。
また、AI の現在の能力と将来の能力に対する認識が、回答者の特性や利用パターンとどのように関連しているかも検討します。図 3.4 の左パネルは、AI の能力に対する認識が国の GDP と負の相関関係にあることを示しています:19 現在 AI が人々のために実行できると報告されるタスクの平均割合は、高所得国では約 10 ポイント低くなっています。このパターンは、先進経済圏で一般的に高い職業レベルでの曝露指標とは対照的に、AI が低所得国の労働者が日常的に行うタスクのより大きな割合を代替する可能性があるという仮説と整合しています。実際、IMF は 先進経済圏全体として広範な AI の曝露に直面している一方で、低所得国の労働者は、AI が彼らの仕事を代替するのではなく補完するために必要な相補的なスキルやインフラストラクチャーへのアクセスが限られている可能性があると指摘しています。以前の研究 では、タスクミックスの違いを調整しても、低所得経済圏では Claude がより自動化された方法で使用される傾向があることを文書化しました。
中央のパネルは、報告されたおよび予測されるエクスポージャー(曝露)が、労働経験年数と負の相関関係にあることを示しています。20 労働経験が少なくとも 15 年以上ある人々は、AI が実行できるタスクの割合を、職場での初年度の人々よりも約 10 ポイント低く見積もっています。この理由として、熟練した労働者が AI が模倣するのが困難な暗黙知や文脈固有の専門知識を蓄積している可能性があるという証拠を見出しました。フォローアップ質問では、人々に「AI が決して実行できないと考えるタスクとその理由」を尋ねました。最も一般的な回答は、AI には仕事に必要な判断力、文脈認識、状況推論が欠けていることを強調するものでした。また、回答者、特に労働経験が少なくとも 15 年以上ある人々は、信頼構築や人材管理といった、AI が再現できない仕事の対人的・関係的側面にも言及しました。
職業における AI エクスポージャーと同様に、AI の将来の能力向上に関する認識は、一人当たり GDP や労働経験年数と本質的に無相関であることがわかりました。12 ヶ月後に AI が実行できると予想されるタスクの割合は、現在の AI 能力に関する認識よりも一貫して高いものです。
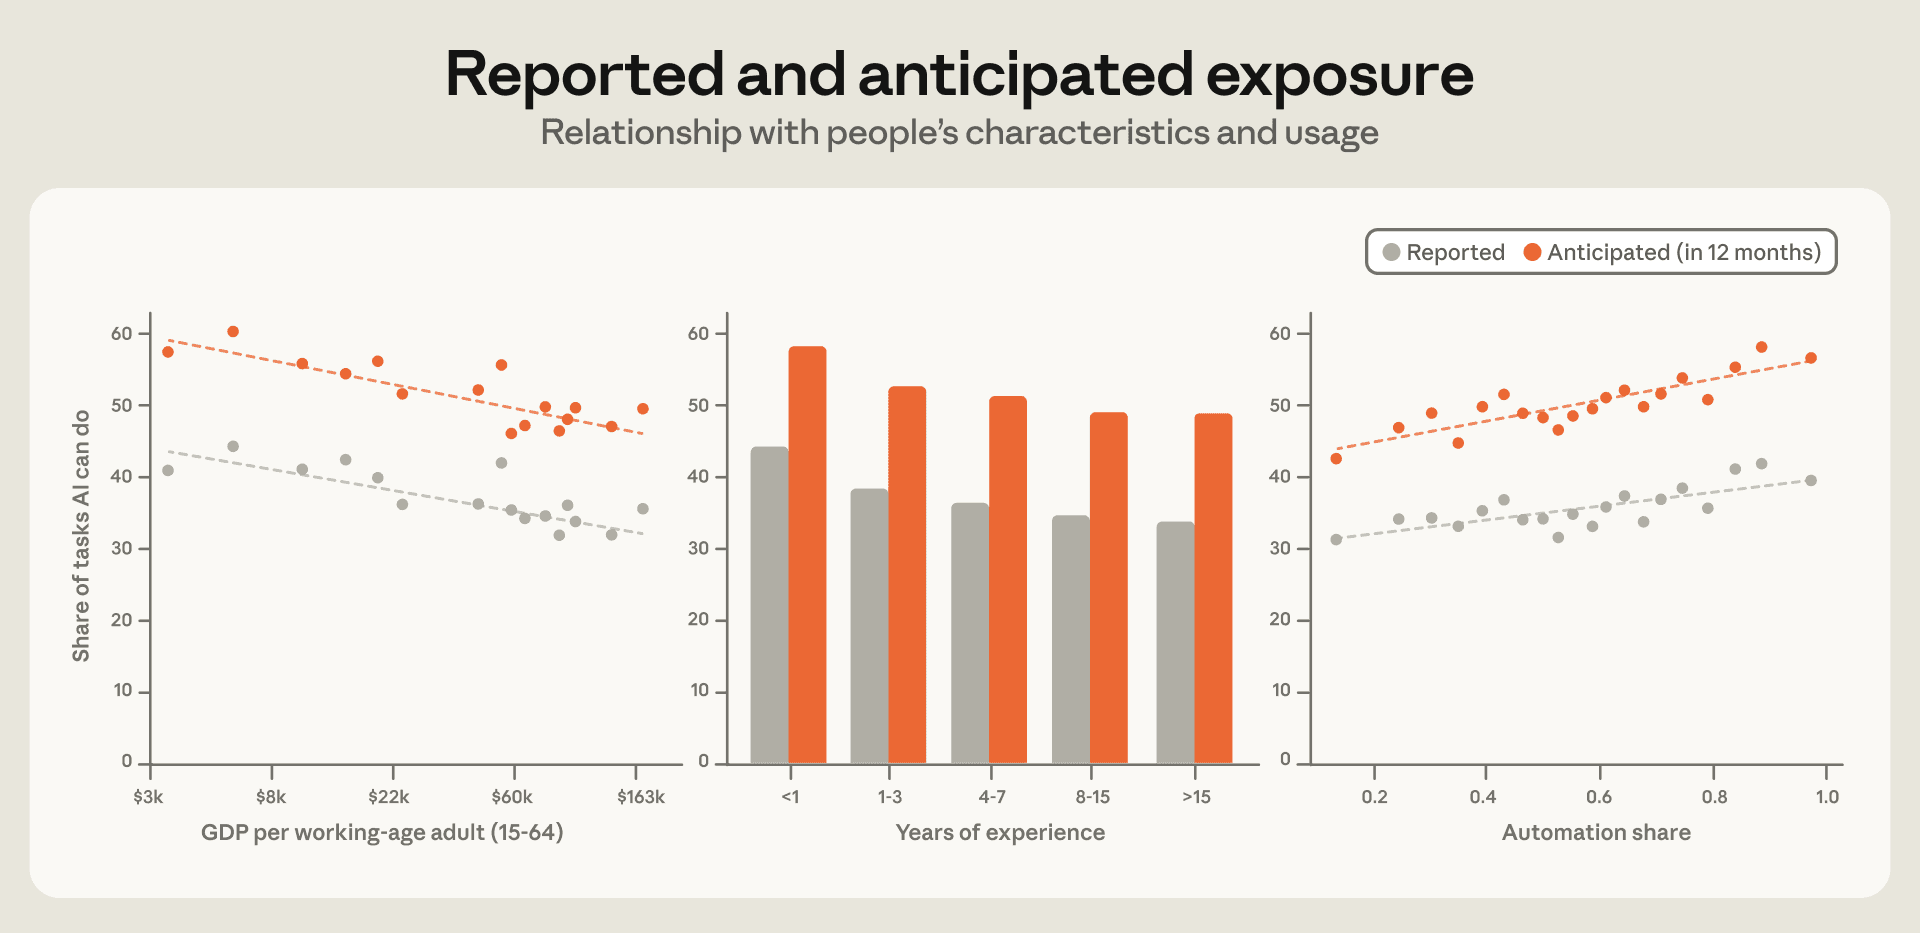 image図 3.4: 報告されたおよび予測されるエクスポージャーは、GDP(国内総生産)の高い国では低く、経験豊富な労働者層でも低く、Claude の自動化利用が増えるにつれて上昇します
**国ごとの 1 人あたり GDP(就労年齢成人基準)、経験年数、そして Claude セッションのうち自動化と分類される割合に対する、報告されたおよび予測される(12 ヶ月)エクスポージャーの対比。*
次に、人々が Claude とどのように相互作用するか、および現在の Claude の能力に対する認識との関係を検討します。過去のレポートと同様に、Claude と協力する際の「自動化(automation)」モードと「補完(augmentation)」モードを区別します。ユーザーからの入力や指示がほとんどない状態でタスクの完了を Claude に求める会話を「自動化」として識別します。具体的には、自動化シェアとは、「この文書を翻訳してください」のような指示型パターン、または「このメールを編集して…もっとカジュアルにしてください」のようなフィードバックループ型のパターンのいずれかである会話の割合として定義されます。21
図 3.4 の右パネルは、報告されたおよび予測されるエクスポージャーが自動化シェアとともに上昇することを示しています。これは、委任が能力について有益な情報となるから—すなわち、タスク全体を委譲する人々が AI が単独で何を実行できるかを直接観察するため—あるいは、すでに AI が自分の仕事を遂行できると信じている人々が最もそれを委譲する意欲が高いからである可能性があります。自動化シェアを、作業タスクに割かれたセッションのシェアや、Claude Code で実施されたセッションのシェアに置き換えても、同様のパターンが確認されます。22
AI と仕事
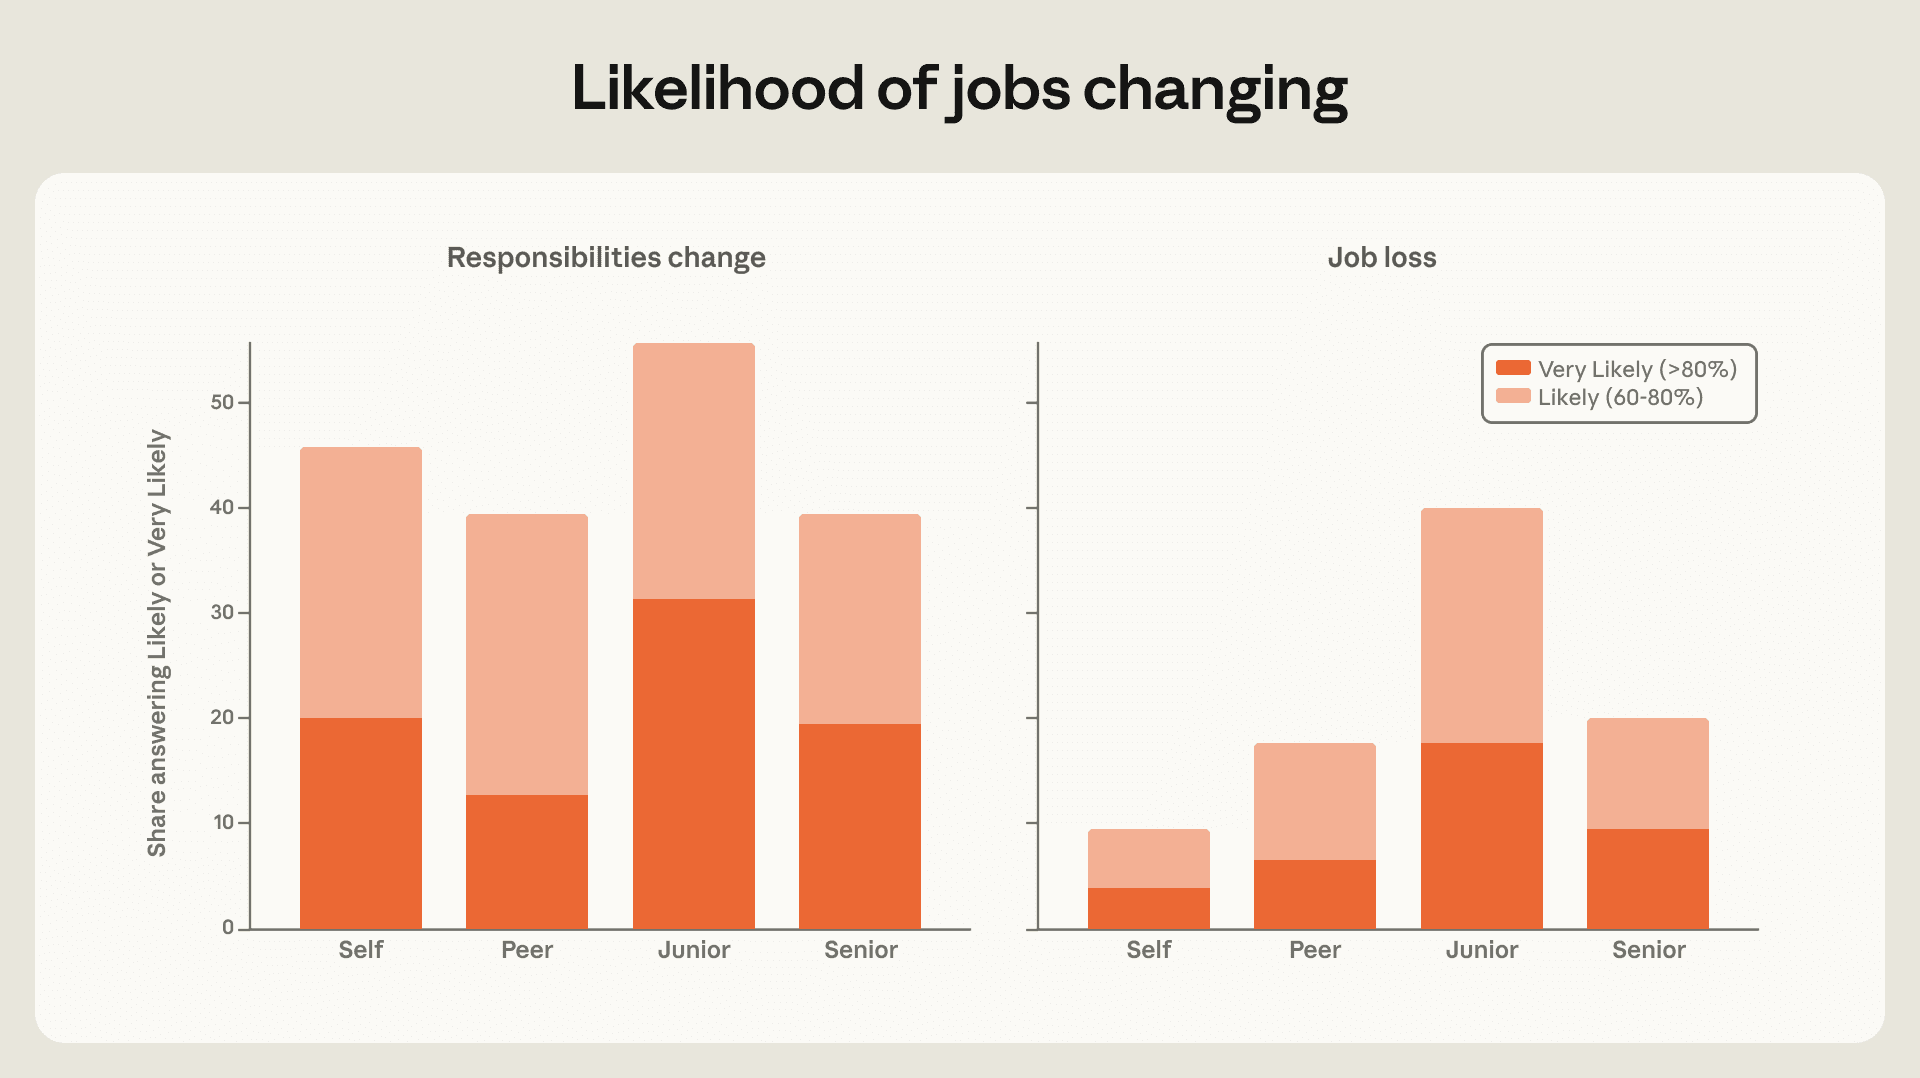
私たちはまた、人々が今後12ヶ月間に自分の仕事がどのように変化すると考えているかを尋ねました。回答者の3 分の 1 以上が、責任(自分自身、同僚、若手社員、そして上級社員にとって)が大幅に変化する可能性が高い、あるいは非常に高いと回答しました。10% の回答者が、自分自身の職を失う可能性が高い、あるいは非常に高いと評価しました。これは米国の失業の年換算リスク率よりわずかに低い水準ですが、当調査の対象者は安定した雇用にある知識労働者に偏っており(このグループは元来、平均以下の離職リスクに直面する可能性が大きい)、この結果は依然として高まった認識上のリスクを示している可能性があります。何が予測を駆動しているかという自由記述の質問に対して、自分自身の職を失う可能性が高い、あるいは非常に高いと評価した回答者の 38% が、その予測の原因を AI に起因すると回答しました。24值得注意的是,回答者は平均して、自分自身よりも他人の失業についてより心配していました。25特に若手社員の失業について懸念が強く、回答者の 3 分の 1 以上が、今後 1 年以内に若手社員が職を失う確率は 60% を超えると回答しました。また、回答者は低所得国における(すべての人に対する)失業についてもより懸念を抱いていました。
 image図 3.5: *来年、職務内容が大幅に変更される可能性が高い、あるいは望まない形で仕事を失う可能性が高いと回答した人の割合
**回答者が、自分自身、同僚、後輩、上司のいずれについて、「来年、職務内容が変更される可能性」または「自分が守りたいと思う仕事を失う可能性」があると回答した割合(左パネル:職務内容の変更、右パネル:望まない仕事の喪失)。*
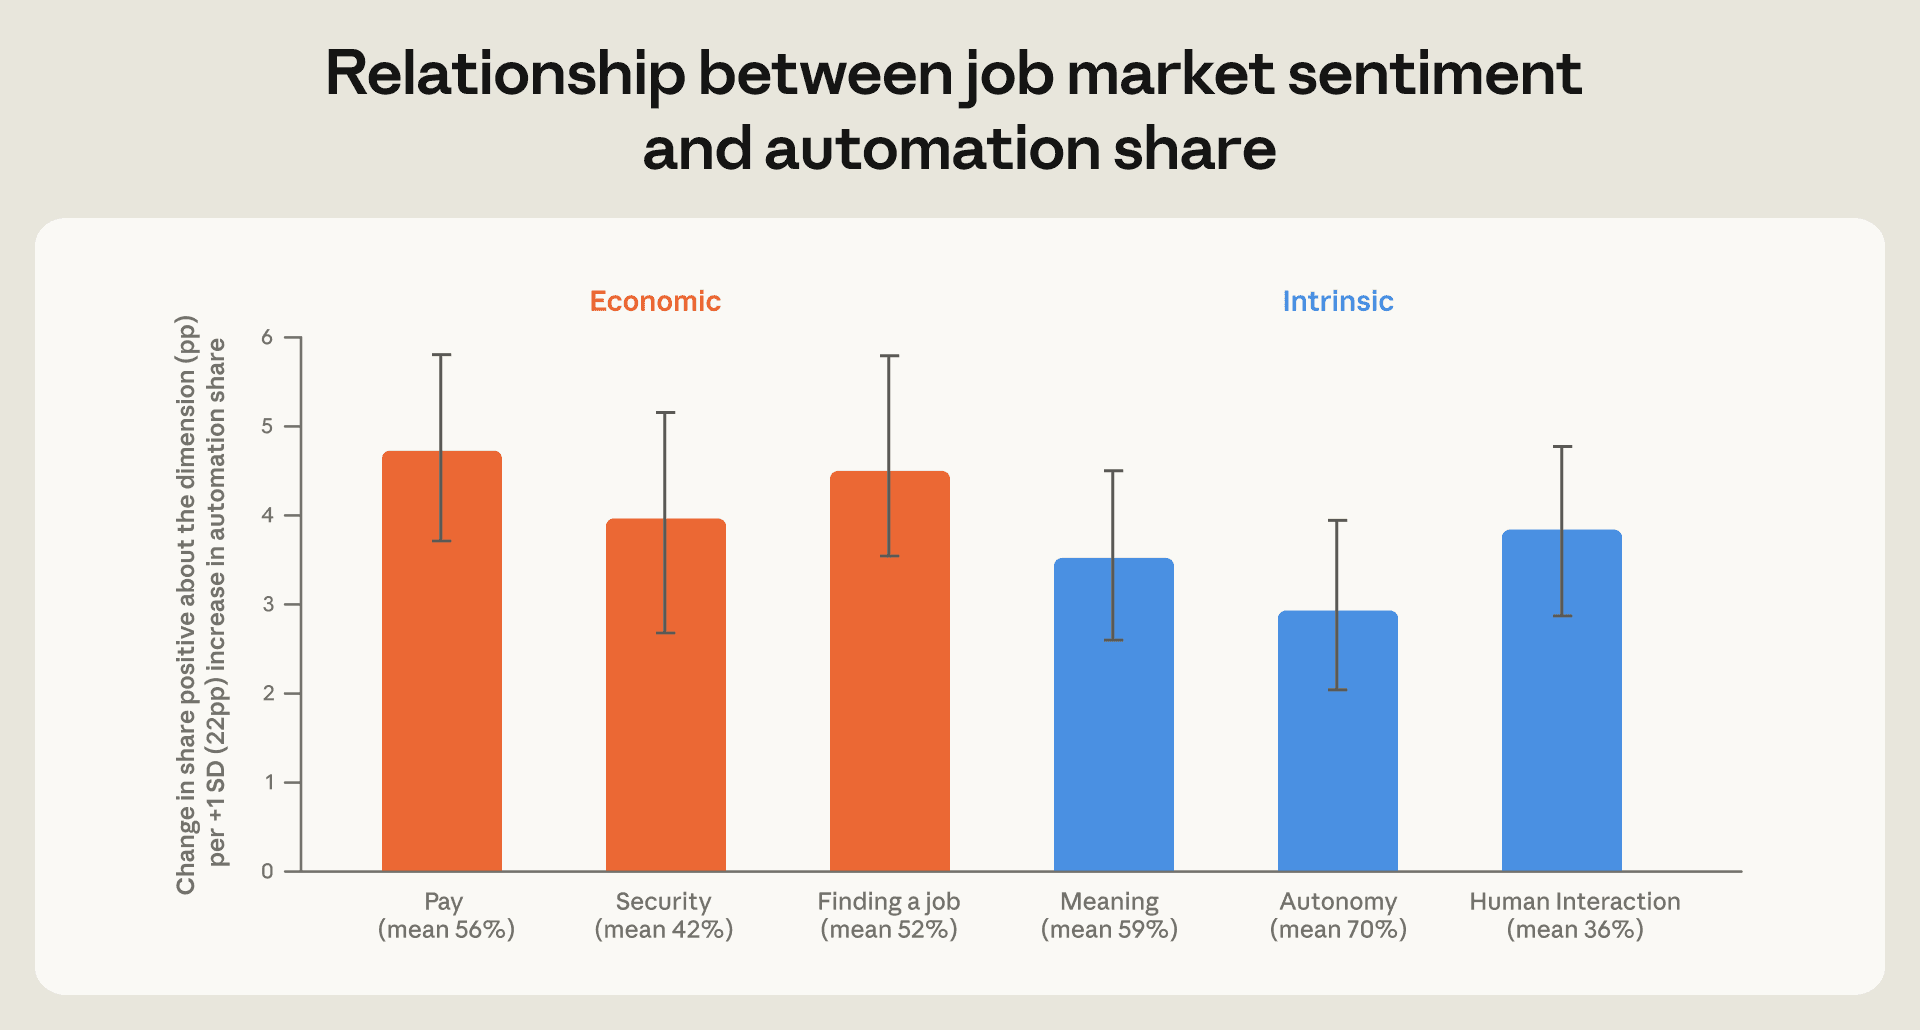
Claude をより自動化された方法で利用する人々は、仕事への不安も大きいのでしょうか。私たちは、来年の AI が仕事に与える影響について、6 つの次元(給与、雇用保障、新しい職を見つける能力という経済的次元と、意味、自律性、人間関係という内面的次元)において人々がどのように語ったかを検討し、Claude の利用における自動化の割合によってこれらの期待がどう異なるかを探ります。
すべての 6 つの次元において、自動化セッションの割合が高い人々は、より増強型に Claude を利用する人々に比べて、来年の AI が仕事の結果に与える影響について*より楽観的*であることがわかりました。特に将来の給与や新しい職を見つける能力に対するポジティブな影響に関する期待において、最も大きな効果が観察されました。26
 image図 3.6: *AI が仕事の質の経済的次元と本質的次元に与える肯定的な影響を報告する人の割合は、Claude の自動化利用率が高い層で高い
**この図は、各人が AI が仕事の質の 6 つの次元それぞれに対して肯定的な効果をもたらすと予想しているかどうかを示す指標を、正規化された AI 自動化シェアに対して線形回帰した結果から得られた係数推定値を示しています。*
自然な疑問として、なぜ自動化利用率と感情が連動して動くのかという点があります。この関係は選抜バイアスによって説明可能であり、AI に最も熱心な人々が、タスク全体を AI に委ねることに最も意欲的である可能性があります。これを完全に否定することはできませんが、ユーザーの Claude.ai での在籍期間(これは早期採用者と後期採用者を捉えるため、熱心さの代理変数とみなせます)を統制しても、これらの推定値は実質的に変化しません。
もう一つの可能性としては、AI をより自動化された方法で使用している人々が、今日においてその恩恵をより多く受けているというものです。私たちの 以前の調査結果 と一貫して、生産性の向上(作業速度、範囲、品質の観点から)を報告する人が多数派を占めており(それぞれ 86%、82%、69%)、また 27% の人が、本来購入する必要があったサービスにおけるコスト削減を通じて恩恵を受けていると回答しています。
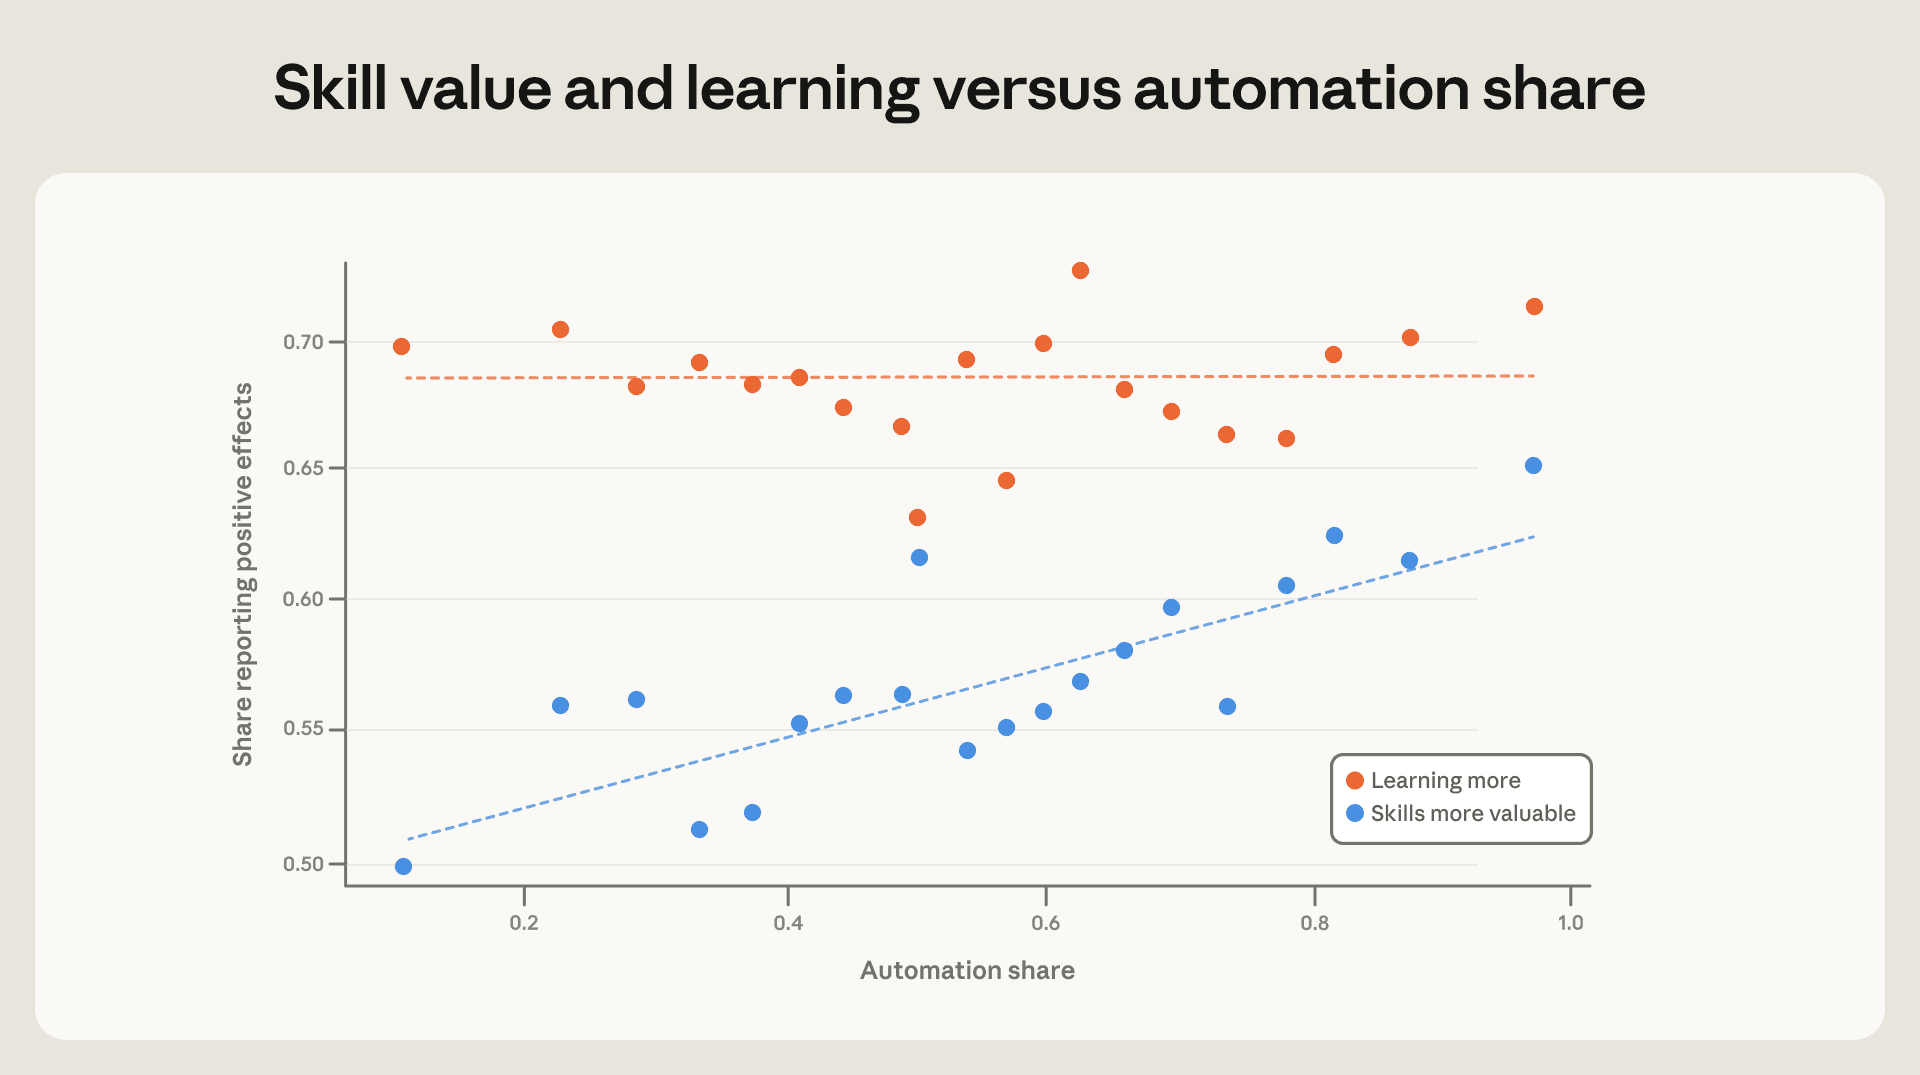
顕著な生産性向上に加え、過半数の人が AI を通じてより多くのことを学んでいる(68%)と感じており、AI が自身のスキルをより価値あるものにしたと感じている人もいます(57%)。図 3.7 は、これら二つの成果が自動化セッションの割合とどう関連するかを示しています。自動化シェアが高まるにつれて、AI が市場におけるスキルの価値を高めると報告する人の割合が増加している一方で、より多く学んでいると報告する人の割合はほぼ横ばいであることがわかります。
委任に関する一般的な懸念として、「タスク全体を AI に任せることは思考の放棄を意味し、出力の向上が学習やスキルの劣化という代償を伴う」という声があります。しかし、ここではそのようなパターンは見られません:より多く委任する人々は、他のすべての人と同様の速度で学んでいると報告しています。ただし、これらは自己評価に基づくものであり、スキルがより価値あるものとなり、本人もより多くのことを学んでいると報告している最中であっても、スキルは劣化し得るため、データがスキルの劣化を完全に否定するものではありません。
図 3.7:*自動化率が高まるにつれて、自身のスキルに正の期待収益があると回答する人の割合は増加しているが、より多くを学んでいると回答する人の割合は横ばいである*
この図は、タスクの自動化率と、AI が自らのスキルの市場価値を高めると回答する人の割合(青)および AI を使用することでより多くを学ぶと回答する人の割合(橙)との関係を示している。
<h3 id="how-usag
原文を表示
Introduction
One year ago, most Claude usage took the form of a conversation between a user and an assistant. With the rapid growth of Claude Code and Cowork, Claude sessions now increasingly consist of long-running agentic tasks. Chat transcripts no longer fully capture how people are using AI, and our methods for studying Claude’s economic impacts have had to adapt.
To keep pace, we made several changes to our data pipeline for the Economic Index. In this version, we:
- Sample data at a higher rate, allowing us to view usage patterns down to the hourly level.
- Introduce a new classifier that labels the output of each conversation.
- Share more granular data, breaking out results for chat and Cowork conversations (together, “Claude conversations”) and the 1P API, aggregated at a monthly level.1
We describe additional methodological changes in the Appendix. Together, these changes provide a clearer picture of how AI mirrors and diffuses into economic life.
In addition, we’ve previously lacked visibility into Claude’s impact *outside* of user sessions. How do people perceive AI to be changing their work, or the opportunities available to them? Does their usage of AI shape their expectations? In an ideal world, what would they want from AI? We report initial findings from the Anthropic Economic Index Survey, launched in April 2026.
We preview our main findings below.
- In Chapter 1, we show how the rhythms of the external world shape Claude usage. Work-related queries subside on the weekend, though less dramatically in the most highly paid occupations; people tend to ask for the news in the morning, and sleep advice peaks around 5 a.m.; tax-related requests surge around filing deadlines.
- Chapter 2 explores the concrete outputs that people take away from their Claude sessions. These are highly dependent on what product they’re using. Chat and Cowork provide more explanations than Claude Code, for example. The nature of the output also shapes people’s interactions with Claude. Building a website leaves much more to Claude's judgment than translating a document, where the answer is largely determined by the text. We also see that more compute is associated with more valuable artifacts; the tokens a given output consumes rise with the estimated value of the work.
- Chapter 3 presents the first results from the Anthropic Economic Index Survey, which we link to Claude usage data through our privacy-preserving system. Expectations and experiences vary systematically with how people use Claude: people who use Claude in the most automated way expect AI to take on more of their tasks in the next year, yet feel the most optimistic about what that means for their work, anticipating positive impacts on pay, job security, and meaning.
Our new privacy-preserving telemetry, which continuously samples a slice of conversations every day, allows us to study daily and hourly patterns in usage, in contrast to the seven-day samples each previous Economic Index report drew on. These analyses capture ebbs and flows in work patterns around the world.2
We find that Claude usage mirrors the workweek, with personal prompts spiking on the weekend. The hourly data captures within-day patterns—people most often ask for sleep advice around 5 a.m. and for recipes around 6 p.m. We also see usage reflecting key dates. For instance, tax-related requests surged just before the US filing deadline on April 15.
The workweek
The share of chat and Cowork3 conversations categorized as personal use spikes from around 35% on weekdays to just under 50% on weekends during the sample period (Figure 1.1). Outside the workweek, users’ conversations shift from business correspondence, marketing copy, and slide decks to emotional support, medical questions, and investment advice. This shift is biggest for high-income countries.
Figure 1.1: Personal conversations increase on the weekendDaily share of conversations that are personal use across [Claude.ai, Claude Desktop, Claude Code, and 1P API. Saturday and Sunday are shaded grey.](https://www.anthropic.com/_next/image?url=https%3A%2F%2Fwww-cdn.anthropic.com%2Fimages%2F4zrzovbb%2Fwebsite%2F153b647190951536f59f8051f4470c0b6216b2ad-1920x1075.png&w=3840&q=75)
A similar pattern is present in Claude Code and the 1P API traffic (i.e., API traffic routed directly through Anthropic), though both have lower baseline rates of personal use.4
Request clusters5 allow us to go one level deeper and see which specific Claude Code tasks swing most between weekdays and weekends. On weekends, the Claude Code usage clusters that fall the most include backend architecture, API debugging, and data storage. Those that increase the most include AI agent design, quant trading, and gaming.
Weekends may also create space for people to pursue new ventures. Across countries, conversations related to starting a business are highest on Saturday and Sunday. However, job application activities drop on the weekend along with other work-related tasks.6
Daily rhythms
Hour by hour, Claude usage reflects the rhythms of daily life. Figure 1.2 shows the hourly frequency of different request clusters relative to their overall average in global traffic.7
People ask for news at 7 a.m. local time. Business correspondence (e.g., email drafting) traces the arc of the workday, with a slight peak at 10–11 a.m. One of the biggest spikes is recipe requests, which are 2.3 times more frequent at 6 p.m. compared to the average. Media recommendations are most concentrated in the evening, while people seek sleep advice in the few hours just before dawn.
On nights and weekends, when people do turn to Claude for work, the tasks skew toward higher-wage occupations (Figure 1.3). While we can't conclusively identify the jobs of the people making these requests, this could reflect the fact that people in higher-paying occupations—like marketing managers or computer programmers—are more likely to work outside traditional hours. In contrast, tasks related to jobs in the bottom two quartiles—like telemarketing and clerical work—fall to a smaller share of total conversations. This pattern isn't driven exclusively by computer and mathematical tasks: when we removed those occupations from the analysis in a robustness check, higher-quartile tasks still increased on nights and weekends.
Tax day
The sample period for this report covers tax filing deadlines for people in the United States. Figure 1.4 shows a large spike in the share of tax-related conversations around the deadline. On April 14, tax-related clusters were eight times as common as on the average day in May and remained about as high on April 15. On April 16, they dropped sharply.
Artifacts
In this chapter, we classify each conversation on chat and Cowork (hereafter “Claude conversations”)8 by its artifact, which we sort into more than 30 categories. We refer to the primary output Claude produces in a conversation—a document, an explanation, a piece of code, an academic paper, and so on, whether presented in a chat window or as a separate document—as an artifact. The full list of artifacts is in the Appendix.
Our classifier identified 93% of Claude conversations as producing an artifact (Figure 2.1).9 The most common artifacts are explanations (17% of conversations), documents and reports (15%), and guidance (11%). Conversational outputs (like explanations or guidance) and written deliverables (like documents or presentations) each account for about a third of conversations; code and technical work (like apps or scripts) for about a sixth.
What an output is doesn't tell you what it's for: the same artifact could be a work deliverable or a personal project. We look at that split next.
What is each artifact used for?
Our January Economic Index introduced a primitive that classifies each conversation as work, personal, or coursework. Here, we apply that split to the artifacts produced in Claude conversations (Figure 2.2).
Some categories of artifacts are almost always personal. More than 80% of conversations producing creative writing, guidance, and recipes were classified as personal. Within categories, the personal and work-related uses can look quite different. Personal creative writing, for instance, is dominated by fanfiction, worldbuilding, and poetry; the 13% that is work-related is mostly in the form of short-form video scripts, screenwriting, and speeches. Categories most likely to be work-related include creating marketing content (80%), creating blogs or articles (81%), and writing database queries (82%).
Many outputs are equally likely to be used for personal and work reasons, including creating plans or strategies (44% work-related, 49% personal) or translation (42% work, 44% personal). For example, the most common types of personal planning artifacts include travel itineraries and workout schedules, while work-related plans most often pertain to entrepreneurial or content strategies.
Finally, artifacts that are characteristic of coursework include creating academic papers and theses, educational materials, and math-related queries, though a non-negligible share of each falls into both work and personal categories.
We can also flip the question. Instead of asking what each output is used for, we can ask what sort of artifacts work, personal, and coursework conversations each tend to produce. Work conversations most often produce documents and reports (20%), followed by explanations (9%), email drafts (7%), and analyses and summaries (6%). Coursework conversations look broadly similar, with documents and reports leading there too (21%), closely followed by explanations (20%), educational materials (11%), and academic papers (6%). In contrast—and unsurprisingly—only 6% of personal conversations produce a document. Instead, the most common results are explanations (25%) and recommendations (22%).
Cost tracks the value of work
Producing these outputs requires compute, and we find that compute tends to scale with the value of the work. We measure each conversation's computational costs in tokens—the amount of text processed and generated, including Claude's internal reasoning—and compare across occupations by mapping each conversation's classified task to the occupation that typically performs it. Throughout this section, we restrict our analysis to work-related conversations.
The left panel of Figure 2.3 shows a positive relationship between the median conversation-level number of tokens and the median wage in mapped occupation.10 For example, marketing managers earn roughly twice as much as editors ($80 vs. $37 per hour) and conversations mapping to their tasks consume approximately 2.5 times as many tokens. Admittedly, the relationship is noisy, and there are notable outliers. Pharmacists, for example, earn nearly three times what statistical assistants do ($68 vs. $24 per hour), yet conversations mapped to pharmacist tasks use only about one twentieth as many tokens.
The tokens consumed to generate different types of artifacts tell a similar story. More complicated and valuable outputs tend to consume significantly more tokens than simpler outputs. For example, conversations about building apps use more than three times the tokens of the median conversation. On the other end of the spectrum, a typical explanation uses about a fifth of the tokens of the median conversation. About 44% of the wage gradient in token consumption is explained by output mix—higher wage occupations are more likely to produce compute-intensive artifacts.
Why does this matter economically? In conversations mapped to higher-wage occupations, Claude produces more (1.34 times as much output per turn), while users engage more (1.53 times as many turns) and enable extended thinking more frequently (34% of conversations versus 31%; Table 2.4). Crucially, these move together: more production from Claude does not mean less from the user. If the human remains involved in the highest-value tasks, the pattern looks more labor-augmenting than labor-displacing. It also shows that, to some extent, more valuable outputs cost more. The next section examines how much of the decision-making within each conversation is delegated to Claude.
How much autonomy does Claude have to decide on its own?
We measure this on a 1-5 scale, from "none" to "extreme.” Tasks that are easy to describe or specify involve little autonomy: the lowest-autonomy outputs are math or calculations, translations, and Q&As. High-autonomy tasks are those that require selection among many possible choices, e.g., creating apps and websites, games, or presentations. Such work, which requires sustained judgment, has historically been difficult to automate. By comparing the level of autonomy in Claude chat and Cowork to Claude Code, we show that this is starting to change.
Across almost all types of outputs (26 of 31 outputs shown) the level of AI autonomy is higher on Claude Code than chat or Cowork.11 For example, conversations producing scripts and code snippets involve 0.53 points more autonomy (on average, on the 1-5 scale) when created with Claude Code than conversations producing the same output on chat or Cowork. Across all conversations, the average difference in autonomy is 0.37 points, and it has two main sources.12
Approximately two thirds of the difference is explained by the same tasks being executed with more delegation on Claude Code. Blog posts and articles illustrate this: the requests and tasks behind them are similar on the two surfaces, but the way people work with Claude differs sharply. The median chat and Cowork conversation producing a blog post or an article involves 13 rounds of back-and-forth, while the median blog-producing Claude Code session contains a single human prompt. The remaining third reflects the different mix of output types across the two surfaces.
One might suspect this difference simply reflects model choice. Claude Code sessions run on the most capable models far more often (54% are served by Opus, against 10% of chat and Cowork conversations). However, the gap persists when we compare conversations served by the same model. For example, among conversations using Sonnet, Claude Code sessions still show 0.26 points more autonomy, suggesting that the product used is likely more important than the underlying model.
Stepping back from the surface comparison, the output types where users delegate the most are the same ones that consume the most compute: across artifacts, mean autonomy and median token use rise together (r = 0.68 on chat and Cowork; Appendix Figure A.2).
Claude answers above the level it was asked
For each conversation, a classifier estimates two reading levels—one for the user’s prompt, one for Claude’s response—expressed as the years of education needed to understand the text.13 We find that reading level varies widely depending on artifact type. An average query resulting in an academic paper would require more than 16 years of education, roughly equivalent to bachelor’s level, and 15% of these conversations are at PhD level or above (20 or more years of education). On the other end of the spectrum are conversations resulting in recipes or guidance, where fewer than 10 years of education are required to understand the prompt.
In general, artifact types with higher-reading-level outputs also have higher-reading-level prompts (a correlation of 0.87 across conversations). However, we also observe that in almost every category, Claude’s output is at a higher comprehension level than the prompt, by roughly one year of education on average. The gap is widest where users describe something to be built, such as image and graphics (+2.6 years), games (+1.9), and apps and websites (+1.7). Some of the gap may simply be register; prompts are often terse and informal, while Claude tends to reply in polished prose. However, the gap is near zero for audience-facing writing (blogs −0.1, academic papers +0.0, email +0.3), possibly because prompts typically draft language or source material written in the same register as the intended output.
Perceptions
The first two chapters show how people use Claude, but don’t give much insight into the ways people experience AI at work—how they expect their jobs and workplaces to change, how they feel about AI’s current and potential impact, and what they hope for from the technology. Our interviews with 81,000 Claude users, conducted in December 2025 with Anthropic Interviewer, gave a picture: respondents reported large productivity gains, but also expressed worry about displacement. Those worries were concentrated among early-career workers and occupations where we observe Claude doing the most work.14
In April 2026, we launched the Anthropic Economic Index Survey to build on this work. The survey allows us to ask people directly about their experience with AI and work, and to explore how responses vary with Claude usage. We link survey responses to usage data from mid-May to early June using privacy-preserving methods. To characterize each respondent's usage patterns, we randomly sample up to 20 sessions per person within this time window (across Claude.ai, Cowork, and Claude Code, so that the mix of sessions reflects each person's typical usage across surfaces). We exclude respondents with fewer than five sessions to reduce sampling noise. Our final linked sample consists of about 9,700 survey respondents.
We find that most respondents expect significant AI progress over the next year. While people’s perception of AI capabilities depends on their experience, where they live, and how exposed their job is to AI, their expectations about the pace of future progress are strikingly uniform, consistent with a “rising tide,” in which AI capabilities improve broadly.
Views on what that progress means for their own careers are less uniform. Early-career workers report that AI can do the highest share of their work and express the most concern about job loss. Yet—contrary to a common concern—the people who delegate to Claude the most are the *most *optimistic about their future labor market outcomes, and feel their skills are growing in value. And despite (or perhaps because of) their proximity to AI's frontier, the average respondent’s hopes for the next decade center not on replacement but on collaboration. They hope AI can preserve meaningful work and automate the drudgery, and that its gains will be shared widely.
Who responded to the Economic Index Survey
The Economic Index Survey is not representative of the general population. We reach a random sample of Claude users, there may be selection in who completes the survey, and we filter out infrequent users from our analysis. Figure 3.1 shows the occupational mix of survey respondents (orange) alongside US employment (grey). Computer and Mathematical occupations are the most heavily over-represented, making up roughly 30% of survey respondents—comparable to their share of Claude usage, but far above their 4% share of US employment. Management, at 23% of respondents,15 is also heavily over-represented relative to its 7% employment share, even though it accounts for only 4% of sessions. This gap is consistent with managers using Claude for tasks other than management itself: in the survey, judgment and management are named by many respondents (especially those with more experience) as capabilities AI lacks. Physical occupation categories like Transportation & Material Moving, Food Preparation & Serving Related, and Construction & Extraction are all under-represented in the survey, as they are in Claude sessions as well.
AI and work tasks
Research on AI impacts often focuses on occupational exposure, or what share of tasks within a given job are doable with AI. In prior work, we constructed a measure of *observed exposure*, which captures the share of occupational tasks we already see being done with Claude. We compared it to a commonly used measure of theoretical exposure, or the share of occupational tasks that a large language model could theoretically do.
Another way to understand occupational exposure is to simply ask people how much of their job AI is capable of doing. We asked respondents what share of their work tasks AI could do entirely on its own today (hereafter *reported exposure*), and what share they expect it to handle in 12 months (*anticipated exposure*), with the option to select from five bands ranging between “almost none” and “nearly all.” Close to 6 in 10 respondents chose a higher band for next year than for today. Over a third expect AI to be able to do most or nearly all of their work tasks next year (Figure 3.2).
Figure 3.3 compares reported and anticipated exposure to observed and theoretical exposure. We ask whether what people report and anticipate AI can do lines up with the observed and theoretical exposure measures across occupations, and whether respondents whose occupations score higher on observed or theoretical exposure expect faster progress over the next year. On the first question, the answer is yes: reported exposure (grey dots) is positively correlated with both observed and theoretical exposure. On the second, the answer is no: the best-fit lines for reported and anticipated exposure 12 months from now (orange dots) are essentially parallel, meaning that people in roles with high observed or theoretical exposure expect roughly the same *increase* in the share of their work tasks AI can do over the next year as those in roles with less observed and theoretical exposure.17 In other words, a software engineer and a construction manager anticipate roughly the same increment of progress within their profession.
It is also worth noting that reported exposure systematically exceeds observed exposure. One explanation for this is that not everybody does every task in an occupation, and our survey disproportionately reaches those who use AI more.18 Analogously, since theoretical exposure is an upper bound on what is possible instead of a measure of current use, theoretical exposure systematically overstates reported exposure.
We also examine how perceptions of AI’s current and future capabilities relate to the characteristics and usage patterns of respondents. The left panel of Figure 3.4 shows that perceptions of AI’s capabilities are negatively correlated with country GDP:19 the average share of tasks people report AI can do for them now is about 10 percentage points lower among high-income countries. This pattern is consistent with the possibility that AI substitutes for a larger share of the tasks that workers in lower-income countries do day-to-day, even if occupation-level exposure metrics—which tend to be higher in advanced economies—suggest otherwise. Indeed, the IMF has noted that while advanced economies face broader AI exposure overall, workers in lower-income countries may have less access to the complementary skills and infrastructure that allow AI to augment rather than replace their work. In earlier work we documented that lower-income economies tend to use Claude in more automated ways even when adjusting for differences in task mix.
The middle panel shows that reported and anticipated exposure are also negatively correlated with years of work experience.20 People with at least 15 years of experience put that share of tasks AI can do roughly 10 percentage points lower than those in their first year of work. We find evidence that this may be because experienced workers have accumulated tacit or context-specific expertise that is difficult for an AI to mimic. In follow-up questions, we asked people what tasks they thought AI would never be able to do and why; the most common responses emphasized that AI lacks the judgment, contextual awareness, and situational reasoning that their work requires. Respondents, and disproportionately those with at least 15 years of experience, also pointed to the relational and interpersonal dimensions of their jobs—building trust and managing people—as things AI cannot replicate.
As with occupational exposure to AI, we find that perceptions about future improvements in AI capabilities are essentially uncorrelated with GDP per capita and years of experience. The expected share of tasks that AI will be able to do in 12 months is uniformly higher than perceptions about AI’s capabilities today.
We next examine the relationship between how people interact with Claude and their current perceptions of Claude’s capabilities. As with past reports, we distinguish between “automation” and “augmentation” modes of collaborating with Claude. We identify conversations as automated when Claude is asked to complete a task with little to no input from the user. Concretely, automation share is the share of conversations whose pattern is either directive (“translate this document”) or a feedback loop (“edit this email…make it more casual”).21
The right panel of Figure 3.4 shows that reported and anticipated exposure rise with automation share. This could be because delegation is informative about capabilities—people who hand over entire tasks observe directly what AI can complete on its own—or because people who already believe AI can do their work are the most willing to hand it over. The same patterns hold when we replace automation share with the share of sessions devoted to work tasks, or the share conducted in Claude Code.22
AI and jobs
We also ask how people think their jobs will change in the next 12 months. More than a third of respondents said it was likely or very likely that responsibilities would significantly change (for themselves, a peer, a junior colleague, and a senior colleague). 10% rated losing their own jobs as likely or very likely. This is slightly below the annualized hazard rate of losing a job in the US;23 however, since our respondents skew toward knowledge workers in stable employment (a group that plausibly faces below-average separation risk at baseline), this may still indicate elevated perceived risk. When asked an open-ended question about what was driving their forecasts, 38% of the respondents who rated their job loss as likely or very likely attributed their forecasts to AI.24 Notably, respondents were on average more worried about job loss for others than for themselves.25 Respondents were especially worried about job loss for their junior colleagues, with over one third stating that the probability of a junior colleague losing their job in the next year was over 60%. Respondents were also more concerned about job loss (for everyone) in lower-income countries.
Are people who use Claude in more automated ways also more worried about losing work? We examine what people said about AI’s expected impact over the next year on six dimensions of work: pay, job security, ability to find a new job (economic dimensions) and meaning, autonomy, and human interaction (intrinsic dimensions); and look at how these expectations differ by the automation share of Claude usage.
Across all six dimensions, people with a higher share of automated sessions feel *more optimistic* about the effect of AI on their job outcomes next year compared to those who use Claude more augmentatively. We saw the largest effects on expectations about positive impacts on future pay and ability to find a job.26
A natural question is why automated usage and sentiment move together. It’s possible that this relationship is explained by selection, that the people most enthusiastic about AI are also the most willing to hand over entire tasks to it. We can’t rule this out entirely, but these estimates don’t meaningfully change when we control for user tenure on Claude.ai—which we can think of as a proxy for enthusiasm, because it captures early versus later adopters.
Another possibility is that people who use AI in more automated ways experience more of its benefits today. Consistent with our previous findings, large majorities of people report productivity gains in speed, scope, and quality of their work (86%, 82%, and 69%, respectively), while 27% report gains through cost savings on services they would otherwise have to purchase.
In addition to significant productivity gains, the majority of people also report learning more with AI (68%) and feeling like AI has made their skills more valuable (57%). Figure 3.7 shows how these two outcomes vary with the share of automated sessions. We see that the share of people reporting that AI is increasing the market value of their skills rises with automation share, while the share reporting they learn more is roughly flat.
A commonly voiced concern about delegation is that handing entire tasks to AI means offloading thinking, with gains in output coming at the cost of learning and skill atrophy. We do not see this pattern here: heavier delegators report learning at the same rate as everyone else. However, these are self-assessments, and skills can erode even as they become more valuable and as someone reports learning more, so the data do not rule out skill erosion.
<h3 id="how-usag
関連記事
今日のまとめ
AI日報で今日の重要ニュースをまとめ読み