LangChain、Kubernetes 向け自律型 SRE エージェントの構築手法を公開
本文の状態
日本語全文を表示中
詳細モードで約15分の本文を読めます。
同じ出来事の情報源
この情報源を基点に整理
LangChain Blog
LangChain のエンジニアが、Kubernetes クラスターの監視とトラブルシューティングを自動化する自律型 SRE エージェントの構築プロセスと、その信頼性を高める LangSmith の役割について詳述している。
AI深層分析を開く2026年8月6日 02:22
AI深層分析
キーポイント
自律型 SRE エージェントの構築背景
Kubernetes から発せられる膨大なシグナルを人間が常時監視するのは認知負荷が高く、機械的なトイルに起因する燃え尽きを防ぐために本エージェントを開発した。
双方向の監視アーキテクチャ
プロアクティブな定期チェックでは Claude Haiku を用いて構造化されたレポートを生成し、オンデマンド調査では pod-inspector や log-analyzer などの専門サブエージェントを並列実行する。
LangSmith による信頼性の担保
LLM の出力が信頼できるものとするために LangSmith を活用し、人間の介入が必要なケースのみを抽出してチームの認知負荷を軽減している。
安全モデルとヒューマン・イン・ザ・ループ
エージェントはクラスター全体を読み取るが、変更は行わず、すべての書き込み操作は人間による承認を必要とする。
Deep Agents と専門サブエージェントの採用
LangGraph 上の Deep Agents を基盤とし、計画ループとヒューマン・イン・ザ・ループ機能を活用する。また、文脈を狭く保つために専門的なサブエージェントを並列で運用し、コスト効率を高める。
重要な引用
Doing this continuously, on top of a full-time job, is exhausting, and it isn't unique to me.
90% of this work is mechanical triage that mostly comes back clean.
It collects raw cluster state through the Kubernetes Python client (zero LLM tokens), then makes one Claude Haiku call with forced tool-use.
Read is autonomous and writing is always gated through HITL.
編集コメントを表示
編集コメント
LangChain が自社のプラットフォーム上で構築した自律型エージェントの内部構造を公開しており、AIOps の実装におけるベストプラクティスを示唆している。Claude Haiku と LangSmith を組み合わせたアプローチは、コストと信頼性のバランスを取る有効な手法として注目される。
Source Article
元記事を日本語で読む
本文に関係しない購読案内、埋め込み通知、サイト内プロモーションは除いています。
Kubernetes 展開向けに自律型 SRE エージェントを構築した方法
Kubernetes 展開向けに自律型 SRE エージェントを構築した方法
私は LangChain でデプロイエンジニアとして働いており、私の業務の多くは Kubernetes の上で完結しています。私が管理しているのは、社内で自社ホストするクラスターです(新しい自社ホスト機能もまずここに導入され、チームが新機能が到着次第すぐにテストできるようにしています)。また、顧客が自社の環境を構築・アップグレードする際にも支援を行っています。
これには、クラスターがダウンした際にアーキテクチャを読み込み、障害箇所を特定して修正できるほど深い理解が必要となります。フルタイムの業務をこなしながらこれを継続するのは非常に疲れるものであり、私だけの悩みではありません。インフラに関わる仕事をしている人なら誰でも同じ痛みを知っているはずです。
そこで私たちは、トラブルシューティングまでの時間と修復までの時間を短縮するために、自律型 SRE エージェントを構築しました。目的は、インフラの信頼性を高め、チームの認知負荷を減らすことです。このエージェントには、Kubernetes の健全性を診断し、修正策を提案し、クラスターやインフラの変更が必要な場合にのみ人間を巻き込むという役割を与えています。
この記事では、なぜこれが必要だったのか、どのように構築したのか、LangSmith がどのように信頼性を担保しているのか、そして実際に得られたメリットについて解説します。
Part 1: Why We Built It
Kubernetes は、ポッドのフェーズや再起動回数、HPA(Horizontal Pod Autoscaling)の状態、ノードの状況、警告イベント、デプロイメントの準備状況など、数十のネームスペースにわたる膨大なシグナルを放出しますが、それらを統合した洞察はほとんど提供しません。オンコール担当者はこれらのシグナルを使って、主に 3 つの質問に答えようとしています。「今何か壊れているか(クラッシュループ、OOM キル、レディエンドポイントがゼロなど)」「これから何が壊れそうか(HPA が最大値で固定されている、単一レプリカのサービス、:latest イメージタグの使用など)」「どう対処すべきか」。これらの質問に的確に答えるには判断力が不可欠なため、インフラエンジニアや専門家に任されがちです。しかし、この作業の 90% は機械的なトリアージであり、多くの場合問題がないという結果に戻ります。これがエンジニアを疲弊させる「苦役(toil)」であり、重要なアラートを無意識に見逃す癖をつけてしまう原因となっています。
Part 2: What we built
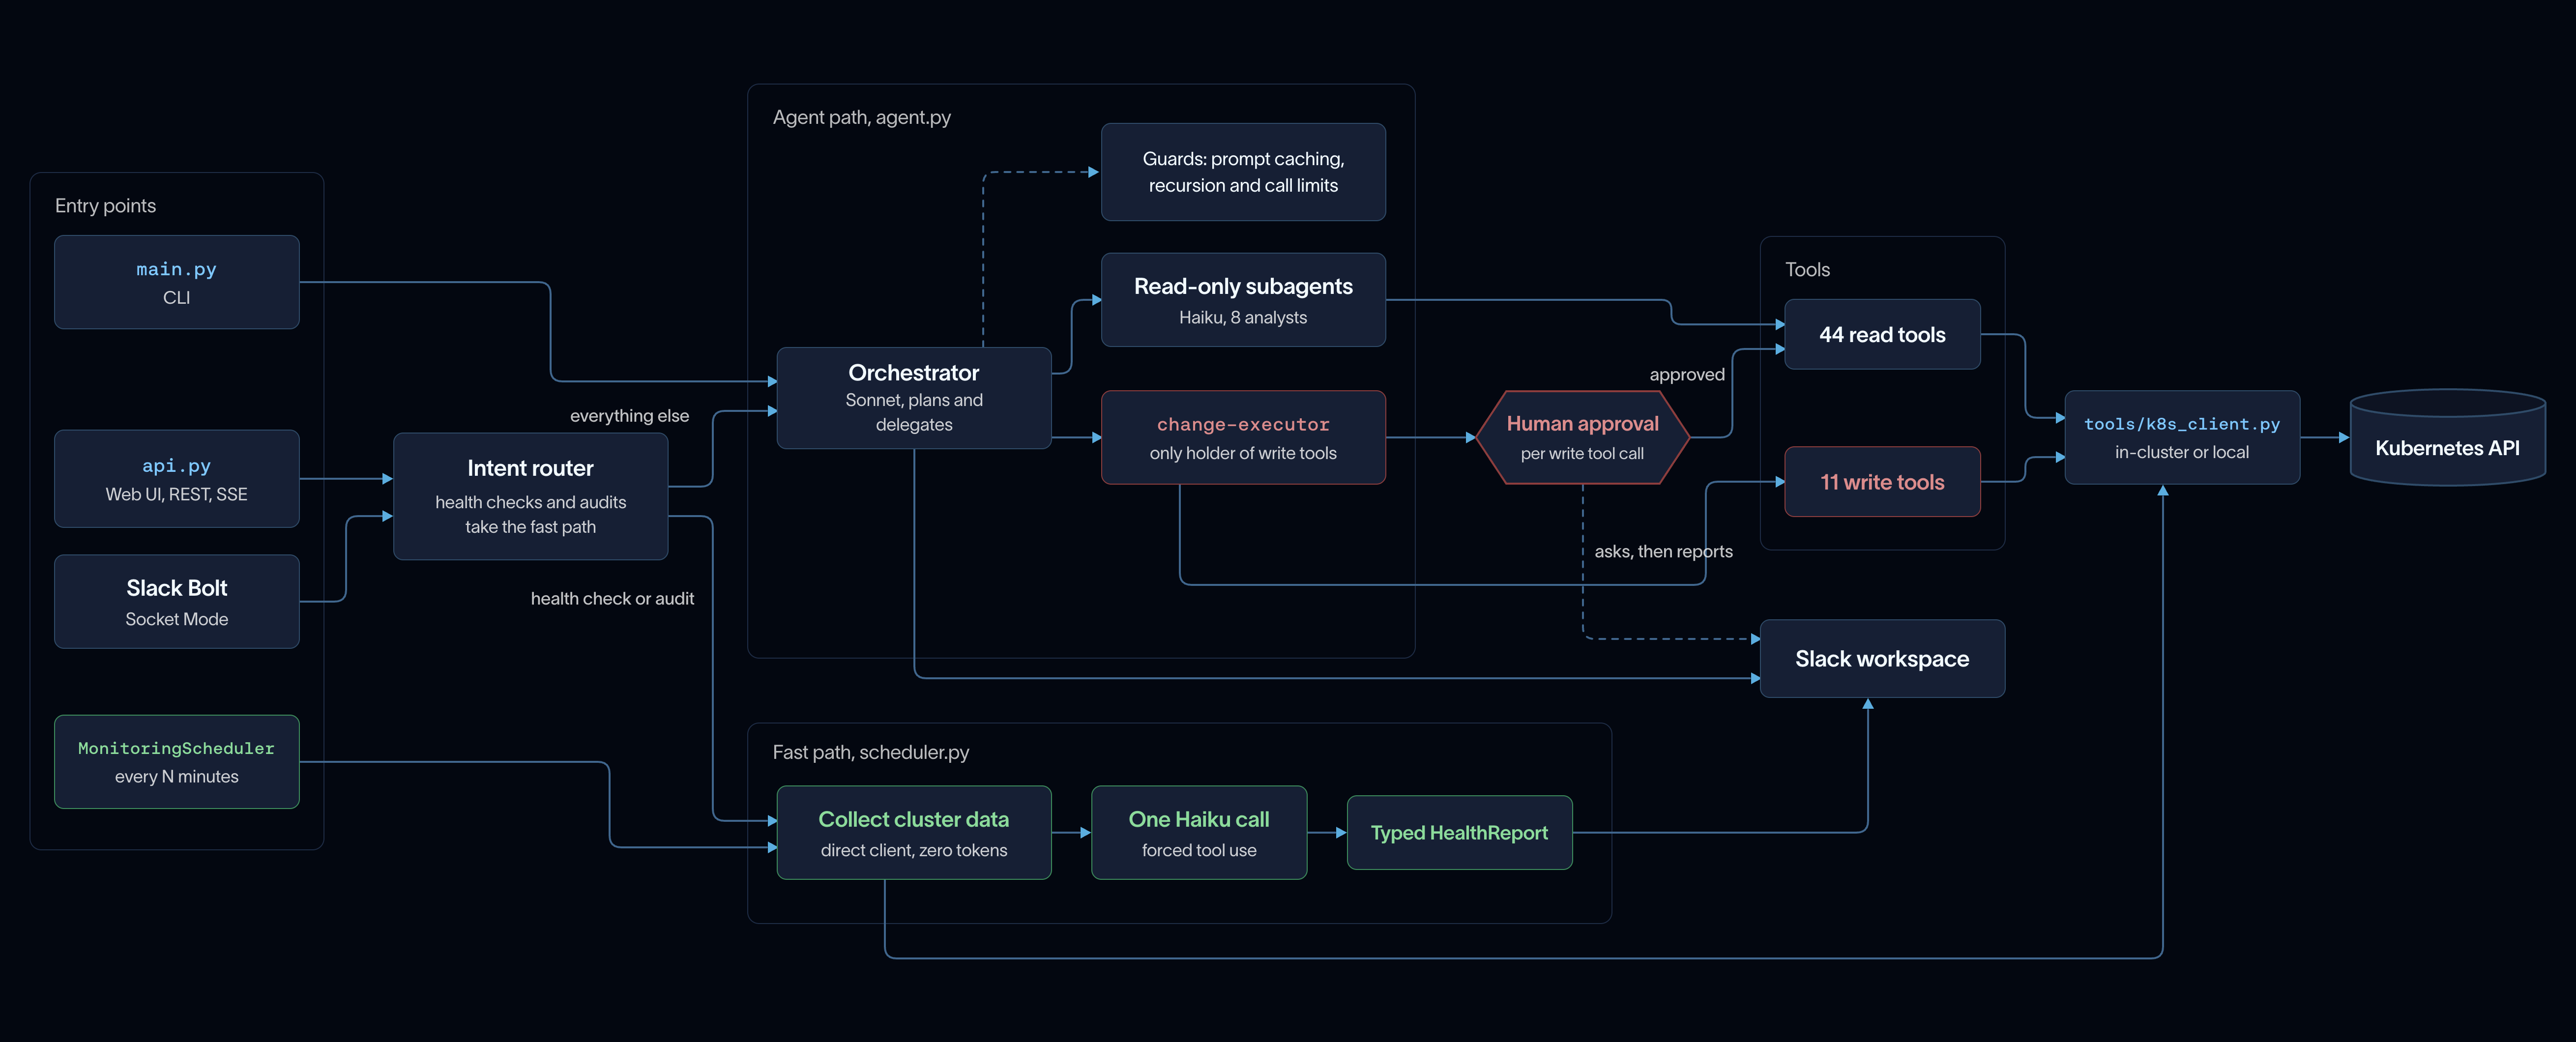
プロアクティブな監視。 スケジューラーは、フルエージェントを起動させずに N 分ごとに健康状態を確認します。Kubernetes Python クライアントを通じてクラスタの生データを収集し(LLM トークンを一切消費せず)、その後、Claude Haiku に強制ツール使用を指示して構造化された健康レポートを生成させます。このレポートは深刻度順にソートされ、Slack に配信されます。
オンデマンド調査。 診断が必要な事案が発生すると、オーケストレーターが並列で専門サブエージェントへタスクを振り分けます。対象となるのは pod-inspector、scaling-analyzer、performance-analyzer、log-analyzer、security-auditor、reliability-auditor などです。各サブエージェントはクラスタを独立して読み込み、その後、優先順位をつけた単一のレポートに統合します。
セーフティモデル
このエージェントはクラスター全体を読み取ることはできますが、自身で変更を加えることはありません。デプロイメントのスケーリングやロールアウトの再起動、HPA のパッチ適用など、すべての書き込み操作は単一の「変更実行サブエージェント」内に閉じ込められており、各書き込みツールには人間による承認(HITL)を介したインターラプトが設けられています。エージェントが修復案を提案すると、担当者は Slack メッセージから直接、承認・拒否・修正のいずれかを選択します。読み取りは自律的に行われますが、書き込みは常に HITL を経由して制限されます。この仕組みは構造的に強制されており、クラスター内の RBAC(クラスター全体の読み取り権限と、厳密にスコープを絞った書き込み権限)によって裏付けられています。
第 3 部:どのようにして構築したか(そしてその理由)
以下に示す各選択は、明白な道と正しい道が分岐する分岐点でした。
Kubernetes 向け自律型 SRE エージェントの構築方法
- 生ループではなく、深層エージェントを採用。
LangGraph 上で Deep Agents(create_deep_agent())を基盤に構築しました。これにより、タスク記述を行う計画ループ、ファーストクラスサブエージェント、そして標準で実装された人間介入(HITL)の中断機能などが提供されます。これらをすべて手動で実装する必要はありません。基本方針として、必要なワークフローを阻害しない最も高レベルなフレームワークを選択します。
- 万能なプロンプトではなく、専門特化型サブエージェント。
各専門エージェントがクラスタの一部領域を担当することで、並列処理の実現、文脈の絞り込みによるハルシネーション(幻覚)の低減、そしてコスト効率の高いモデルでスコープを限定したタスクを実行する選択肢を得られます。
- 思考には Sonnet を、スケールには Haiku を。
統合・調整を行うオーケストレーターには Claude Sonnet を使用し、読み取り専用サブエージェントと定期チェックには Claude Haiku を採用します。必要な場所にのみ知能コストを投下する設計です。
- スケジューラーはエージェントを迂回する。
以前は「すべて正常」と確認するためにもフルオーケストレーター(約 20 のモデル呼び出し)を実行していましたが、現在は Python で直接状態を収集し、Haiku を 1 回呼び出すだけで済むように変更しました。このアプローチにより、問題検知能力を維持したままチェックあたりのコストを 95% から 99% 削減しています。本格的な調査が必要なケースにのみ、フルパワーのモデルを温存します。
人間が実際に確認できる承認画面を提供する
提案された変更は、影響を受けるすべてのコンポーネントにおいて明確である必要があります。デプロイメントを 3 にスケールアップすることは一瞬で把握できますが、Helm アップグレードは承認画面からは見えない数十のリソースを書き換えるワンクリック操作です。そのため、私たちは記述ツールの範囲を狭く保ち、あえて粗大で影響範囲の広いツール(有用なものであっても)の使用を制限しました。このゲートは、人間が承認内容を本当に判断できる場合にのみ、本番環境を守ります。
読み取りと書き込みの分離は構造的に実装されています
読み取り用と書き込み用のツールは別々のモジュールに配置され、書き込み用ツールは中断ゲートの背後にある「変更実行サブエージェント」内でのみ存在します。オーケストレーター自体が書き込みツールにアクセスすることはできません。クラスター内の RBAC(ロールベースのアクセス制御)も同様の分離を反映しています。
どこでも動作可能で、公開された入力は不要
Kubernetes クライアントは自動でクラスター内かローカルかを検出します(イメージ内に kubectl バイナリは含まれていません)。Slack は Socket Mode(アウトバウンド WebSocket)経由で動作するため、承認フローに外部からアクセスできるエンドポイントを暴露する必要がありません。コンテナは非ルートユーザーで実行され、ルートファイルシステムも読み取り専用です。
私たちのアーキテクチャにおける共通の理念は、シンプルかつコスト効果の高い設計を維持することです。インフラストラクチャ管理におけるエージェントの成果が向上する場合にのみ、トークン使用量やモデル計算リソース、ネットワーク攻撃面を増大させます。この考え方が、本番環境を指針として安全に運用でき、数分ごとに実行可能なほど低コストなエージェントを実現しています。
第4部:LangSmith がエージェントのデバッグと改善をどう支えるか
第2部で決定されたすべての処理は、LangSmith のトレースとして実行されます。スケジュールされた Haiku チェックから、各サブエージェントによる調査、そしてすべての読み取り操作や提案される書き込み操作に至るまでです。
Deep Agents と LangGraph のコンポーネントは自動的にトレースされますが、スケジューラーが直接行う Anthropic への呼び出しは、@traceable デコレーターでラップされています。
トレーシングで明らかになったこと
- 約 20 回の呼び出しを行うスケジュールチェックは、LLM の無駄でした。
Part 2 で紹介したスケジューリの再設計は、LangSmith の実行ごとのコスト内訳を調査することから始まりました。その結果、「すべて正常」という結果が返ってくる際にも、サブエージェント間で約 20 回の Sonnet モデル呼び出しが行われていることが判明しました。1 回の実行あたりのトークン数とコストを確認したことで、コストを 95〜99% 削減する「Haiku モデル 1 回呼び出し」への書き換えが実現できました。
- 無限ループはトレーシングから明確に検出できます。
以前、別のエージェントがファイルシステムの grep や read_file ツールを繰り返し呼び出して無限ループに陥り、誰にも気づかれないうちに約 5 ドルのコストを浪費した事例がありました。その時のトレーシングでは、同じツール呼び出しが単一の実行内で数十回積み重なっている様子が確認できました。これをきっかけに、厳格な再帰制限、モデル呼び出しごとの上限、ツールごとの制限、そしてプロンプトキャッシュを導入しました。
- 誤検知もパターンとして捉えることができました。
スケーリング解析器は、意図的にレプリカ数を 1 に設定しているサービスまでを「CRITICAL(重要)」と判定していました。トレーシングには、サブエージェントが把握した具体的なスナップショットと、そこに至る推論プロセスが記録されています。これにより、すべての名前空間を一括で確認できる視点を得て、直接的な証拠に基づいたプロンプトの変更だけでこの挙動を修正することができました。
- すべてのヒューマン・イン・ザ・ループ(HITL)編集は学習データになります。
Part 1 で紹介した安全性モデルによる承認・編集・却下は、その実行に対するフィードバックとして記録されます。「提案:10 レプリカ → 人間が修正:4 レプリカ」という事例は、エージェントが行う最も重要な呼び出しに対するラベル付きデータです。エージェントとのあらゆるやり取りは、トレーシング上のシグナルとなり、エージェント自体やその推奨事項の改善に活用できます。
これらの知見を回帰テストスイートへ
ラベル付けされた実行結果は、評価システムの基盤となります。誤分類されたポッドや見逃された OOM(Out of Memory)エラーは、正解を含む LangSmith データセットに追加され、すべてのプロンプト変更やモデル調整が LLM-as-judge やコードベースの評価器を通じて再実行されます。これにより、回帰が発生すると数値が赤く表示され、マージされなくなります。上記の単一レプリカによる偽陽性のケースは、評価スイートにおける恒久的なテストケースとして定着します。
LangSmith Engine: 改善ループを自動化する
前述の改善ループでは、依然として人間が望ましくない挙動に気づき、トレースを見つけ、それをデータセットへ追加する必要があります。これはエージェントの保守担当者にとって多大な時間を要する作業です。LangSmith Engine はこの手動作業を自動化します。これは、トレーシングプロジェクトを三つの段階で監視する能動的なエージェントエンジニアのようなものです。
- 検出(Detect): 関連するトレースをクラスタリングし、ランク付けされた課題としてまとめます(例:「スケーリング解析器が意図的に単一レプリカのサービスを 6 つのネームスペースで CRITICAL と誤判定している」という事象を、40 の個別のトレースではなく一つの課題として扱います)。この処理はデータを一切保持せずに行われるため、誰かのモデル学習に使用されることはありません。
- 修正(Fix): 失敗の原因を要約し、プロンプトやコードの変更案を作成して、差分と説明付きで GitHub PR として起票します。
- 防止(Prevent): オンライン評価器やデータセットのサンプルを提案し、同様の回帰が再発しないように対策を講じます。
Engine は、私たちが自ら報告していなかったオープンな課題としてトレーシングデータをグループ化しました。その一例として、スケジュールされたヘルスチェックでは利用状況データが全く収集されていないことが挙げられます。
このコレクターはノード、ポッド、警告イベント、HPA(Horizontal Pod Autoscaler)、デプロイメントを照会していましたが、分析ステップでは利用可能なツールがない状態で単一の強制ツール呼び出しが行われていました。そのため、モデルはコレクターがスキップしたデータを取得できませんでした。
毎時間のレポートで構造的に回答できない容量に関する質問が発生し、「ポッドの CPU/メモリーメトリクスを確認する」などの推奨アクションとして私たちに返却されていました。kubectl_top_pods や kubectl_top_nodes という機能は、対話型エージェント用のリポジトリには既に存在しており、スケジュールされたパスには接続されていませんでした。
Engine は、ポッドとノードのメトリクスをコレクターに統合する提案を行いました。新しいロジックを開発するのではなく、既存のユニット解析を再利用し、変更範囲はコレクターに限定しました。これにより、分析プロンプトやゼロトークンの特性には影響を与えません。
この変更はプルリクエストとして提出され、レビューを経てデータセットの例として追加されました。回帰を防ぎ修正が機能することを証明するためにデータセットでテストされた後、マージされました。
今後の展望
SRE エージェントは引き続き社内でも活用し、現在 LangSmith の顧客の一部への展開も開始しています。Kubernetes やスタックの他の部分に対応する機能を強化するため、開発と機能拡張に注力中です。
次期アップデートでは、ヒューマン・イン・ザ・ループ(HITL)対応のための状態永続化や、直近のインシデント履歴を保持できるステートフルな監視ループの実装などが予定されています。本プロジェクトはオープンソースとして公開されており、以下のリンクから入手可能です。
https://github.com/langchain-samples/sre-agent
ぜひご試用のうえ、貢献やフィードバックをお寄せください。
エージェントの実際の動作を確認する
エージェントエンジニアリングプラットフォーム「LangSmith」を使えば、開発者はすべてのエージェント判断をデバッグし、評価結果の変更を検証し、ワンクリックでデプロイすることが可能です。
原文を表示
How we build an autonomous SRE Agent for Kubernetes Deployments
How we build an autonomous SRE Agent for Kubernetes Deployments
I'm a Deployed Engineer at LangChain, and a good part of my job lives on top of Kubernetes. I maintain our internal self-hosted cluster (also where new self-hosted features land first, so our team can test them as they arrive), and I help customers stand up and upgrade their own self-hosted environments. Doing this requires a mental model of a live cluster deep enough that when ours goes down I can read the architecture, find the fault, and fix it. Doing that continuously, on top of a full-time job, is exhausting, and it isn't unique to me. Anyone who works on infrastructure knows these pains.
So we built an autonomous SRE Agent to reduce time to triage and time to remediation. The goal was to improve infrastructure reliability and reduce cognitive load on the team. We wanted it to triage Kubernetes health, propose fixes, and pull in a human only when a cluster or infrastructure changes need to happen. This post covers why, how we built it, why LangSmith makes it trustworthy, and the benefits we've seen.
Part 1: Why We Built It
Kubernetes emits a firehose of signals (pod phases, restart counts, HPA (Horizontal Pod Autoscaling) states, node conditions, warning events, deployment readiness, across dozens of namespaces) and almost no synthesis. On-call engineers use these signals to answer three questions: Is anything broken now (a crash loop, an OOM kill, zero ready endpoints); Is anything about to break (an HPA pinned at max, a single-replica service, :latest image tags); What do we do about it? Answering these questions well takes judgment, so it falls to infrastructure engineers or subject matter experts, but 90% of this work is mechanical triage that mostly comes back clean. This is the toil that burns people out and trains them to inadvertently skim past important alerts.
Part 2: What we built
Proactive monitoring. A scheduler checks health every N minutes without waking the full agent. It collects raw cluster state through the Kubernetes Python client (zero LLM tokens), then makes one Claude Haiku call with forced tool-use to produce a structured health report that lands in Slack, sorted by severity.
On-demand investigation. When an issue needs diagnosis, the orchestrator fans out to specialized subagents in parallel: pod-inspector, scaling-analyzer, performance-analyzer, log-analyzer, security-auditor, reliability-auditor, and more. Each reads the cluster independently before it synthesizes one prioritized report.
The safety model
The agent can read the entire cluster but change nothing on its own. Every write (scaling a deployment, restarting a rollout, patching an HPA) lives inside a single change-executor subagent, and each write tool is gated by a human-in-the-loop (HITL) interrupt. The agent proposes a remediation, a person approves, rejects, or edits, right from a Slack message. Read is autonomous and writing is always gated through HITL. It’s enforced structurally and mirrored by in-cluster RBAC (cluster-wide read, tightly scoped write).
Part 3: How We Built It (and Why)
Each choice below was a fork where the obvious path and the right path diverged.
- Deep Agents, not a raw loop. We build on Deep Agents (create_deep_agent()) over LangGraph, which gives us a planning loop (write_todos), first-class subagents, and built-in HITL interrupts out of the box, all things we'd otherwise need to hand-build. Our rule of thumb is to reach for the highest-level framework that doesn't fight you on the workflow you need to build.
- Narrow subagents, not one omniscient prompt. Specialist agents each own a slice of the cluster, which buys parallelism, tighter context (fewer hallucinations), and the option to run well-scoped tasks on a cheaper model.
- Sonnet where it thinks and Haiku for scale. The synthesizing orchestrator runs on Claude Sonnet; the read-only subagents and the scheduled check run on Claude Haiku. Pay for intelligence only where it's needed.
- The scheduler bypasses the agent. It used to run the full orchestrator (~20 model calls) just to confirm "all healthy." Now it collects state in plain Python and makes one Haiku call. This approach achieves a 95 to 99% cost cut per check with no loss in catching issues. We reserve full power for on-demand investigations.
- Give the human an approval they can actually read. The changes that are proposed need to be clear in all the components they affect. Scaling a deployment to 3 is legible in a glance; a helm upgrade is one click that rewrites dozens of resources you can't see from the approval prompt. So we kept write tools narrow and legible and deliberately withheld coarse, high-blast-radius ones, even useful ones. This gate protects production only when the human can truly judge what they're approving.
- The read/write split is structural. Read and write tools live in separate modules, and write tools exist only inside the change-executor subagent behind an interrupt gate. The orchestrator literally can't access a write tool. In-cluster RBAC mirrors the same split.
- Runs anywhere, no public ingress. The Kubernetes client auto-detects in-cluster vs. local (no kubectl binary in the image), and Slack runs over Socket Mode, an outbound WebSocket, so approvals flow with no inbound endpoint to expose. The container is non-root with a read-only root filesystem.
The through-line in our architecture is to keep things as simple and cost-effective as possible. We spend tokens, model power, and increase network surface only where it improves agent outcomes for the infrastructure we’re managing. That's what makes the agent cheap enough to run every few minutes and safe enough to point at production.
Part 4: How LangSmith Helps Us Debug and Improve the Agent
Every decision in Part 2 runs as a LangSmith trace: the scheduled Haiku check, each subagent investigation, every read and proposed write. The Deep Agents and LangGraph pieces trace automatically; the scheduler's direct Anthropic calls are wrapped with @traceable.
What the traces caught
- The ~20-call scheduled check was llm waste. The scheduler redesign in Part 2 started with an investigation into the LangSmith per-run cost breakdown. We saw that checks coming back "all healthy" were quietly fanning out to ~20 Sonnet calls across subagents. Seeing the tokens and dollars per run pointed us toward the one-Haiku-call rewrite that cut costs 95 to 99%.
- A runaway loop is obvious from the trace. We'd watched another agent get stuck calling its filesystem grep/read_file tools in a tight loop and burn ~$5 before anyone noticed. In the trace, the same tool call was stacking up dozens of times down a single run. This told us to cap it, so the bot now runs under hard recursion, model-call, per-tool limits, and prompt caching on top.
- A false positive showed up as a pattern. The scaling-analyzer kept flagging intentionally single-replica services as CRITICAL. The trace shows the exact snapshot the subagent saw and the reasoning that got there. It provides a view across all namespaces at once, so we were able to fix the behavior with a prompt change tied to direct evidence.
- Every HITL edit is graded data. The approve/edit/reject from Part 1's safety model attaches as feedback on that run. "Proposed 10 replicas; human edited to 4" is a labeled example on the highest-stakes call the agent makes. Every interaction with the agent is signal on the trace we can use to improve the agent and its recommendations.
From those findings to a regression suite
Those labeled runs form the backbone of our evaluations. A misclassified pod or a missed OOM gets promoted into a LangSmith dataset with the correct answer attached, and every prompt or model tweak then runs against it with LLM-as-judge and code-based evaluators, so a change that regresses shows up as a red number and doesn't merge. The single-replica false positive above becomes a permanent test case for our eval suite.
LangSmith Engine: running that loop for us
The improvement loop above still relies on a human noticing undesirable behavior, finding the trace, and promoting it to a dataset. It’s time intensive for whoever maintains the agent. LangSmith Engine automates this manual work. It's like a proactive agent engineer that watches our tracing project in three stages.
- Detect: it clusters related traces into ranked issues (e.g. "the scaling-analyzer flags intentionally single-replica services as CRITICAL across six namespaces" as one issue, not forty traces), and it does this reading our traces under zero data retention, so they never train anyone's model.
- Fix: it summarizes the failure, writes the prompt or code change, and opens it as a GitHub PR with a diff and explanation.
- Prevent: it suggests online evaluators and dataset examples so the regression can't return.
Engine has grouped our traces into open issues we had not filed ourselves. One example is that the scheduled health check was collecting no utilization data at all. The collector queried nodes, pods, warning events, HPAs, and deployments, and the analysis step was a single forced-tool call with no tools available, so the model couldn’t fetch what the collector skipped. Every hourly report raised a capacity question it structurally could not answer and handed it back to us as a recommended action like "check pod CPU/memory metrics". The kubectl_top_pods and kubectl_top_nodes capability was already in the repo for the interactive agent and had never been wired into the scheduled path. Engine proposed wiring pod and node metrics into the collector, reusing the existing unit parsing rather than inventing new logic, and scoped the change to the collector so the analysis prompt and the zero-token property stay untouched. It arrived as a pull request that was reviewed, added as an example to our dataset, tested against our dataset to prevent regressions and prove the fix worked, and then merged.
Part 5: What’s Next
We will continue to use SRE Agent internally and have begun rolling this out to some current LangSmith customers. We’re actively working to develop it and expand its capabilities for Kubernetes and other parts of the stack. Some of the next improvements will be making the state durable for HITL, and making the monitoring loop stateful so it has memory of the recent incidents reported. It is open source and available here. https://github.com/langchain-samples/sre-agent . Feel free to try it out, contribute, or provide feedback.
See what your agent is really doing
LangSmith, our agent engineering platform, helps developers debug every agent decision, eval changes, and deploy in one click.
News to Guide
ニュースの次に確認する
発表内容を、現在の料金や仕様と照らし合わせられる関連ガイドです。
今日のまとめ
AIデイリーブリーフで今日の重要ニュースをまとめ読み