LLM評価:知っておくべき全知識
Hamel Husain は、700 人以上のエンジニアと PM に AI 評価を指導した経験に基づき、LLM 評価の実践的フレームワーク、LLM-as-a-Judge の構築手順、および RAG やファインチューニングにおける具体的な改善戦略を詳述している。
キーポイント
3 レベルの包括的評価フレームワーク
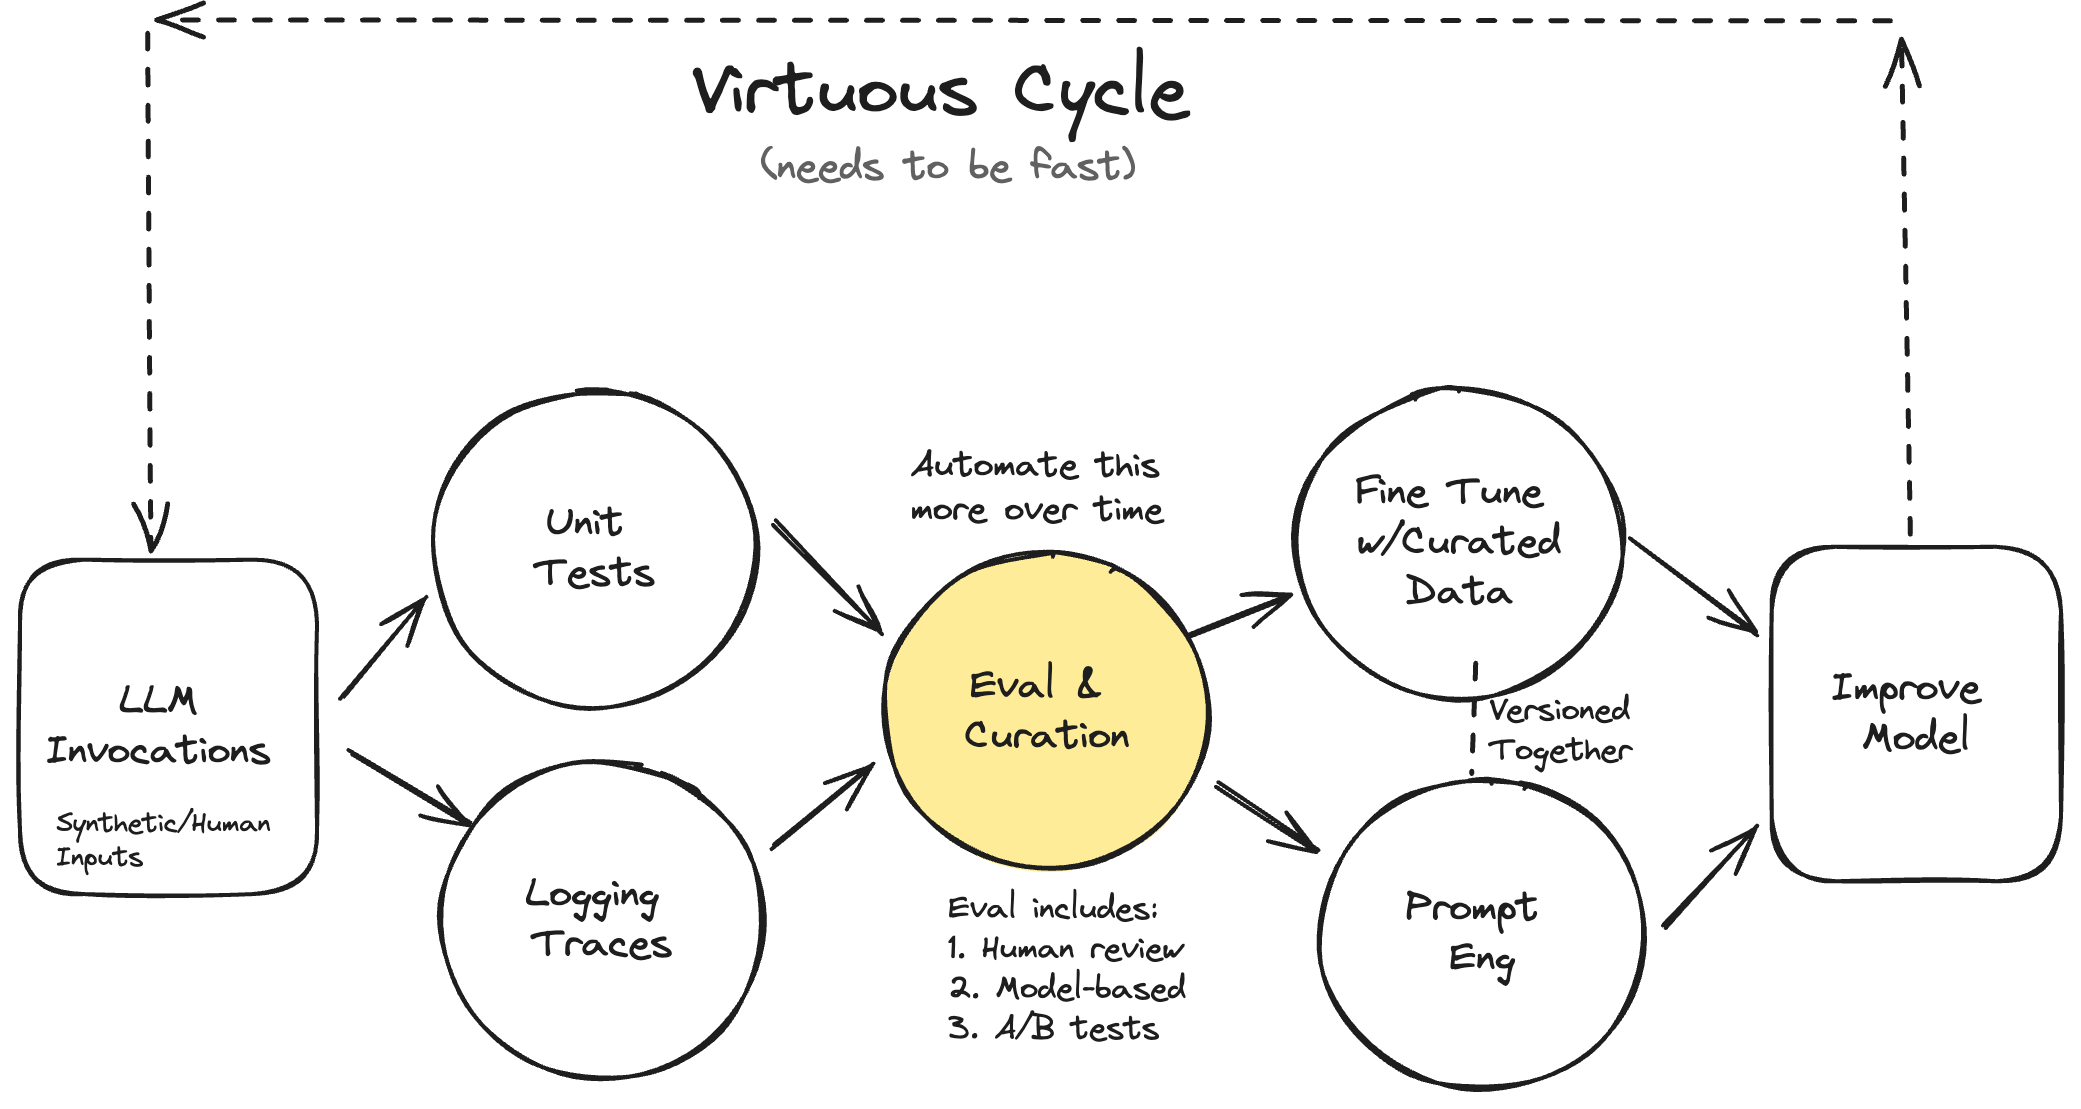
単なるベンチマークではなく、製品固有の評価としてレベル1(ユニットテスト)、レベル2(人間・モデル評価)、レベル3(A/B テスト)を段階的に導入するアプローチが提唱されている。
LLM-as-a-Judge の構築プロセス
ドメイン専門家と協力してデータセットを作成し、彼らに批判付きの合格/不合格判定を行わせることで、ビジネス結果を直接駆動する評価システムを反復的に構築する方法が示されている。
エラー分析による ROI 最大化
機能追加よりも実験数を重視し、エラー分析を通じて最も効果的な改善点(ROI が高い箇所)を特定し、ドメイン専門家も参画させることで AI プロダクトの迅速な改善を実現する。
トレースと用語の標準化
ユーザークエリから最終レスポンスまでの全記録である「トレース」の定義を明確にし、ベンダー間の用語の違い(スパンなど)に注意喚起することで、観測可能性システムの理解を深めている。
評価は開発プロセスの一部として捉える
評価を独立した項目ではなく、デバッグと同様に開発プロセスに組み込むべきであり、自動化よりもエラー分析とデータ理解に多くの時間を割く必要があります。
100% 合格は過剰適応の兆候
評価の通過率が 100% に達している場合はシステムが十分にテストされていない可能性が高く、70% 程度の合格率の方が実用的なストレステストを示唆しています。
チームへの投資提案はデータで示す
「評価」の重要性を理論的に説得するのではなく、実際のデータ分析で見つかった具体的な問題や失敗事例を見せることでチームの理解を得るべきです。
影響分析・編集コメントを表示
影響分析
この記事は、LLM 評価を抽象的な概念から具体的な実装プロセスへと落とし込むための実践的ガイドラインを提供しており、AI プロダクト開発現場における評価基準の標準化と効率化に大きく寄与する。特にドメイン専門家の巻き込み方や LLM-as-a-Judge の構築手法は、多くの組織が直面している「データ過多かつ改善点不明」という課題に対する即効性のある解決策となる。
編集コメント
700 人以上の指導経験に基づく「シャープな意見」は、教科書的な知識ではなく現場の痛みを伴う知見として非常に貴重です。特にドメイン専門家を評価プロセスに組み込む手法は、技術者だけでなくビジネスサイドも巻き込むための重要な示唆を含んでいます。
このドキュメントは、私が Shreya とともに 700 人以上のエンジニアとプロダクトマネージャーに AI Evals(評価システム)を教える際に受け取った最も一般的な質問を集めたものです。注意:これらは多くのケースで有効な戦略についての鋭い意見であり、普遍的な真実ではありません。各自の判断で利用してください。
👉 AI Evals についてさらに学びたい方は、当社の AI Evals コースをご覧ください。これはハンズオン演習とオフィスアワーを備えたライブコホート形式です。読者の方限定で 25% オフの割引コードをご用意しています。 👈
この FAQ の音声版を聴く
AI によるナレーションの音声版を聴きたい場合は、こちらで再生できます。
Hamel Husain · LLM Evals FAQ
入門と基礎知識
Q: LLM Evals(大規模言語モデルの評価)とは何ですか?
製品固有の LLM Evals(基盤モデルのベンチマークではありません)に全く初めて触れる場合は、以下の投稿をご覧ください:パート 1、パート 2、そしてパート 3。それ以外の場合は、以下をお読みください。
あなたの AI プロダクトには評価システム(Eval Systems)が必要です
目次:
動機
迅速なイテレーションこそが成功の鍵
ケーススタディ:不動産向け AI アシスタント「Lucy」
評価の種類
レベル 1:ユニットテスト
レベル 2:人間による評価とモデルによる評価
レベル 3:A/B テスト
RAG(Retrieval-Augmented Generation)の評価
評価システムが無料で超能力を解放する
ファインチューニング
データ合成とキュレーション
デバッグ
ビジネス成果を導く「LLM-as-a-Judge(大規模言語モデルによる評価者)」の構築
目次:
問題点:AI チームがデータに溺れている
ステップ 1:主要なドメインエキスパートを見つける
ステップ 2:データセットを作成する
ステップ 3:ドメイン専門家に批判的評価を伴う合格・不合格の判断を行わせる
ステップ 4:エラーを修正する
ステップ 5:LLM を判事として構築し、反復的に改善する
ステップ 6:エラー分析を実行する
ステップ 7:より専門的な LLM 判事を作成する(必要な場合)
批判的評価の模倣に関する振り返り
リソース

AI プロダクトを迅速に改善するためのフィールドガイド
目次:
エラー分析がいかにして最も ROI(投資対効果)の高い改善点を一貫して明らかにするか
なぜシンプルなデータビューアが AI にとって最も重要な投資となるのか
ドメイン専門家(エンジニアのみならず)に AI の改善を任せる方法
合成データが思っている以上に効果的な理由
評価システムへの信頼を維持する方法
なぜ AI ロードマップは機能ではなく実験数をカウントすべきか
↗ フォーカスビュー
Q:トレースとは何か?
A:トレースとは、単一の初期ユーザークエリから最終レスポンスに至るまでのすべてのアクション、メッセージ、ツール呼び出し、データ取得の完全な記録です。これには、セッション内のすべてのエージェント、ツール、システムコンポーネントにわたる各ステップが含まれます:複数のユーザーメッセージ、アシスタントからの応答、取得されたドキュメント、および中間的なツールの相互作用。
用語に関する注記:異なる観測性ベンダーは、トレースとスパンの定義において異なる基準を使用しています。アレックス・ストリック・ファン・リンショテン(Alex Strick van Linschoten)による分析がこれらの相違点を浮き彫りにしています(以下のスクリーンショット参照):
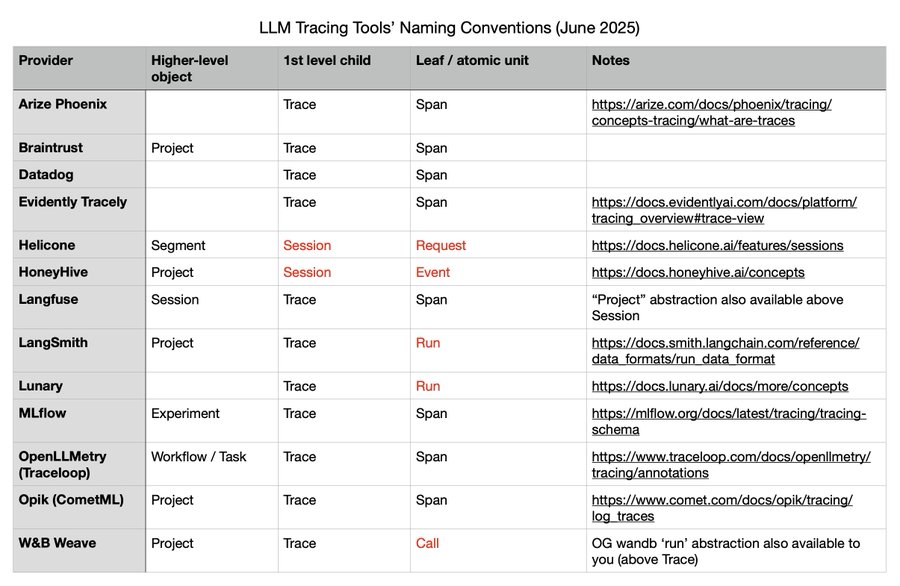
2025 年 7 月 2 日時点のベンダー間のトレース定義の違い
↗ フォーカスビュー
Q: 最小限の実用的な評価セットアップとは何ですか?
インフラ構築よりもまずエラー分析から始めましょう。重要な変更を加えるたびに、20〜50 件の LLM(大規模言語モデル)の出力を手動で 30 分ほどレビューしてください。品質判断を行うのは、ユーザーを理解しているドメイン専門家 1 名に任せます(これを「善政的な独裁者」と呼びましょう)。
可能であれば、ノートブックを使用してトレースのレビューやデータの分析を支援しましょう。私たちの見解では、これが評価において最も効果的な単一のツールです。なぜなら、任意のコードを書いたり、データを可視化したり、迅速に反復処理を行ったりできるからです。この動画で示されているように、ノートブック内で独自の注釈インターフェースを構築することも可能です。
↗ フォーカスビュー
Q: 開発予算のうち、評価にどの程度割り当てるべきですか?
評価は別個の項目としてではなく、デバッグがソフトウェア開発の一部であるのと同様に、開発プロセスの一部であると認識することが重要です。
常にエラー分析を行う必要があります。エラー分析を通じて問題が発見された場合、その多くはすぐに修正できる単純なバグです。これらの修正には、特別な評価インフラは不要です。なぜなら、これらは単に開発プロセスの一部だからです。
自動評価器を構築するかどうかの判断は、コスト対効果の分析にかかっています。簡単なアサートや正規表現チェックでエラーを検出できる場合、そのコストは最小限であり、おそらく価値があるでしょう。しかし、LLM-as-judge(LLM を裁判官として用いる)評価器との整合性を必要とする場合は、その失敗モードがその投資に値するかどうかを検討してください。
私たちが携わったプロジェクトでは、開発時間の60〜80%をエラー分析と評価に費やしてきました。あなたの努力の大部分は、自動化されたチェックを作成するよりも、失敗を理解すること(つまりデータを調査すること)に向くことを想定してください。
高い評価通過率のために最適化することに警戒してください。もしあなたが評価の100%をパスしているなら、おそらくシステムに対して十分に挑戦できていません。70%の通過率は、実際にはアプリケーションをストレステストするより意味のある評価を示している可能性があります。指標を良く見せるためのものではなく、実際の課題を検出するのに役立つ評価に焦点を当ててください。
↗ Focus view
Q: AI の変化がこれほど速い中で、今日の評価手法は5〜10年後も依然として関連性を持つのでしょうか?
はい。完璧なモデルがあったとしても、それが正しい問題を解決しているかを検証する必要があります。体系的なエラー分析、ドメイン固有のテスト、モニタリングの必要性は今後も重要です。
今日のプロンプトエンジニアリングのトリックは時代遅れになるかもしれませんが、失敗モードを理解する必要は依然としてあります。さらに、LLM(大規模言語モデル)はあなたの心を読むことはできず、研究によると人々は自分の要件を適切に外部化するために LLM の行動を観察する必要があることが示されています。
この議論についてより深い視点を得るには、以下の2つの見解を参照してください:「モデルが製品である」対「モデルは製品ではない」。
「モデルが製品である」:
「モデルは製品ではない」:
↗ Focus view
Q: チームに対して評価への投資の必要性をどのように説得すればよいでしょうか?
チームに「評価(evals)」という言葉を売り込もうとしないでください。代わりに、データを分析して何が見つかったかを見せましょう。
まずは自分でエラー分析を行いましょう。50 件から 100 件の実際のユーザー会話を見て、製品が最も頻繁に失敗しているパターンを見つけ出します。これらの発見を基に、データを用いた物語を構築してください。
チームには以下を示しましょう:
- 発見した主要な失敗モードのリスト
- 高インパクトのエラーが発生する頻度を示すメトリクス(metrics)
- ユーザーが製品と対話している驚くべき方法に関する報告
- 「本番環境での問題発生を防止した」という文脈で提示した、発見して修正したバグに関するレポート
このアプローチは信頼関係を築きます。ダッシュボードやメトリクスをただ見せるのではなく、データから何が明らかになっているのかという物語を語ってください。発見を語りかけることで、チームにあなたが学んでいることを教え、即座に価値を提供できます。問題を解決したら、その特定の問題に関するエラー率がどのように低下したかを示しましょう。そうすれば、チームはすぐに進捗を目にし、「どうやってそれを達成しているのか」と尋ねるようになります。方法ではなく結果が会話を主導するようにしてください。
これは、成果が不確実で、実験の反復に制約される古典的な機械学習プロジェクトと似ています。このような状況では、各実験からの学びを共有して進捗を示し、投資を促すことが重要です。
↗ フォーカスビュー
エラー分析 & データ収集
Q: なぜ「エラー分析」は LLM 評価(LLM evals)においてそれほど重要なのか、またどのように実施されるのか?
エラー分析は、評価において最も重要な活動です。エラー分析を行うことで、最初にどのような評価を実施すべきかを決定できます。これにより、アプリケーションやデータ固有の失敗モードを特定することが可能になります。このプロセスには以下の手順が含まれます:
- データセットの作成
LLM とのユーザーインタラクションを代表するトレースを集めることです。もしデータが存在しない場合は、着手するために合成データを生成することもできます。
- オープンコーディング
人間のアノテーター(理想的には善政的な独裁者)がトレースを検証し、オープンエンドなメモを作成して問題点を記録します。このプロセスは「ジャーナリング」に似ており、質的研究手法から適応されたものです。開始時には、上流のエラーが下流の問題を引き起こす可能性があるため、トレース内で最初に観察される失敗に注力して記録することが推奨されますが、可能であればすべての独立した失敗にタグを付けることもできます。このステップはドメインエキスパートが行うべきです。
- 軸コーディング(Axial Coding)
オープンエンドなメモを「失敗分類体系」にカテゴライズします。つまり、類似する失敗を明確なカテゴリにグループ化することです。これが最も重要なステップです。最後に、各カテゴリ内の失敗数をカウントします。このステップには LLM を活用することもできます。
- 反復的改善
理論的飽和状態に達するまで、より多くのトレースに対して反復的に改善を続けます。つまり、新しいトレースが新たな失敗モードや情報を明らかにしない状態に至るまでです。目安として、少なくとも 100 のトレースを検証することを目標とするべきです。
このプロセスは頻繁に見直す必要があります。クラスタリングやユーザーフィードバックによるソート、高確率の失敗パターンによるソートなど、データをより効率的にサンプリングするための高度な方法もあります。時間が経つにつれ、データ内のどこで失敗を探すかを見極める「勘」が養われます。
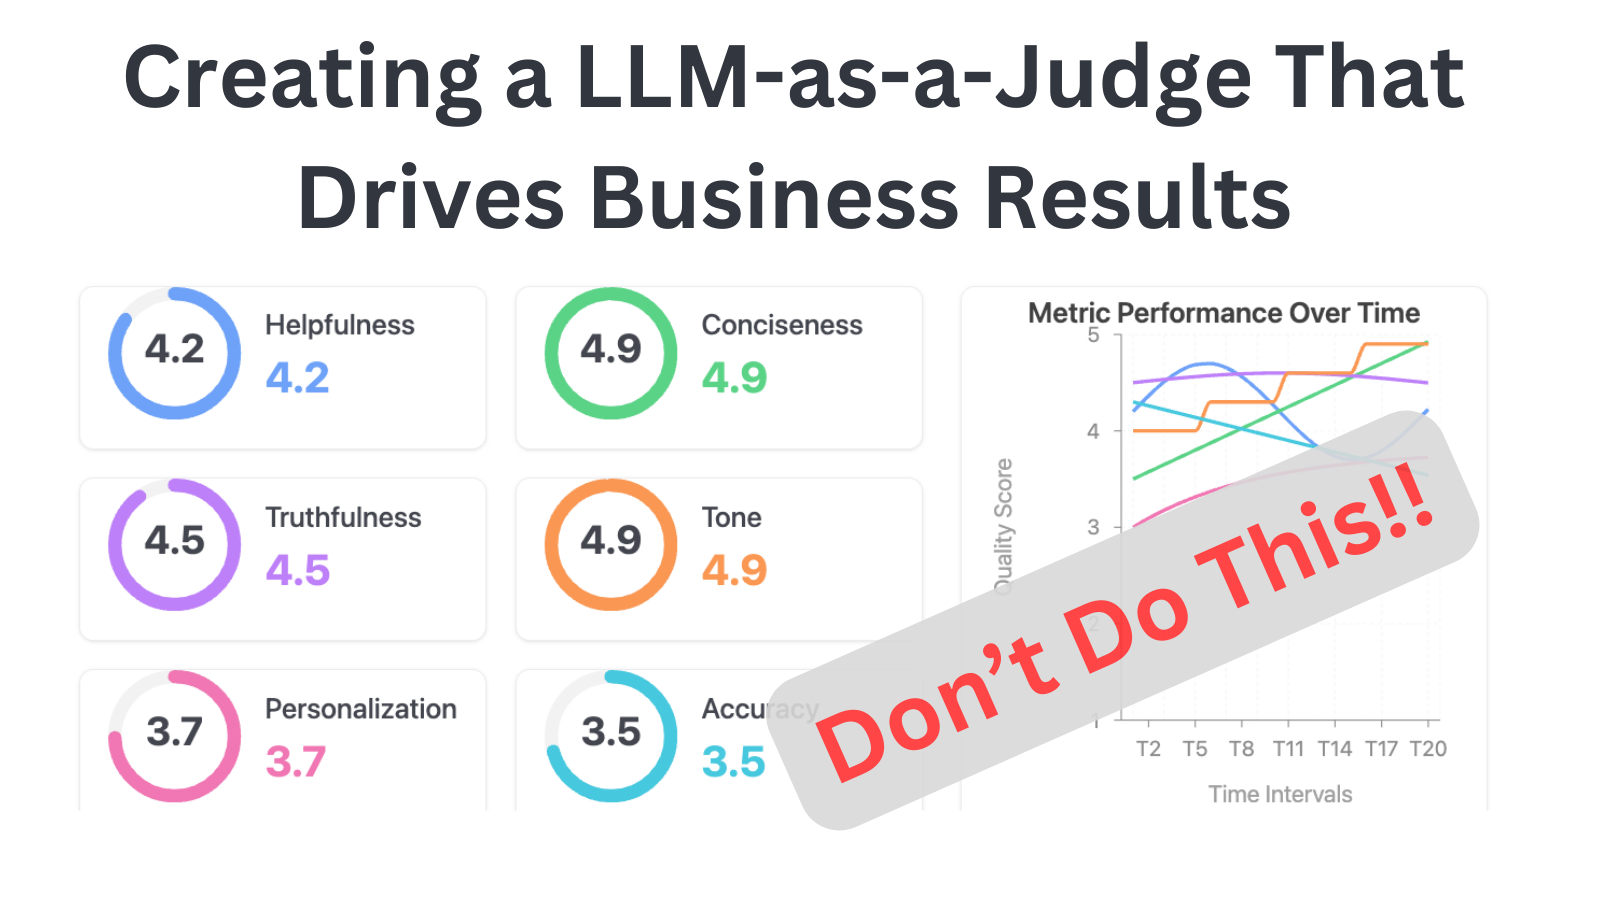
エラー分析を省略してはいけません。これにより、開発した評価指標が実用的なアプリケーションの振る舞いに支えられたものとなり、逆効果となる一般的な指標(多くのプラットフォームが使用を促すような)に依存しなくなります。エラー分析がどのように役立つかの例については、こちらの動画またはこちらのブログ記事をご覧ください。
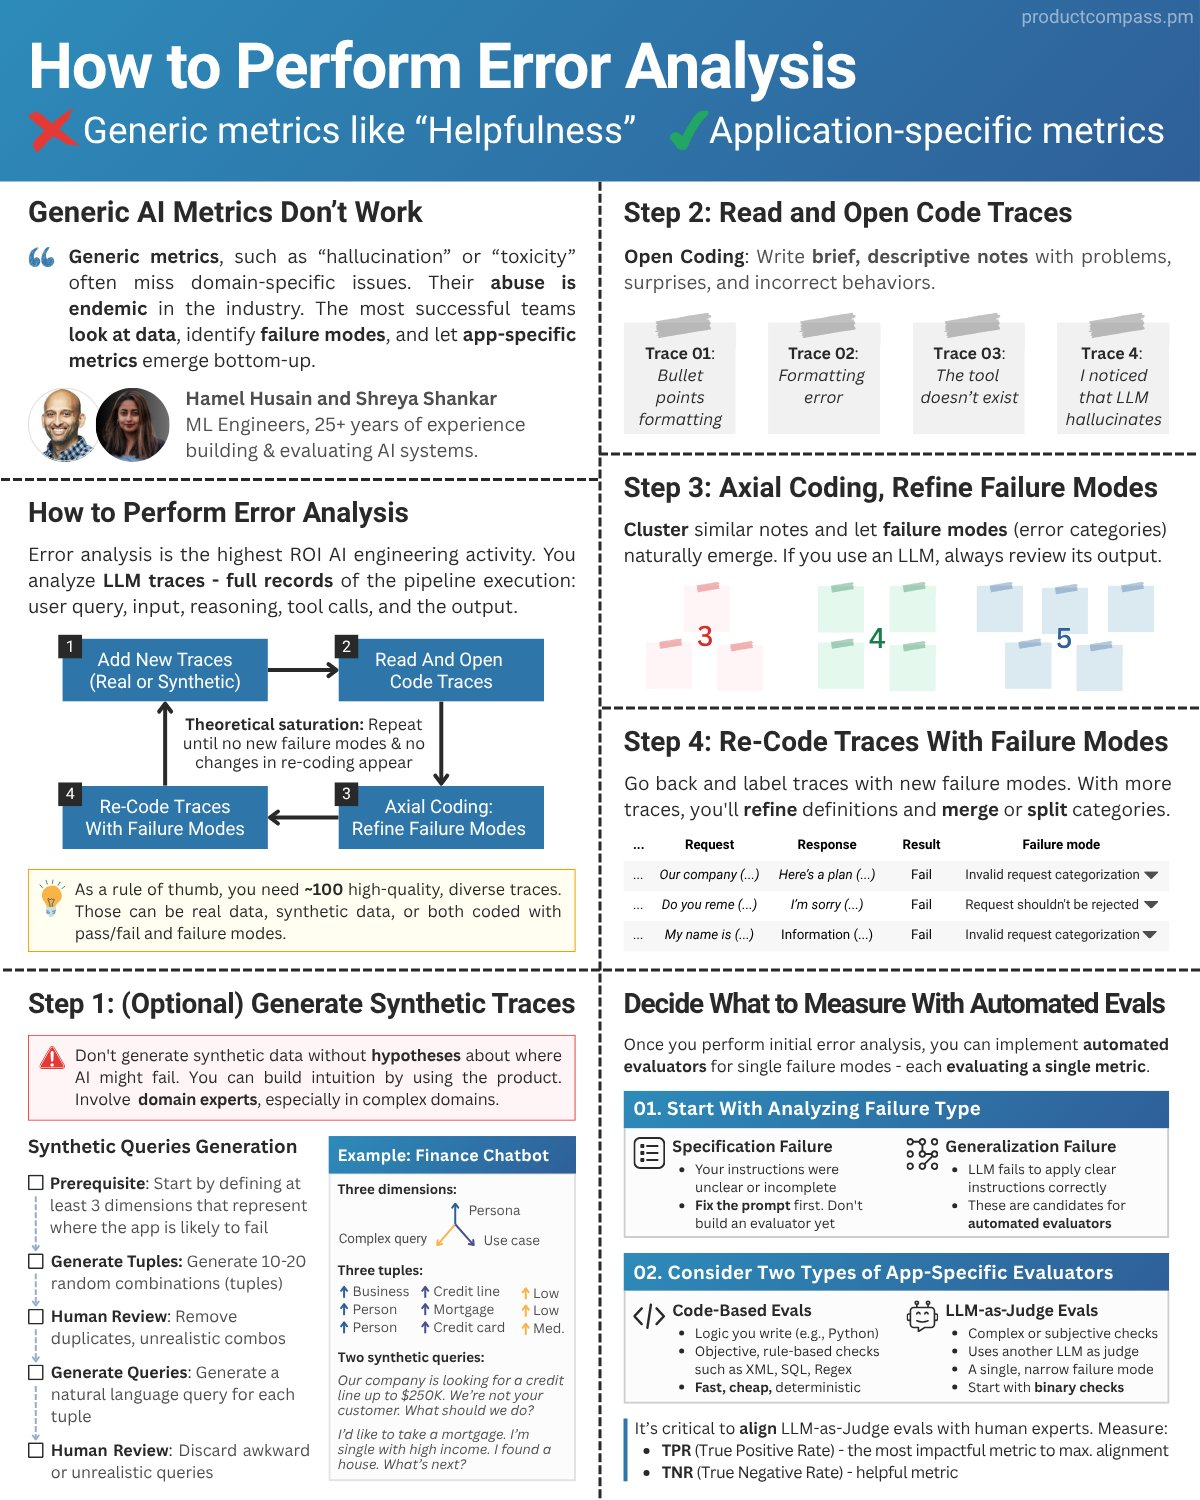
学生のパウェル・フリン(Pawel Huryn)によるエラー分析プロセスの可視化と、それが全体の評価プロセスにどう組み込まれるかを示した図を以下に示します:
↗ フォーカスビュー
Q: ユーザーフィードバック以外で、レビュー対象となる問題のあるトレース(trace)をどのように浮き彫りにすればよいですか?
ユーザーフィードバックは問題のあるトレースに絞り込む良い方法ですが、他の手法も有用です。以下に3 つの補完的なアプローチを示します。
ランダムサンプリングから始める
最もシンプルなアプローチは、トレースのランダムサンプルを検証することです。もし問題がほとんど見つからない場合は、ストレステストへとエスカレートしてください:プロンプトの制約を意図的にテストするクエリを作成し、AI がルールに従っているかを確認します。
評価(evals)を初期スクリーニングに活用する
既存の評価(evals)を使用して問題のあるトレースや潜在的な課題を見つけます。これら特定した後、エラー分析から始めるという通常の評価プロセスに進むことができます。
効率的なサンプリング戦略を活用する
より洗練されたトレース発見のためには、外れ値検出、指標に基づくソート、層化サンプリングを用いて興味深いトレースを見つけましょう。汎用的な指標は、品質を直接測定していなくても、見直す価値のあるトレースを特定するための探索シグナルとして機能します。
↗ フォーカスビュー
Q: 本番システムでエラー分析をどのくらいの頻度で再実行すべきですか?
新機能の追加、プロンプトの更新、モデルの切り替え、または主要なバグ修正など、重要な変更を加えた際にエラー分析を再実行してください。有用なヒューリスティックとして、各レビューサイクルで少なくとも 100 件以上の新しいトレースを見直す目標を設定することが挙げられます。私たちが観察した典型的なレビューサイクルは 2〜4 週間程度です。効果的なトレースのサンプリング方法については、こちらの FAQ を参照してください。
主要な分析の間には、週に 10〜20 件のトレースをレビューし、外れ値に焦点を当てましょう。具体的には、異常に長い会話、複数回のリトライを含むセッション、または自動モニタリングによってフラグが立てられたトレースなどが該当します。システムの安定性と利用量の増加に応じて頻度を調整してください。新しいシステムでは、障害のパターンが安定するまで週次での分析が必要です。成熟したシステムでは、利用パターンに変化がない限り月次の分析で十分かもしれません。ただし、インシデント発生後、ユーザーからの苦情が急増した場合、または指標のドリフトが生じた場合は必ず分析を行ってください。利用量の拡大は新たなエッジケースをもたらします。
↗ フォーカスビュー
Q: 合成データを生成するための最良のアプローチは何ですか?
LLM に構造化されていない「テストクエリをください」とプロンプトするだけの一般的なミスは、汎用的で反復的な出力を生み出す結果となります。一方、次元(dimensions)を用いた構造化アプローチは、LLM アプリケーションのテスト用合成データにおいてはるかに優れた成果をもたらします。
まず、次元を定義することから始めましょう。これはユーザークエリの異なる側面を記述するカテゴリです。各次元は、ユーザー行動における一種類の変動を捉えます。例えば:
レシピアプリの場合、次元には「食事制限(ビーガン、グルテンフリー、なし)」「料理の種類(イタリアン、アジア系、コンフォートフード)」「クエリの複雑さ(単純なリクエスト、多段階、エッジケース)」などが含まれます。
カスタマーサポートボットの場合、次元は「問題タイプ(請求、技術的、一般)」「顧客の気分(イライラしている、中立的、満足している)」「事前の文脈(新規の問題、フォローアップ、解決済み)」などとなります。
失敗仮説から始めましょう。失敗モードに関する直感が乏しい場合は、アプリケーションを徹底的に使用するか、友人らに利用してもらうことで検証します。その後、それらの可能性の高い失敗に対応する次元を選択します。
まず手動でタプルを作成しましょう:各次元から1 つの値を選択した具体的な組み合わせ 20 個を手書きで作成します。例:(ビーガン、イタリアン、多段階)。この手作業により、問題領域を深く理解できます。
2 ステップ生成法でスケーリングします:
構造化されたタプルの生成:LLM に(グルテンフリー、アジア系、シンプル)のようなさらなる組み合わせを作成させます。
タプルからクエリへの変換:別のプロンプトで、各タプルを自然言語に変換します。
この分離により、繰り返しの表現を避けることができます。(ビーガン、イタリア料理、多段階) のタプルは次のようになります。「前日に準備できる乳製品不使用のラザニアのレシピが必要です。」
生成アプローチ
タプルを生成する方法は 2 つあります。
クロス積後にフィルタリング: すべての次元組み合わせを生成し、LLM でフィルタリングします。エッジケースを含む網羅性を保証します。ほとんどの組み合わせが有効な場合に使用してください。
直接 LLM による生成: LLM に直接タプルの生成を依頼します。より現実的ですが、汎用的な出力に偏りやすく、稀なシナリオを見逃す傾向があります。多くの次元組み合わせが無効な場合に使用してください。
明らかな問題は最初に修正する: すぐに修正できる問題に対して合成データを生成しないでください。プロンプトで食事制限について言及されていない場合は、特別なテストクエリを生成するのではなく、プロンプト自体を修正してください。
タプルとプロンプトの反復を経て、これらの合成クエリを実際のシステムに実行させ、完全なトレースを取得します。エラー分析のために 100 件のトレースをサンプリングします。この数は、圧倒されることなく手動レビューを行い、失敗パターンを特定するのに十分な数です。
↗ フォーカスビュー
Q: 合成データが信頼できないシナリオはありますか?
はい:合成データは誤解を招いたり、問題を隠蔽したりする可能性があります。適切な場合に合成データを生成する方法に関するガイダンスについては、「合成データを生成するための最良のアプローチは何ですか?」をご覧ください。
合成データが失敗する一般的なシナリオ:
複雑なドメイン固有のコンテンツ:LLM は、専門文書(例:法的書類、医療記録、技術フォーム)の構造、ニュアンス、あるいは特有の癖を見逃すことがよくあります。実際の事例がないと、重要なエッジケースが見過ごされてしまいます。
低リソース言語や方言:低リソース言語や方言においては、LLM が生成したサンプルは非現実的なものになりがちです。それらに基づく評価は、実際の性能を反映しません。
検証が不可能な場合:ドメインの複雑さや正解データの欠如により、合成サンプルの現実性を検証できない場合は、正確な評価のために実データが重要になります。
高リスクなドメイン:医療、法務、緊急対応といった高リスクなドメインでは、合成データは微妙なニュアンスやエッジケースを欠くことが多く、そこで生じるエラーには深刻な結果が伴います。また、手動での検証も困難です。
代表性の低いユーザーグループ:代表性の低いユーザーグループにおいては、LLM が文脈、価値観、あるいは課題を誤って表現する可能性があります。合成データは、LLM の学習データに含まれるバイアスを強化してしまう恐れがあります。
↗ フォーカスビュー
Q: システムが多様なユーザークエリを扱う場合、どのように評価アプローチを取ればよいですか?
複雑なアプリケーションでは、非常に異なるクエリパターンをサポートすることが多く、「返品ポリシーはどうなっていますか?」から「これらの条件に一致する製品について、地域ごとの価格動向を比較してください」まで様々です。各クエリタイプはシステムの異なる機能を試すため、評価基準をどのように設計すべきか混乱が生じることがあります。
エラー分析こそがすべてです。評価戦略は、事前に定義されたクエリ分類ではなく、観察された失敗パターン(例えばエラー分析)から導き出すべきです。想像できるあらゆるクエリタイプを網羅する巨大な評価マトリクスを作成するのではなく、システムの実際の挙動に基づいて、どこに評価の労力を投資すべきかを決めるべきです。
エラー分析を行うと、特定のクエリカテゴリが共通の失敗パターンを示すことが多く発見されます。例えば、時間的な推論を必要とするすべてのクエリは、単純な参照であっても複雑な集計であっても、いずれも困難に直面する可能性があります。同様に、複数のソースから情報を統合する必要があるクエリは、一貫した方法で失敗することがあります。エラー分析を通じて発見されたこれらのパターンが、評価の優先順位を決めるべき根拠となります。クエリカテゴリが失敗をグループ化する有効な手段である可能性もありますが、データを分析するまでそれは分かりません。
基本的なエラー分析の実践例については、こちらの動画をご覧ください。
↗ フォーカスビュー
Q: 監査のために生産環境のトレースを効率的にサンプリングするにはどうすればよいですか?
ランダムにトレースを検査するのは骨が折れる作業であり、特にエラーが含まれていないトレースが大半を占める場合、その負担は大きくなります。これらのサンプリング戦略により、問題が発見される可能性の高いトレースを効率的に見つけることができます:
外れ値検出:任意のメトリクス(応答長さ、レイテンシ、ツール呼び出しなど)でソートし、極端な値を検査する。
ユーザーフィードバック信号:ネガティブなフィードバック、サポートチケット、エスカレーションが含まれるトレースを優先的に扱う。
メトリクスに基づくソート:汎用的なメトリクスは、興味深いトレースを見つけるための探索シグナルとして機能します。高スコアと低スコアの両方をレビューし、それらを探索の手がかりとして扱ってください。そこで得た知見に基づき、発見した失敗モードに対応するカスタム評価器を構築できます。
層別サンプリング:トレースを主要な次元(ユーザータイプ、機能、クエリカテゴリなど)でグループ化し、各グループからサンプリングします。
埋め込みクラスタリング:クエリの埋め込み(embedding)を生成してクラスタリングし、自然なグループ化を明らかにします。各クラスタからは比例してサンプリングしますが、エッジケースのために小規模なクラスタは過剰にサンプリングしてください。クラスタリングに正解はありません—これは手動では見逃す可能性のあるパターンを表面化するための探索手法です。
サンプリングの手法が洗練されるにつれ、これらの戦術を注釈ツールの設計に取り入れることができます。
↗ フォーカスビュー
👉 AI Evals についてさらに学びたいですか?当社の AI Evals コースをご覧ください。ハンズオン演習とオフィスアワーを備えたライブコホート形式です。読者向けに 25% オフの割引コードをご用意しています。 👈
評価設計と手法
Q: なぜ 1-5 段階の評価(リッカート尺度)ではなく、バイナリ(合格/不合格)評価を推奨するのですか?
エンジニアは往々にして、リッカート尺度(1-5 段階の評価)の方がバイナリ評価よりも多くの情報を提供し、漸進的な改善を追跡できると考えがちです。しかし、この追加の複雑さは実際には解決すべき問題よりも新たな問題を多く生み出す傾向があります。
バイナリ評価は、より明確な思考と一貫したラベル付けを強制します。リッカート尺度は重大な課題をもたらします:隣接するポイント間の違い(例えば 3 と 4 の差)は主観的であり、アノテーター間で一貫性がなく、統計的な差異を検出するには大規模なサンプルサイズが必要となり、またアノテーターは困難な決定を避けるために中位値に依存しがちです。
バイナリオプションがあることで、人々は不確実性を中位値に隠すのではなく、意思決定を迫られます。エラー分析の際にも、バイナリ判断の方が迅速に行えます。3 か 4 のどちらかについて議論する時間を浪費する必要がないからです。
漸進的な改善を追跡する場合は、尺度を使用する代わりに、独自のバイナリチェックを持つ特定のサブコンポーネントを測定することを検討してください。例えば、事実の正確性を 1 から 5 で評価するのではなく、「期待される 5 つの事実のうち 4 つが含まれている」という項目を個別のバイナリチェックとして追跡します。これにより、進捗を測定できる能力を維持しつつ、明確で客観的な基準を保つことができます。
まずはバイナリラベルから始め、『悪い』状態がどのようなものかを理解しましょう。数値ラベルは高度なものであり、通常は必要ありません。
↗ フォーカスビュー
Q: 評価駆動型開発を practice すべきでしょうか?
一般的には否です。評価駆動型開発(機能を実装する前に評価器を作成すること)は魅力的に思えますが、解決する問題よりも新たな問題を多く生み出します。従来のソフトウェアでは失敗モードが予測可能であるのに対し、LLM は潜在的な失敗に対する無限の表面領域を持っています。何が壊れるかを事前に予測することはできません。
より良いアプローチは、エラー分析から始めることです。想像上のエラーではなく、実際に発見したエラーに対して評価器(evaluator)を作成してください。これにより、何を評価すべきかで詰まることを避け、実際のシステム品質に影響を与えない指標への無駄な労力を防止できます。
例外:評価駆動型開発(Eval-driven development)は、特定の制約条件下では機能する可能性があります
原文を表示
This document curates the most common questions Shreya and I received while teaching 700+ engineers & PMs AI Evals. Warning: These are sharp opinions about what works in most cases. They are not universal truths. Use your judgment.
👉 Want to learn more about AI Evals? Check out our AI Evals course. It’s a live cohort with hands on exercises and office hours. Here is a 25% discount code for readers. 👈
Listen to the audio version of this FAQ
If you prefer to listen to the audio version (narrated by AI), you can play it here.
Hamel Husain · LLM Evals FAQ
Getting Started & Fundamentals
Q: What are LLM Evals?
If you are completely new to product-specific LLM evals (not foundation model benchmarks), see these posts: part 1, part 2 and part 3. Otherwise, keep reading.
Your AI Product Needs Eval (Evaluation Systems)
Contents:
Motivation
Iterating Quickly == Success
Case Study: Lucy, A Real Estate AI Assistant
The Types Of Evaluation
Level 1: Unit Tests
Level 2: Human & Model Eval
Level 3: A/B Testing
Evaluating RAG
Eval Systems Unlock Superpowers For Free
Fine-Tuning
Data Synthesis & Curation
Debugging
Creating a LLM-as-a-Judge That Drives Business Results
Contents:
The Problem: AI Teams Are Drowning in Data
Step 1: Find The Principal Domain Expert
Step 2: Create a Dataset
Step 3: Direct The Domain Expert to Make Pass/Fail Judgments with Critiques
Step 4: Fix Errors
Step 5: Build Your LLM as A Judge, Iteratively
Step 6: Perform Error Analysis
Step 7: Create More Specialized LLM Judges (if needed)
Recap of Critique Shadowing
Resources
A Field Guide to Rapidly Improving AI Products
Contents:
How error analysis consistently reveals the highest-ROI improvements
Why a simple data viewer is your most important AI investment
How to empower domain experts (not just engineers) to improve your AI
Why synthetic data is more effective than you think
How to maintain trust in your evaluation system
Why your AI roadmap should count experiments, not features
↗ Focus view
Q: What is a trace?
A trace is the complete record of all actions, messages, tool calls, and data retrievals from a single initial user query through to the final response. It includes every step across all agents, tools, and system components in a session: multiple user messages, assistant responses, retrieved documents, and intermediate tool interactions.
Note on terminology: Different observability vendors use varying definitions of traces and spans. Alex Strick van Linschoten’s analysis highlights these differences (screenshot below):
Vendor differences in trace definitions as of 2025-07-02
↗ Focus view
Q: What’s a minimum viable evaluation setup?
Start with error analysis, not infrastructure. Spend 30 minutes manually reviewing 20-50 LLM outputs whenever you make significant changes. Use one domain expert who understands your users as your quality decision maker (a “benevolent dictator”).
If possible, use notebooks to help you review traces and analyze data. In our opinion, this is the single most effective tool for evals because you can write arbitrary code, visualize data, and iterate quickly. You can even build your own custom annotation interface right inside notebooks, as shown in this video.
↗ Focus view
Q: How much of my development budget should I allocate to evals?
It’s important to recognize that evaluation is part of the development process rather than a distinct line item, similar to how debugging is part of software development.
You should always be doing error analysis. When you discover issues through error analysis, many will be straightforward bugs you’ll fix immediately. These fixes don’t require separate evaluation infrastructure as they’re just part of development.
The decision to build automated evaluators comes down to cost-benefit analysis. If you can catch an error with a simple assertion or regex check, the cost is minimal and probably worth it. But if you need to align an LLM-as-judge evaluator, consider whether the failure mode warrants that investment.
In the projects we’ve worked on, we’ve spent 60-80% of our development time on error analysis and evaluation. Expect most of your effort to go toward understanding failures (i.e. looking at data) rather than building automated checks.
Be wary of optimizing for high eval pass rates. If you’re passing 100% of your evals, you’re likely not challenging your system enough. A 70% pass rate might indicate a more meaningful evaluation that’s actually stress-testing your application. Focus on evals that help you catch real issues, not ones that make your metrics look good.
↗ Focus view
Q: Will today’s evaluation methods still be relevant in 5-10 years given how fast AI is changing?
Yes. Even with perfect models, you still need to verify they’re solving the right problem. The need for systematic error analysis, domain-specific testing, and monitoring will still be important.
Today’s prompt engineering tricks might become obsolete, but you’ll still need to understand failure modes. Additionally, a LLM cannot read your mind, and research shows that people need to observe the LLM’s behavior in order to properly externalize their requirements.
For deeper perspective on this debate, see these two viewpoints: “The model is the product” versus “The model is NOT the product”.
“The model is the product”:
“The model is NOT the product”:
↗ Focus view
Q: How do I make the case for investing in evaluations to my team?
Don’t try to sell your team on “evals”. Instead, show them what you find when you look at the data.
Start by doing the error analysis yourself. Look at 50 to 100 real user conversations and find the most common ways the product is failing. Use these findings to tell a story with data.
Present your team with:
A list of the top failure modes you discovered.
Metrics showing how often high-impact errors are happening.
Surprising ways that users are interacting with the product.
Reports on the bugs you found and fixed, framed as “prevented production issues”.
This approach builds trust. Don’t just show dashboards and metrics; tell the story of what you’re finding in the data. By narrating your findings, you teach the team what you’re learning, providing immediate value. When you fix an issue, show how the error rate for that specific problem went down. Soon, your team will see the progress and ask how you’re doing it. Let results instead of methods lead the conversation.
This is similar to classic machine learning projects, where outcomes are speculative and progress is bounded by iterating on experiments. In this situation, it’s important that you share the learnings from each experiment to show progress and encourage investment.
↗ Focus view
Error Analysis & Data Collection
Q: Why is "error analysis" so important in LLM evals, and how is it performed?
Error analysis is the most important activity in evals. Error analysis helps you decide what evals to write in the first place. It allows you to identify failure modes unique to your application and data. The process involves:
- Creating a Dataset
Gathering representative traces of user interactions with the LLM. If you do not have any data, you can generate synthetic data to get started.
- Open Coding
Human annotator(s) (ideally a benevolent dictator) review and write open-ended notes about traces, noting any issues. This process is akin to “journaling” and is adapted from qualitative research methodologies. When beginning, it is recommended to focus on noting the first failure observed in a trace, as upstream errors can cause downstream issues, though you can also tag all independent failures if feasible. A domain expert should be performing this step.
- Axial Coding
Categorize the open-ended notes into a “failure taxonomy.”. In other words, group similar failures into distinct categories. This is the most important step. At the end, count the number of failures in each category. You can use a LLM to help with this step.
- Iterative Refinement
Keep iterating on more traces until you reach theoretical saturation, meaning new traces do not seem to reveal new failure modes or information to you. As a rule of thumb, you should aim to review at least 100 traces.
You should frequently revisit this process. There are advanced ways to sample data more efficiently, like clustering, sorting by user feedback, and sorting by high probability failure patterns. Over time, you’ll develop a “nose” for where to look for failures in your data.
Do not skip error analysis. It ensures that the evaluation metrics you develop are supported by real application behaviors instead of counter-productive generic metrics (which most platforms nudge you to use). For examples of how error analysis can be helpful, see this video, or this blog post.
Here is a visualization of the error analysis process by one of our students, Pawel Huryn - including how it fits into the overall evaluation process:
↗ Focus view
Q: How do I surface problematic traces for review beyond user feedback?
While user feedback is a good way to narrow in on problematic traces, other methods are also useful. Here are three complementary approaches:
Start with random sampling
The simplest approach is reviewing a random sample of traces. If you find few issues, escalate to stress testing: create queries that deliberately test your prompt constraints to see if the AI follows your rules.
Use evals for initial screening
Use existing evals to find problematic traces and potential issues. Once you’ve identified these, you can proceed with the typical evaluation process starting with error analysis.
Leverage efficient sampling strategies
For more sophisticated trace discovery, use outlier detection, metric-based sorting, and stratified sampling to find interesting traces. Generic metrics can serve as exploration signals to identify traces worth reviewing, even if they don’t directly measure quality.
↗ Focus view
Q: How often should I re-run error analysis on my production system?
Re-run error analysis when making significant changes: new features, prompt updates, model switches, or major bug fixes. A useful heuristic is to set a goal for reviewing at least 100+ fresh traces each review cycle. Typical review cycles we’ve seen range from 2-4 weeks. See this FAQ on how to sample traces effectively.
Between major analyses, review 10-20 traces weekly, focusing on outliers: unusually long conversations, sessions with multiple retries, or traces flagged by automated monitoring. Adjust frequency based on system stability and usage growth. New systems need weekly analysis until failure patterns stabilize. Mature systems might need only monthly analysis unless usage patterns change. Always analyze after incidents, user complaint spikes, or metric drift. Scaling usage introduces new edge cases.
↗ Focus view
Q: What is the best approach for generating synthetic data?
A common mistake is prompting an LLM to "give me test queries" without structure, resulting in generic, repetitive outputs. A structured approach using dimensions produces far better synthetic data for testing LLM applications.
Start by defining dimensions: categories that describe different aspects of user queries. Each dimension captures one type of variation in user behavior. For example:
For a recipe app, dimensions might include Dietary Restriction (vegan, gluten-free, none), Cuisine Type (Italian, Asian, comfort food), and Query Complexity (simple request, multi-step, edge case).
For a customer support bot, dimensions could be Issue Type (billing, technical, general), Customer Mood (frustrated, neutral, happy), and Prior Context (new issue, follow-up, resolved).
Start with failure hypotheses. If you lack intuition about failure modes, use your application extensively or recruit friends to use it. Then choose dimensions targeting those likely failures.
Create tuples manually first: Write 20 tuples by hand—specific combinations selecting one value from each dimension. Example: (Vegan, Italian, Multi-step). This manual work helps you understand your problem space.
Scale with two-step generation:
Generate structured tuples: Have the LLM create more combinations like (Gluten-free, Asian, Simple)
Convert tuples to queries: In a separate prompt, transform each tuple into natural language
This separation avoids repetitive phrasing. The (Vegan, Italian, Multi-step) tuple becomes: "I need a dairy-free lasagna recipe that I can prep the day before."
Generation approaches
You can generate tuples two ways:
Cross product then filter: Generate all dimension combinations, then filter with an LLM. Guarantees coverage including edge cases. Use when most combinations are valid.
Direct LLM generation: Ask the LLM to generate tuples directly. More realistic but tends toward generic outputs and misses rare scenarios. Use when many dimension combinations are invalid.
Fix obvious problems first: Don’t generate synthetic data for issues you can fix immediately. If your prompt doesn’t mention dietary restrictions, fix the prompt rather than generating specialized test queries.
After iterating on your tuples and prompts, run these synthetic queries through your actual system to capture full traces. Sample 100 traces for error analysis. This number provides enough traces to manually review and identify failure patterns without being overwhelming.
↗ Focus view
Q: Are there scenarios where synthetic data may not be reliable?
Yes: synthetic data can mislead or mask issues. For guidance on generating synthetic data when appropriate, see What is the best approach for generating synthetic data?
Common scenarios where synthetic data fails:
Complex domain-specific content: LLMs often miss the structure, nuance, or quirks of specialized documents (e.g., legal filings, medical records, technical forms). Without real examples, critical edge cases are missed.
Low-resource languages or dialects: For low-resource languages or dialects, LLM-generated samples are often unrealistic. Evaluations based on them won’t reflect actual performance.
When validation is impossible: If you can’t verify synthetic sample realism (due to domain complexity or lack of ground truth), real data is important for accurate evaluation.
High-stakes domains: In high-stakes domains (medicine, law, emergency response), synthetic data often lacks subtlety and edge cases. Errors here have serious consequences, and manual validation is difficult.
Underrepresented user groups: For underrepresented user groups, LLMs may misrepresent context, values, or challenges. Synthetic data can reinforce biases in the training data of the LLM.
↗ Focus view
Q: How do I approach evaluation when my system handles diverse user queries?
Complex applications often support vastly different query patterns—from “What’s the return policy?” to “Compare pricing trends across regions for products matching these criteria.” Each query type exercises different system capabilities, leading to confusion on how to design eval criteria.
Error Analysis is all you need. Your evaluation strategy should emerge from observed failure patterns (e.g. error analysis), not predetermined query classifications. Rather than creating a massive evaluation matrix covering every query type you can imagine, let your system’s actual behavior guide where you invest evaluation effort.
During error analysis, you’ll likely discover that certain query categories share failure patterns. For instance, all queries requiring temporal reasoning might struggle regardless of whether they’re simple lookups or complex aggregations. Similarly, queries that need to combine information from multiple sources might fail in consistent ways. These patterns discovered through error analysis should drive your evaluation priorities. It could be that query category is a fine way to group failures, but you don’t know that until you’ve analyzed your data.
To see an example of basic error analysis in action, see this video.
↗ Focus view
Q: How can I efficiently sample production traces for review?
It can be cumbersome to review traces randomly, especially when most traces don’t have an error. These sampling strategies help you find traces more likely to reveal problems:
Outlier detection: Sort by any metric (response length, latency, tool calls) and review extremes.
User feedback signals: Prioritize traces with negative feedback, support tickets, or escalations.
Metric-based sorting: Generic metrics can serve as exploration signals to find interesting traces. Review both high and low scores and treat them as exploration clues. Based on what you learn, you can build custom evaluators for the failure modes you find.
Stratified sampling: Group traces by key dimensions (user type, feature, query category) and sample from each group.
Embedding clustering: Generate embeddings of queries and cluster them to reveal natural groupings. Sample proportionally from each cluster, but oversample small clusters for edge cases. There’s no right answer for clustering—it’s an exploration technique to surface patterns you might miss manually.
As you get more sophisticated with how you sample, you can incorporate these tactics into the design of your annotation tools.
↗ Focus view
👉 Want to learn more about AI Evals? Check out our AI Evals course. It’s a live cohort with hands on exercises and office hours. Here is a 25% discount code for readers. 👈
Evaluation Design & Methodology
Q: Why do you recommend binary (pass/fail) evaluations instead of 1-5 ratings (Likert scales)?
Engineers often believe that Likert scales (1-5 ratings) provide more information than binary evaluations, allowing them to track gradual improvements. However, this added complexity often creates more problems than it solves in practice.
Binary evaluations force clearer thinking and more consistent labeling. Likert scales introduce significant challenges: the difference between adjacent points (like 3 vs 4) is subjective and inconsistent across annotators, detecting statistical differences requires larger sample sizes, and annotators often default to middle values to avoid making hard decisions.
Having binary options forces people to make a decision rather than hiding uncertainty in middle values. Binary decisions are also faster to make during error analysis - you don’t waste time debating whether something is a 3 or 4.
For tracking gradual improvements, consider measuring specific sub-components with their own binary checks rather than using a scale. For example, instead of rating factual accuracy 1-5, you could track “4 out of 5 expected facts included” as separate binary checks. This preserves the ability to measure progress while maintaining clear, objective criteria.
Start with binary labels to understand what ‘bad’ looks like. Numeric labels are advanced and usually not necessary.
↗ Focus view
Q: Should I practice eval-driven development?
Generally no. Eval-driven development (writing evaluators before implementing features) sounds appealing but creates more problems than it solves. Unlike traditional software where failure modes are predictable, LLMs have infinite surface area for potential failures. You can’t anticipate what will break.
A better approach is to start with error analysis. Write evaluators for errors you discover, not errors you imagine. This avoids getting blocked on what to evaluate and prevents wasted effort on metrics that have no impact on actual system quality.
Exception: Eval-driven development may work for specific constrai
関連記事
AWS で現代的なデータメッシュ戦略を用いたエージェント型 AI アプリケーションの構築
AWS は、顧客サービスエージェントが自律的にデータベースを照会し回答を合成する際、組織内の複数のデータソースにまたがるガバナンスアクセスが必要であると指摘。現代のデータメッシュでは、データ相互作用チェーンの各層で厳密なアクセス制御を適用することが重要であるとしている。
SmithDB の全文検索用逆インデックス構築の仕組み
LangChain チームが、SmithDB で高速な全文検索を実現するために採用した逆インデックスの設計手法と実装プロセスを解説している。
2026 年に AI エンジニアになるためのロードマップ
KDnuggets が、2026 年までに AI エンジニアとして活躍するための学習ロードマップを提示している。
今日のまとめ
AI日報で今日の重要ニュースをまとめ読み