METR、最適化能力を測定する「Expenditure Horizon」手法と NanoGPT の適用例を発表
本文の状態
日本語全文を表示中
詳細モードで約21分の本文を読めます。
同じ出来事の情報源
この情報源を基点に整理
METR
METR は AI エージェントの最適化能力を測定する「支出ハライズン」指標を提案し、NanoGPT の事例から人間と AI のコスト効率性が交差する予算点を算出した。
AI深層分析を開く2026年8月1日 13:54
AI深層分析
キーポイント
支出ハライズの定義
AI エージェントの最適化能力を評価する指標として、人間の努力に対するリターン曲線と AI の実行コスト曲線が交差する予算点を「支出ハライズ」と定義した。
NanoGPT における実証データ
NanoGPT の最適化事例において、人間による 1% の改善には約 2,500 ドルの人件費が必要であり、AI エージェントによる先行実験では 1 万ドル以上の支出後に 0〜3,000 ドルが支出ハライズと推定された。
AI 研究加速の測定課題
AI が自身の研究開発を加速させる度合いを評価する際、トークンコスト、計算リソースのコスト、および人件費をどう考慮するかが主要な難点であると指摘した。
既存ベンチマークの限界
現在のAI R&Dベンチマークは人間ベースラインの欠如や玩具的な問題設定が多く、最先端アルゴリズムへの貢献能力を反映していない。
生産性向上データの解釈難易度
コード量増加などの自己報告データは存在するが、R&Dにおける実際の生産性向上に直結させることは困難である。
重要な引用
We propose a measure of an AI agent's optimization ability with an 'expenditure horizon.'
the budget at which humans become more cost-effective than AIs.
on the margin, each 1% improvement costs very roughly $2,500 in human labor.
An agent's "expenditure horizon" gives a quantitative measure of agentic optimization ability.
編集コメントを表示
編集コメント
METR が提示した「支出ハライズ」の概念は、AI エージェントの実用性を評価する際のコスト面での新たな基準となり得る。特に AI によるアルゴリズム最適化が人間を凌駕する転換点を数値で捉える試みは、今後の AI 研究の方向性を示唆する重要な指標である。
Source Article
元記事を日本語で読む
本文に関係しない購読案内、埋め込み通知、サイト内プロモーションは除いています。
AI エージェントの最適化能力を測る指標として、「支出ハライズン(Expenditure Horizon)」を提案します。本稿では、NanoGPT における実証例を通じてその概念を解説します。
スピードラン
AI が自身の研究開発を加速させる能力を測定する際の難しさの一つは、トークンコストや実験計算コスト、そして人的労働コストをどう考慮するかです。人間とエージェントの両方について、コストに対する性能を関数として推定できれば、「支出限界(expenditure horizon)」を測定できます。これは、人間の曲線と AI の曲線が交差する時点、つまり AI よりも人間の方が費用対効果が高くなる予算点を指します。
本稿では NanoGPT のスピードランデータを例に、この手法を示します。まず、NanoGPT を最適化する際の人的努力に対するリターンを推定しました。その結果、マージン(限界)において、性能が 1% 向上するごとに、約 2,500 ドルの人的労働コストがかかることがわかりました。
また、NanoGPT に対するエージェントによる最適化の試行における現状も報告します。すでに 1 万ドル以上の支出を行った結果、推定される支出限界は 0〜3,000 ドルとなりました。
はじめに
重要な問いは、AI が自身の進歩をどの程度加速させるかという点です。
過去一年の間に、AI がアルゴリズムの進展を加速し始めたとする信頼性の高い主張が数多くなされました。しかし、その度合いがどれほどなのか、そして今後何を期待すべきなのかを明確に判断するのは困難です。1 AI による AI 研究開発の加速に関する証拠は多数存在しますが、いずれも不完全なものばかりです。
- 原文の注釈番号は保持されています。
AI の研究開発(R&D)におけるベンチマーク
AI トレーニングアルゴリズムの最適化能力を評価する高品質なベンチマークは数多く存在しますが、その多くは人間のベースラインスコアを報告しておらず、あるいは 8 時間や 40 時間といった限定的な時間枠でのスコアしか示していません。さらに、これらのベンチマーク課題は、最先端の AI R&D の実態を反映していないケースが少なくありません。つまり、エージェントが「教科書的」または「玩具レベル」の問題には良い解決策を出せても、高度に最適化された最先端アルゴリズムの開発に貢献できるかどうかは別問題なのです。
研究者支援に関する検証研究
理想的には、AI の支援がある場合とない場合で研究者の生産性を比較すべきですが、その効果を正確に見積もる実験を行うのは非常に困難です(Becker ら、2026 年の議論を参照)。現時点では自己申告による生産性向上の推定値しか得られていません。例えば、Mythos のプレビューシステムカードでは約 4 倍、Becker/METR では約 2 倍という報告がありますが、両方のレポートはこれらの主張を解釈する際には十分な注意が必要だと警告しています。最近の研究では、AI がコード行数の生産量を劇的に増加させることが明らかになっています(Anthropic は Mythos がマージされたコード行数を 8 倍に増やしたと報告)。しかし、コードの生産量を増やすことと、R&D における実際の生産性が向上することは、必ずしもイコールではありません。
定性的な考察
Mythos Preview のシステムカードには、能力に関する調査結果(18 人中 4 人が、3 ヶ月間の支援付きの反復作業を経れば Mythos Preview が初級研究者を代替できると回答)と、AI R&D における同システムの強み・弱みについての議論が記載されています。これらは有用ですが、加速効果を定量的に評価するには依然として解釈が難しい側面があります。
フロンティア最適化問題への貢献
自律型や AI 支援型の手法によるフロンティア最適化問題(一部は AI R&D そのもの)への貢献に関する報告は近年多く見られます。例えば TTT-Discover、AlphaEvolve、LLM を活用した NanoGPT のスピードラン参加などがその例です。しかし、これらの貢献が人間の労力に対してどの程度の規模のものかを評価するのは困難であり、成功事例に偏った報告が多いため、結果を一般化して捉えることは容易ではありません。
能力向上における加速の兆候
上記のエビデンスは AI が AI の R&D 入力にどう寄与したかに焦点を当てたものでしたが、アウトプットの軌跡にも目を向けることができます。具体的には、METR の時間軸や Epoch の ECI で測定されるような「能力の向上における加速」です。AI R&D に起因する進歩の割合を推定するには、人間の R&D やトレーニング計算資源(例えば Mythos Preview システムカードで行われているように)の貢献も同時に見積もる必要があります。これは本質的に後追い指標であり、モデルで能力が実現した後に初めて観測できるものです。
このノートで提案する手法は、エージェントの最適化問題に対する能力を要約するための新たな指標です。これにより、既存の AI 研究開発ベンチマーク(RE-bench や MLE-bench など)でのパフォーマンスを評価することも可能ですが、ここでは特定の最先端最適化問題におけるエージェントの貢献度への適用方法も示し、NanoGPT を具体例として取り上げます。
「支出限界(expenditure horizon)」とは、エージェントの最適化能力を定量的に測る尺度です。
この指標は、ある最適化問題において、目標値の改善量が同じ予算を持つ人間のそれと等しくなる時点での金額価値として定義されます。
下のグラフでは、緑色の点線が人間による最適化への支出に対する期待リターンを、赤い曲線がエージェントによる最適化への支出に対するリターンを表しています。支出限界は、スタート地点から期待される人間の曲線との交点までの水平方向の距離で測定されます。
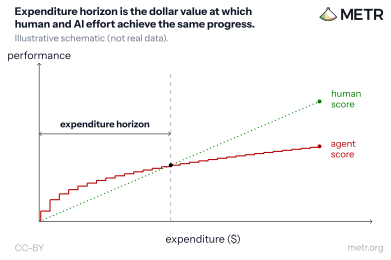
支出限界を測定するには、(1) エージェントへの支出に対する推論スケーリング曲線(赤い経路)の計測と、(2) 人的労働への支出に対する局所的なリターンの見積もり(緑色の直線)の 2 つが必要です。
これは、RE-bench や MLE-bench などで採用されている、特定のスコア達成に要する人間の平均時間を基準とした二値判定(Binary Threshold)に基づく AI R&D ベンチマークの一般化です。同様の手法は、Mythos Preview システムカードや GPT-5.5 システムカードなどの報告でも見られます。
Expenditure Horizon は、これらのレポートとはいくつかの点で異なります。
まず、二値スコアではなく連続的なスコアを報告することで、各タスクにおける能力をより統計的に精密に測定できます。これにより、モデル間の差異を検出するために必要な観測数を大幅に減らすことが可能です。
次に、人間がすでに徹底的に最適化を施してきた最先端の最適化問題を対象とすることで、実世界での有用性に関する解釈可能性が高まります。
さらに、スケーリングカーブ(規模拡大曲線)を報告することで、実世界の加速効果への関連性が向上します。これは、Noam Brown 氏が最近ベンチマークにおいてスケーリングカーブの報告を強く推奨している点とも合致します。また、金銭的価値には、タスク固有の人件費と実験計算コスト(最先端 AI の R&D では実験計算コストが総コストの大きな割合を占めます)が含まれています。
以下でこの手法の限界について詳しく議論します。これらの限界は、典型的な AI R&D ベンチマークなどにおける最適化能力の測定方法に共通するものです。特に注目すべき重要な限界として、以下の点が挙げられます。
本手法は自律的な最適化の価値のみを推定するものであり、AI に支援された人間によるハイブリッド最適化が、自律的最適化よりも大幅な改善をもたらすケースも想定されます。
この手法は、労働に対するリターンが比較的滑らかである問題に対して最も有用です。リターンにばらつき(ランプ)がある場合、人間とエージェントの両方の曲線を測定するのは困難になります。
他のエージェントがすでに最適化に貢献している問題では、推定される支出ハライズンは短くなる可能性が高いです。
そのモデルを開発したラボが既にその問題に対して学習済みである場合、エージェントに対する推定支出ハライズンは実際よりも極端に短く見積もられることになります。
交差点の存在は、エージェントへの支出に対するリターンが、人間への支出に対するリターンよりも急速に減少することを前提としています。これは現在のエージェントの状況(低予算では人間を上回るが、高予算では下回る。例:RE-bench (2024)、PaperBench (2025))をうまく説明しているように思われます。しかしいずれかの時点でこの関係は崩れ、その後は「支出ハライズン」という概念自体が明確に定義できなくなります。
もしこれが最先端の AI 研究開発(R&D)スタック全体で成立すれば、「自動化された AI R&D」が実現したとみなせるようになります。これは多くのラボの責任あるスケーリングポリシーや、Ajeya Cotra が提唱する「AI R&D 自動化のパリティ」といった基準に照らしてです。このポイントを超えた後は、エージェント労働に対するリターンも、人間への支出に対するリターンと同様に測定できるようになります。具体的には、「効率向上 1% あたりのドル価値」や「支出と効率の間の弾力性」などの指標で評価可能です。
RE-bench(2024)と PaperBench(2025)は、エージェントと人間のスケーリング曲線(時間または費用の観点から)を記録しており、これらには交差点が存在することが示されています。ただし、これらの研究では、その交差点に基づいてエージェントの能力を較正してはいません。
エージェントの「支出限界」を形式化する考え方は、以前のリンゴ収穫モデルに一部基づいています。このモデルは文字通り受け取る必要はありませんが、人間に対するエージェントのパフォーマンスを較正する際の謎を解くために有用です。例えば、「なぜエージェントは 1,000 ドルで人間よりも優れた最適化が可能なのに、それを 2 回実行して利益を倍にしないのか?」という疑問に対し、リンゴ収穫モデルは以下のような示唆を与えます。つまり、エージェントが到達できる最適化の種類に限界がある場合、(1)予算が少ない段階では人間を上回るが、予算が大きくなると逆転する、(2)人間に対するエージェントのパフォーマンスは、人間の最適化への累積支出には依存しない、(3)人間に対するエージェントのパフォーマンスは、エージェント自身の最適化への累積支出に依存するという結果になります。
ここでは NanoGPT における人間の労働の収益を推定します。
最後に、人間とエージェントのスケーリング曲線を比較することで、NanoGPT のスピードランにおいて「支出限界」を測定する方法を示す概念実証(PoC)を提供します。
NanoGPT の主要な貢献者 2 名へのインタビューを実施しました。その回答から、性能を 1 ポイント改善させるために必要な労力は約 16 時間(時給 150 ドル換算で 2,400 ドル)と推定されます。また、LLM を用いた評価者によって NanoGPT への最近の貢献を分類した結果も、ほぼ同様のリターンを示しています。
これらの見積もりは不確実性が高く、特に人間の時間の価値を算出する過程に依存しているため、実際の費用が大幅に上回ることも下回ることもあります。しかし、ここでは、リターンの過大評価や過小評価があったとしても、この一般的な手法自体が依然として有用な示唆を与える理由について議論します。
NanoGPT におけるエージェントの支出曲線と限界点(ホライズン)を示します。
速度記録 #78(2026 年 3 月、トレーニング時間 85.56 秒)を起点に、高支出型のエージェント最適化実験を 6 回実施しました。再現実験ではベースラインがわずかに遅い結果となりましたが、これは NanoGPT においてノイズやハードウェアの違いにより一般的に予想される現象です(付録 D 参照)。
支出に対するリターンの完全な曲線は以下の通りです。各グラフには、人間の時間に対する推定リターン曲線(1% の改善あたり 2,500 ドル)との交点として、支出限界点を示しています。
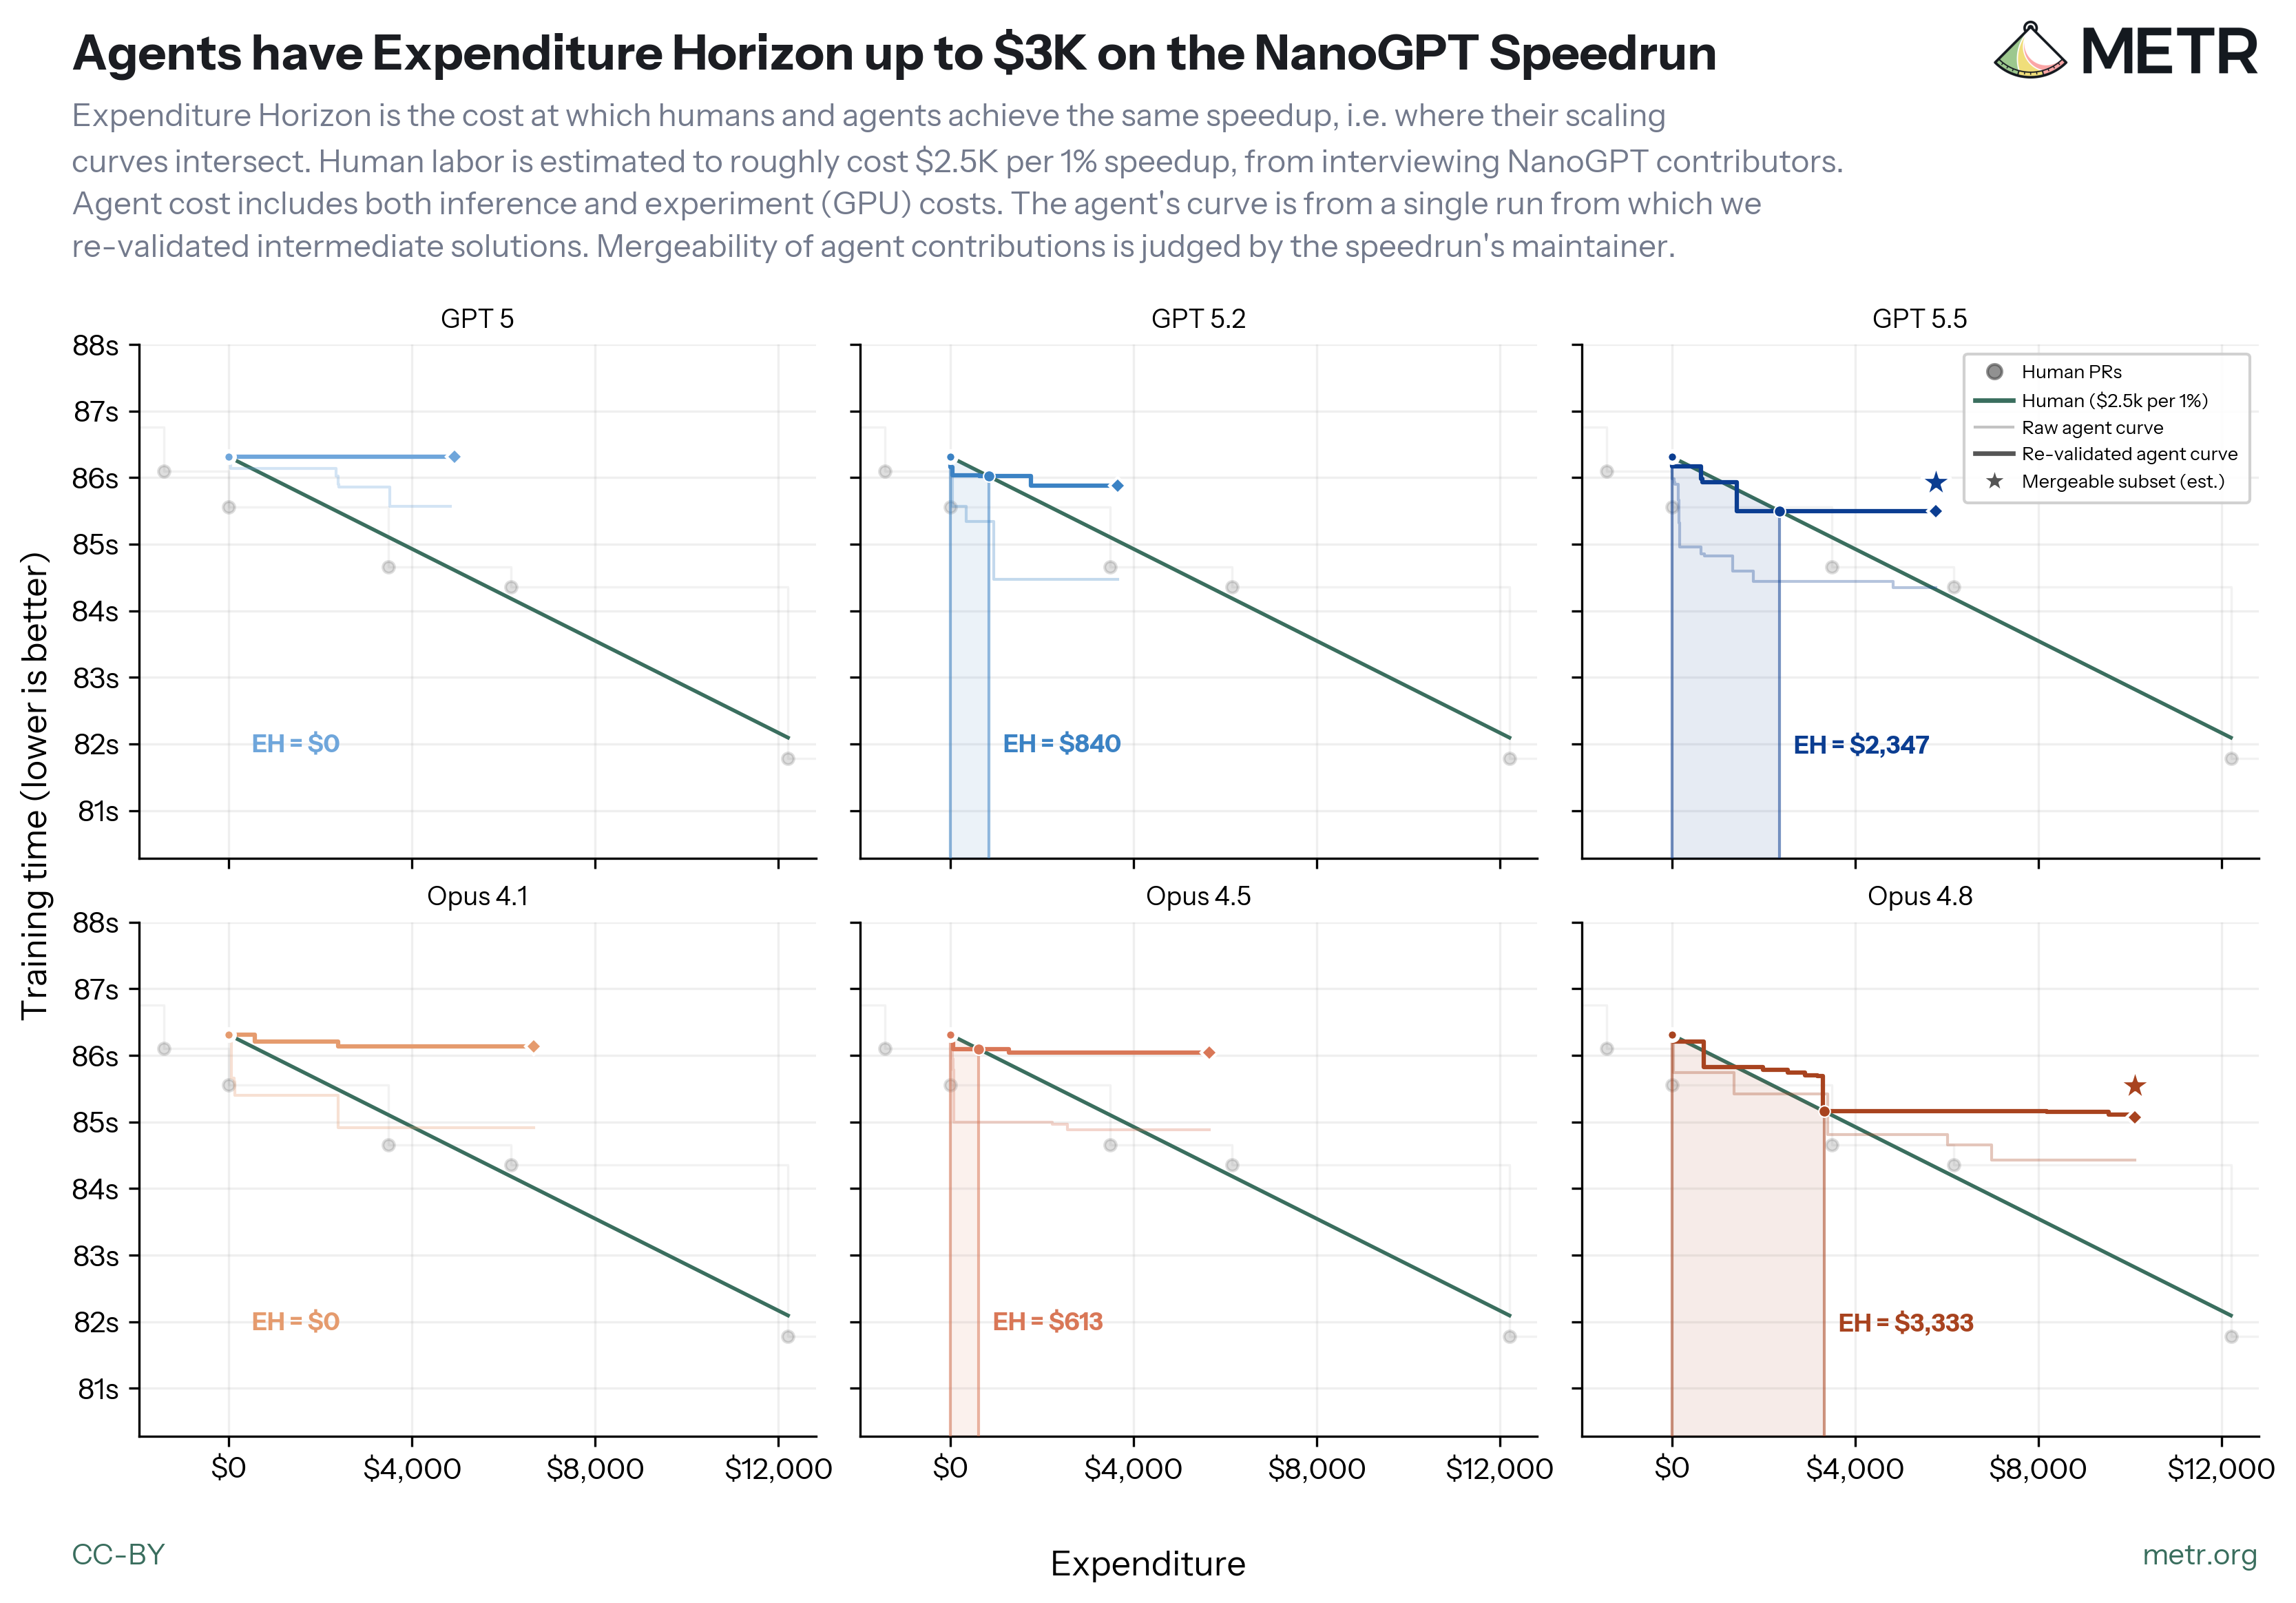
いくつかの観察点があります:
今回の評価環境は、必ずしも最適化されているわけではありません。エージェントには検証用に 4 つの H100 ノードを常時利用できるようにしていましたが、その結果、多くの実験が非効率に実行され、実験コストが各試行全体の費用の約 70〜90% を占めることになりました。より効率的な評価環境であれば、同じ最適化でも大幅にコストを削減できるはずです。しかし、曲線グラフを見ると、支出曲線を横方向にシフトしても「支出ハライズン(最適化が有効になるまでの期間)」は劇的に変化せず、最大スピードアップの向上も期待できないようです。
生の試行データは進歩を過大評価しています。このデータは累積的な最高スコアを示していますが、各ランでは再検証も行っています。過大評価の原因は統計的なノイズです。特に性能が最も高いモデルについては、管理者の判断に基づくと、その貢献のうち約 70% しか統合できないと考えられます。
GPT-5 と Opus-4.1 はノイズを追いかけているだけです。両モデルの生の試行データには進歩が見えますが、最終アルゴリズムを再検証すると、ベースラインとの差は確認できませんでした。
一部のモデルでは顕著な改善が見られました。GPT-5.5 と Opus-4.8 はベースラインに対して明確な改善を示しており、前述のグラフのように、これらは有意義な支出ハライズンを持つことが定量化できます。
全体的な改善効果はまだ限定的です。これらのモデルの支出範囲は数千ドルに達しますが、人間労働への総支出と比較すれば相対的に小さい規模です。したがって、この証拠は、自律的な最適化が NanoGPT における AI R&D の進展に劇的な影響を与えていないことを示唆しています(ただし、エージェントが人間の進歩を大幅に補完する可能性、つまりハイブリッド最適化の可能性は残っています)。
理論
本章では、支出範囲に関連するさまざまな方法論的課題についてより詳細に議論します。
まず、この手法は制約付き最適化問題にも適用可能であることを指摘しておきます。AI R&D の進展は往々にして最適化効率として特徴づけられ、多くのベンチマークがこの指標をスコアリングルールとして採用しています(RE-bench、MLE-bench など)。しかし当然ながら、AI R&D の多くは既存の定量的指標を最大化するものとして容易に解釈できるわけではありません。
時間範囲との関係
Kwa 他(2025)で導入された「時間範囲」手法の基本構成要素は、人間が異なる時間を要するタスクに対して AI エージェントが成功するか失敗するかを測定することです。このアプローチには以下の二つの限界があります。
- 合格・不合格という二値評価を用いているため、タスクの成功に関するより豊富なフィードバック(例えば、段階的な評価や「精度」のような連続的なスコアなど)がある場合、その情報が失われてしまいます。
AI エージェントや人間に割り当てるトークン数やその他のリソース(実験実行に必要な計算資源、カレンダー上の時間、評価関数へのクエリ数など)に対する予算や制約を完全に定義するものではありません。エージェントの性能が人間のコストよりもはるかに低い水準で頭打ちになるのであれば、この点は重要度は低くなります。しかし、エージェントが人間労働のコストと同程度のトークン消費でもまだ進歩を続けている場合や、他のリソースがボトルネックとなっている場合は、この点が重要になります。
タスクにほぼ連続的な採点が可能であり、コストの関数として人間とエージェントのスコアを測定または予測できる場合、「支出限界(expenditure horizon)」は上記2つの課題に対処します。バイナリのスコアカットオフを使用するよりも1回のエージェント実行で得られる情報量が増え、人間とエージェントのリソース予算をどのように扱うべきかも明確になります。
例えば、「計算と労働」の支出限界を定義するには、実験に要した計算資源の使用量、エージェントのトークン使用量、人間の労働コストをすべてドル建てで換算し、エージェントと人間の性能対コスト曲線を描画して、2 つの曲線が交差する点を確認します。
「実験用計算資源」や「評価関数へのクエリ数」といったコストは、AI エージェントが AI 研究開発をどの程度加速できるかを決定する上で重要な要素になると予想されます。
どのような最適化問題を採用するか。
エージェントに、明確な制約条件付きの最適化問題(例:アルゴリズム)とその初期状態(その問題におけるスタート地点)を解かせたい。理想的には、対象となる問題と状態が以下の基準を満たす必要がある。我々は、NanoGPT のスピードランがこの基準の多くを満たしていると考えている。
まず、問題は最先端 AI 研究開発(R&D)に類似していることだ。最も重要な基準は、この問題が典型的な最先端 AI R&D を反映しているかどうかである。ただし注意すべきは、以下の追加的な基準はいずれも扱いやすさを目的として範囲を限定するものであり、AI R&D の問題を単純化することで、エージェントの有効性を過大評価してしまう可能性がある点だ。NanoGPT は、特に最先端の事前学習アルゴリズムに類似している。例えば、最適化手法「Muon」は元々 NanoGPT 向けに考案されたものだが、その後広く採用されるようになった。ただし、NanoGPT の規模は、どの最先端事前学習アルゴリズムよりもはるかに小さい。
次に、評価指標が明確に定義されていることだ。場合によっては、最適化には複数の変数間のトレードオフが含まれる。もしこれらの変数間のトレードオフが明確でなければ、単一の変数だけで支出に対するリターンを判断するのは非常に困難になる。
進歩は一定のペースで続いています。最適化問題における歴史的な進展が、数ヶ月にわたる努力の後に occasional なブレークスルーといった不規則なものだとすれば、人間とエージェント双方への投資リターンを推定するのは非常に困難になります。以下に示すデータによると、NanoGPT の進歩は過去 1 年において比較的安定していました。また、いくつかの指標では GPT-2 から 700 倍もの効率改善が達成されており、これはまだ多くの潜在的な効率化余地があることを示唆しており、安心材料となります。
人間への投資リターンに関するデータも存在します。エージェントへの投資リターンを算定するためには、この問題に対してすでに投入された人間の努力量と、その努力に対するリターンに関するデータが必要です。理想的には、本来この問題に取り組む人々の賃金を反映した市場価格としてその努力の価値を測定すべきです。
進捗の検証は安価である。問題に対する進捗を検証するのにコストがかかる場合、支出に対するリターンを測定するのは困難になる。NanoGPT の進捗は比較的検証しやすい。最前線のトレーニング時間は 2 分未満だが、トレーニング時間にはばらつきがあるため、妥当性を確認するには多数の試行結果を平均化する必要がある。一方で、AI 研究開発の一部の問題では検証にコストがかかる。例えば、最先端モデルに対する事前学習アルゴリズムのパフォーマンスは、数百万ドル規模の計算リソース投入後でないと正確に把握できない場合もある。
それでも、最先端 AI の研究開発のうちには検証が容易な分野が存在すると予想される。具体的には、トレーニング後の効率化やプロンプト設計、推論処理における改善などだ。また、事前学習に関する小規模なリスク低減のように、検証しやすい代理指標となるケースも考えられる。
初期状態は、すでに顕著なエージェントによる最適化が反映されたものではない。もしエージェントが、過去の他のエージェントによって行われた作業の結果を既に含む状態からスタートする場合、追加のエージェント労働に対するリターンは低下すると予想される。直感的には、他者のエージェントによって最適化済みの状態から始めることは、既存のスケーリング曲線の途中から開始することに等しい。
エージェントは、その後の状態について知らないものとする。もしエージェントが、初期状態以降の問題への貢献(トレーニングを通じて得た知識やインターネットアクセスによる情報など)を認識している場合、モデルの進捗は真の最先端最適化問題における能力を過大評価することになる。
この問題に対してエージェントは訓練されていない。もしモデルの開発者が、この特定の課題に対してトレーニング後に大量の計算リソースをすでに投入していたなら、短期的にはエージェントが非常に高いパフォーマンスを発揮すると予想される。その場合、最先端におけるアジェンシー・労働への支出に対する真のリターンを過大評価することになるだろう。残念ながら OpenAI や Anthropic は NanoGPT での学習実施の有無を公に開示していないため、ここでは確実な判断ができない。
理想的には、いくつかの異なる難易度の高い最適化問題において支出期間(エクスペンディチャー・ホライズン)を測定すべきだ。
基準 #6 と #7 は互いに緊張関係にある。アジェンシーによる最適化がまだ反映されていないほど古すぎず、かつその後の状態に対してすでに学習済みではないよう、適切な初期チェックポイントを見つける必要があるのだ。
支出(金銭)に基づく較正と、時間に基づく較正の違いについて。
我々は、実験への支出も含めた「支出(金銭)」を基準にエージェントと人間の性能を測定することが最も有益だと考えている。支出に対するリターンは直接的な指標となる。
原文を表示
.post-content img { display: block; margin-left: auto; margin-right: auto; } .post-content img.img-small { max-width: min(480px, 100%); } .post-content img.img-medium { max-width: min(620px, 100%); } .post-content img.schematic { width: 100%; max-width: min(720px, 100%); height: auto; } .post-content table.small-table { font-size: 0.82em; } .post-content details { margin-bottom: 1.5rem; } .post-content details pre.highlight, .post-content details pre.highlight code { font-size: 0.72em; line-height: 1.45; white-space: pre-wrap; } .post-content table.centered-table { width: auto; margin-left: auto; margin-right: auto; } .post-content table.centered-table td, .post-content table.centered-table th { text-align: center; padding-left: 1.2em; padding-right: 1.2em; } .post-content .tag-reject, .post-content .tag-mergeable, .post-content .tag-caution { display: inline-block; padding: 0.05em 0.55em; border-radius: 1em; white-space: nowrap; font-size: 0.95em; } .post-content table.review-table td { position: relative; padding-bottom: 4.2em; } .post-content .review-line { position: absolute; bottom: 0.6em; left: 0.75rem; right: 0.75rem; } .post-content .tag-reject { background: #fad2cf; color: #8c1d18; } .post-content .tag-mergeable { background: #d4edbc; color: #274e13; } .post-content .tag-caution { background: #ffe5a0; color: #7a4f01; } We propose a measure of an AI agent’s optimization ability with an “expenditure horizon.” We give an empirical illustration from the NanoGPT speedrun.
One difficulty in measuring AI’s ability to accelerate AI R&D is accounting for token cost, experiment compute cost and human labor cost. If we can estimate performance as a function of cost for both humans and agents, we can measure the “expenditure horizon” as the point at which those curves cross: the budget at which humans become more cost-effective than AIs. We illustrate our method with data from the NanoGPT speedrun. We first estimate the returns to human effort in optimizing NanoGPT: on the margin, each 1% improvement costs very roughly \$2,500 in human labor. We also report the status of preliminary agentic optimization runs against NanoGPT: after more than \$10K of expenditure we estimate expenditure horizons of \$0-\$3K.
Introduction
A critical question is the degree to which AI will accelerate its own progress.
Over the last year there have been many credible claims that AI has begun accelerating algorithmic progress but it is hard to tell by how much, and what to expect in the future.1 We have many imperfect sources of evidence on AI’s acceleration of AI R&D:
AI R&D benchmarks. There are a few high-quality benchmarks which test agents on their ability to optimize AI training algorithms. However most do not report any human baseline, or only a baseline score at 8 hours or 40 hours. Additionally, the benchmark problems are often not reflective of frontier-level AI R&D. It seems plausible that agents can get good solutions to many “textbook” or “toy” problems without being able to contribute to highly-optimized frontier algorithms.
Researcher-uplift studies. Ideally we would compare researcher productivity with and without AI help, but it is very difficult to run an experiment that estimates the effect accurately (discussion in Becker et al., 2026). We do have some self-reported estimates of productivity improvement: around 4X from the Mythos Preview system card; around 2X from Becker/METR, but both reports recommend a great deal of caution in interpreting these claims. Recent studies find AI significantly increases lines-of-code produced (Anthropic reports that Mythos increased merged lines of code by 8X), but production of code is difficult to map to productivity in R&D.
Qualitative reflections. The Mythos Preview system card describes (1) survey results on ability (4/18 respondents thought Mythos Preview could replace an entry-level researcher with 3 months of scaffolding iteration); and (2) discussion of strengths and weaknesses of Mythos Preview in doing AI R&D. These are useful but again difficult to interpret as quantitative measures of acceleration.
Contributions to frontier optimization problems. There have been many recent reports of autonomous or AI-assisted contributions to frontier optimization problems (some of which are AI R&D problems) e.g. TTT-Discover, AlphaEvolve, and LLM-assisted NanoGPT speedrun contributions. However it is difficult to assess the magnitude of these contributions relative to human effort, and reporting is biased towards successes making the results hard to generalize.
Acceleration in capabilities progress. The evidence above was regarding AI’s contribution to AI R&D inputs; we can additionally look at the trajectory of output, e.g. looking at acceleration in capabilities as measured by METR’s time-horizon or Epoch’s ECI. Estimating how much progress is attributable to AI R&D requires also estimating the contribution of human R&D and training compute (e.g. as done in the Mythos Preview system card). This is intrinsically a lagging metric, only observed after the capabilities are realized in a model.
The method in this note is a novel metric for summarizing an agent’s ability on a optimization problem. It thus can be used to summarize performance on existing AI R&D benchmarks (e.g. RE-bench, MLE-bench), but we also show how to apply it to agentic contribution to certain frontier optimization problems, and we illustrate with NanoGPT.
An agent’s “expenditure horizon” gives a quantitative measure of agentic optimization ability.
We define an agent’s “expenditure horizon” over an optimization problem as the dollar value at which the improvement to the goal metric is equal to the improvement by a human with the same budget.
In the graph below, the green dotted line represents the expected returns to expenditure on human optimization, while the red curve represents the returns to expenditure on optimization by an agent. The expenditure horizon measures the horizontal distance between the starting point and the intersection with the expected human curve.
image
Measuring an expenditure horizon requires (1) measuring an inference-scaling curve for agent expenditure (the red path); and (2) estimating the local returns to expenditure on human labor (the green line).2
This is a generalization of AI R&D benchmarks which use binary thresholds based on the average human time to achieve a certain score, e.g. RE-bench, MLE-bench, etc. (e.g. as reported in Mythos Preview system card and GPT-5.5 system card). Expenditure horizon differs from these reports in a few ways:
Reporting a continuous score, instead of a binary score, gives a much more statistically precise measure of capability for each task, i.e. differences between models can be detected with fewer observations.
Testing against frontier optimization problems, that have already been extensively optimized by humans, makes the outcome more interpretable for real-world usefulness.
Reporting the scaling curve makes the outcome more relevant to real-world acceleration, e.g. see Noam Brown’s recent exhortation to report scaling curves in benchmarks. Additionally monetary values incorporate task-specific costs of labor and the cost of experiment compute (for frontier AI R&D, the cost of experimental compute is a substantial share of cost).
We discuss limitations in depth below. Many of these limitations apply to any measure of optimization ability, e.g. in typical AI R&D benchmarks. Some important limitations worth highlighting:
This method only estimates the value of autonomous optimization. In some cases we would expect hybrid optimization (humans assisted by AI) to be a significant improvement on autonomous optimization.
This method is most useful for problems which show fairly smooth returns to labor. If the returns are lumpy then both human and agent curves are harder to measure.
The estimated expenditure horizon will likely be shorter on problems for which other agents have already contributed optimizations.
The estimated expenditure horizon for an agent on a problem will be unrepresentatively short if the lab producing that model has already trained against that problem.
The existence of an intersection assumes that the returns to expenditure on agents diminish more quickly than the returns to expenditure on humans. This seems to be a good description of the current status of agents (they outperform humans at low budgets, but underperform at high budgets, e.g. RE-bench (2024), PaperBench (2025)). However at some point this will no longer hold, after which an agent’s “expenditure horizon” will not be well-defined. If this holds across the frontier AI R&D stack then we will have “automated AI R&D” by many definitions (e.g. those of many labs’ Responsible Scaling Policies, and Ajeya Cotra’s “parity” milestone of AI R&D automation). After this point we can characterize the returns to agentic labor in the same way we measure returns to human expenditure, e.g. a dollar value per 1% efficiency gain, or an elasticity between expenditure and efficiency.
RE-bench (2024) and PaperBench (2025) both document scaling curves for agents and humans (either in time or expenditure), which show an intersection, but they do not calibrate agents’ abilities by their intersection with the human curve.3
The idea of formalizing an agent’s expenditure horizon is partly based on our earlier apple-picking model, although the model need not be taken literally. We find this model useful to answer puzzles in calibrating agent performance against humans. E.g., if an agent can optimize a problem better than a human for \$1000, then why not run the agent twice and get twice the gain? The apple-picking model shows that, if agents are limited in the types of optimizations they can find, then we will expect: (1) agents will outperform humans at small budgets, but fall behind at large budgets; (2) the performance of agents relative to humans will be independent of the cumulative human expenditure on optimization; (3) the performance of agents relative to humans will be dependent on the cumulative agent expenditure on optimization.
We estimate the returns to human labor on NanoGPT.
We give a proof-of-concept showing how to measure expenditure horizon on the NanoGPT speedrun, by comparing human and agentic scaling curves.
We conducted two interviews with prolific NanoGPT contributors. Their responses imply the effort required for an incremental 1 percentage-point optimization is around 16 hours of labor, or \$2,400 (at \$150/hour). We also use an LLM judge to categorize recent contributions to NanoGPT, which estimates a roughly similar return.
These estimates are highly uncertain, especially due to estimating the value of human time — the true cost could be significantly higher or lower. However, we discuss below reasons why we believe the general method remains informative even with over-estimates or under-estimates of the returns to human expenditure.
We show agent expenditure curves and horizons on NanoGPT.
We ran six high-expenditure agentic optimization runs starting from record #78 of the speedrun (March ’26, 85.56 seconds of training time). On reproduction our baseline starts slightly slower which is typically expected on NanoGPT due to noise and hardware differences (Appendix D).
The full returns-to-expenditure curves are shown below, and for each we illustrate the expenditure horizon, shown as the intersection with the estimated returns to human expenditure curve (\$2,500/1%).
image
A few observations:
Our harness is likely inefficient. We ran the agents with continuous access to 4 H100 nodes, to use for validation of their optimizations. As a consequence the agents ran many experiments, likely inefficiently, and experiment cost comprised around 70-90% of the cost of most trajectories. We expect a more optimized harness would significantly lower cost for a given optimization. However we can see from the curves that shifting the expenditure curves horizontally would not dramatically change the expenditure horizon, and it appears unlikely to increase the maximum speedup achieved.
The raw trajectories overstate progress. The trajectories show the cumulative best score. But for each run we also re-validate their trajectories. The overstatement is due to statistical noise. For the best performing models we further think only ~70% of contributions are mergeable as per the maintainer’s judgement.
GPT-5 and Opus-4.1 only chase noise. The raw trajectories from GPT-5 and Opus-4.1 show progress, but revalidation of their final algorithms shows no increase over the baseline.
Some models show significant improvements. GPT-5.5 and Opus-4.8 show significant improvements over the baseline, and we can quantify those with significant expenditure horizons, as shown above.
The big-picture improvements are still modest. Although these models have expenditure horizons in the thousands of dollars, they are small relative to the overall expenditure on human labor. Thus this evidence implies that autonomous optimization does not have dramatic effects on AI R&D progress on NanoGPT (though it is still possible that agents could dramatically augment human progress, AKA hybrid optimization).
Theory
In this section we give a more detailed discussion of a variety of methodological issues related to expenditure horizon.
We first note that this method is applicable to constrained optimization problems. The progress of AI R&D is often characterized as optimization efficiency, and many benchmarks use this as a scoring rule (RE-bench, MLE-bench), but there are of course many parts of AI R&D that cannot be easily interpreted as maximizing a pre-existing quantitative metric.
Relation to Time Horizon.
The basic building block of the Time Horizon methodology introduced in Kwa et al., 2025 is measuring whether AI agents succeed or fail on tasks which take humans different amounts of time. Two limitations of this are:
This uses binary pass-fail scoring, which throws away information if we have richer feedback about task success (e.g. a range of possible grades, or a continuous score like “accuracy”)
It doesn’t fully specify a budget or constraints for tokens or other resources (e.g. compute for running experiments, calendar time, number of queries to evaluation function) should be used for AI agents or humans. This is less important if agent performance plateaus well below human cost, but becomes important if the agent is still making progress at token spend similar to human labor spend, or if other resources are important bottlenecks.
If a task has approximately continuous scoring, and we can measure or predict human and agent score as a function of some kind of cost, the expenditure horizon addresses the two limitations above: we get more information per agent run than using a binary score cutoff, and it’s clearer how to handle resource budgets for humans and agents.
For example, we can define the “compute and labor” expenditure horizon by denominating experiment compute usage, agent token usage, and human labor cost in dollars, plotting cost-performance curves for agent and human, seeing where the curves cross.4
We expect costs like “experiment compute” or “queries to evaluation function” to be important factors in determining how much AI agents can accelerate AI R&D.
Which optimization problems to use.
We wish to run the agent on a problem (a well-defined constrained optimization problem) and a state (a starting point on that problem, e.g. an algorithm). An ideal problem and state would satisfy the following criteria. We believe the NanoGPT speedrun satisfies most of these:
The problem is similar to frontier AI R&D. The most important criterion is that this problem reflects typical frontier AI R&D. It is important to keep in mind that all the following additional criteria narrow the scope for the purposes of tractability, and by simplifying the problem of AI R&D they could overstate the usefulness of agents. NanoGPT is notably similar to frontier pretraining algorithms, e.g. the Muon optimizer was first invented for NanoGPT, but has become widely adopted since, although NanoGPT’s scale is far far smaller than any frontier pretraining algorithm.
The outcome metric is well-defined. In some cases optimization can involve tradeoffs among multiple variables. If the tradeoff among those variables is not well-defined, then it becomes much harder to judge returns to expenditure with a single variable.
Progress is regular. If historical progress on an optimization problem consists of irregular advances, e.g. occasional breakthroughs after months of effort, then it is much harder to estimate the returns to both human and agent effort. Data shown below indicates NanoGPT progress has been fairly regular over the last year. It is also notable that, by some measures, NanoGPT has had a 700X efficiency improvement since GPT-2, which is reassuring that there are still many more potential efficiencies.
We have data on the return to human effort. To calibrate the returns to agent effort we need some data on human effort already put in on this problem, and the returns to that effort. Ideally we measure the market price of that effort, reflecting the wage of the people who would ordinarily be working on this problem.
Progress is cheap to verify. If progress on a problem is expensive to verify then it is difficult to measure the returns to expenditure. NanoGPT progress is somewhat cheap to verify: frontier training time is less than 2 minutes, though training-time is noisy so validation requires averaging many runs. Some AI R&D problems are expensive to verify, e.g. the performance of pretraining algorithms on frontier models may not be accurately observable until after millions of dollars of training compute. Nevertheless we expect some frontier AI R&D to be cheap to verify, e.g. efficiencies in post-training, elicitation, or inference; others have cheap-to-verify proxies, e.g. small derisks for pretraining.
The starting state does not already reflect significant agentic optimization. If the agent starts from a state that already reflects work done by prior agents then we expect lower returns to additional agentic labor. Intuitively, starting from a state that already has been optimized by another agent is equivalent to starting part-way along an existing agent scaling curve.
The agent does not know about subsequent states. If an agent is aware of contributions to the problem subsequent to the starting state (either through training or through internet access), then the model’s progress would overstate its capabilities on true frontier optimization problems.
The agent has not been trained on this problem. If the model’s developer already spent a significant amount of compute post-training against this specific problem, then we would expect the agent to perform very well in the short-run, over-stating the true returns to expenditure on agentic labor at the frontier. Unfortunately OpenAI and Anthropic haven’t publicly disclosed whether they train on NanoGPT, so we can’t be sure here. Ideally we would measure expenditure horizons across a few different hard optimization problems.
Criteria #6 and #7 are in tension: we wish to find a starting checkpoint that’s not too recent (so it doesn’t incorporate substantial agentic optimization), and not too old (so the model isn’t already trained on subsequent states).
Calibrating to money vs calibrating to time.
We believe it is most informative to measure agent and human performance with respect to expenditure (money), inclusive of expenditure on experiments. Returns to expenditure directly measure
AI算出
技術分析ainew評価標準
METR が独自に開発した評価手法とその数値的根拠を報じており、AI R&D の加速効果を定量化する新しい視点を提供している点で新規性が高い。ただし、日本企業や日本市場への直接的な影響や適用事例は明記されていないため、日本の関連性は低めとなる。
6つの評価軸を見る
- AI関連度
- 100
- 情報源の信頼性
- 25
- 新規性
- 75
- 調べる価値
- 75
- 重複の少なさ
- 100
- 日本での有用性
- 25
関連記事
今日のまとめ
AIデイリーブリーフで今日の重要ニュースをまとめ読み