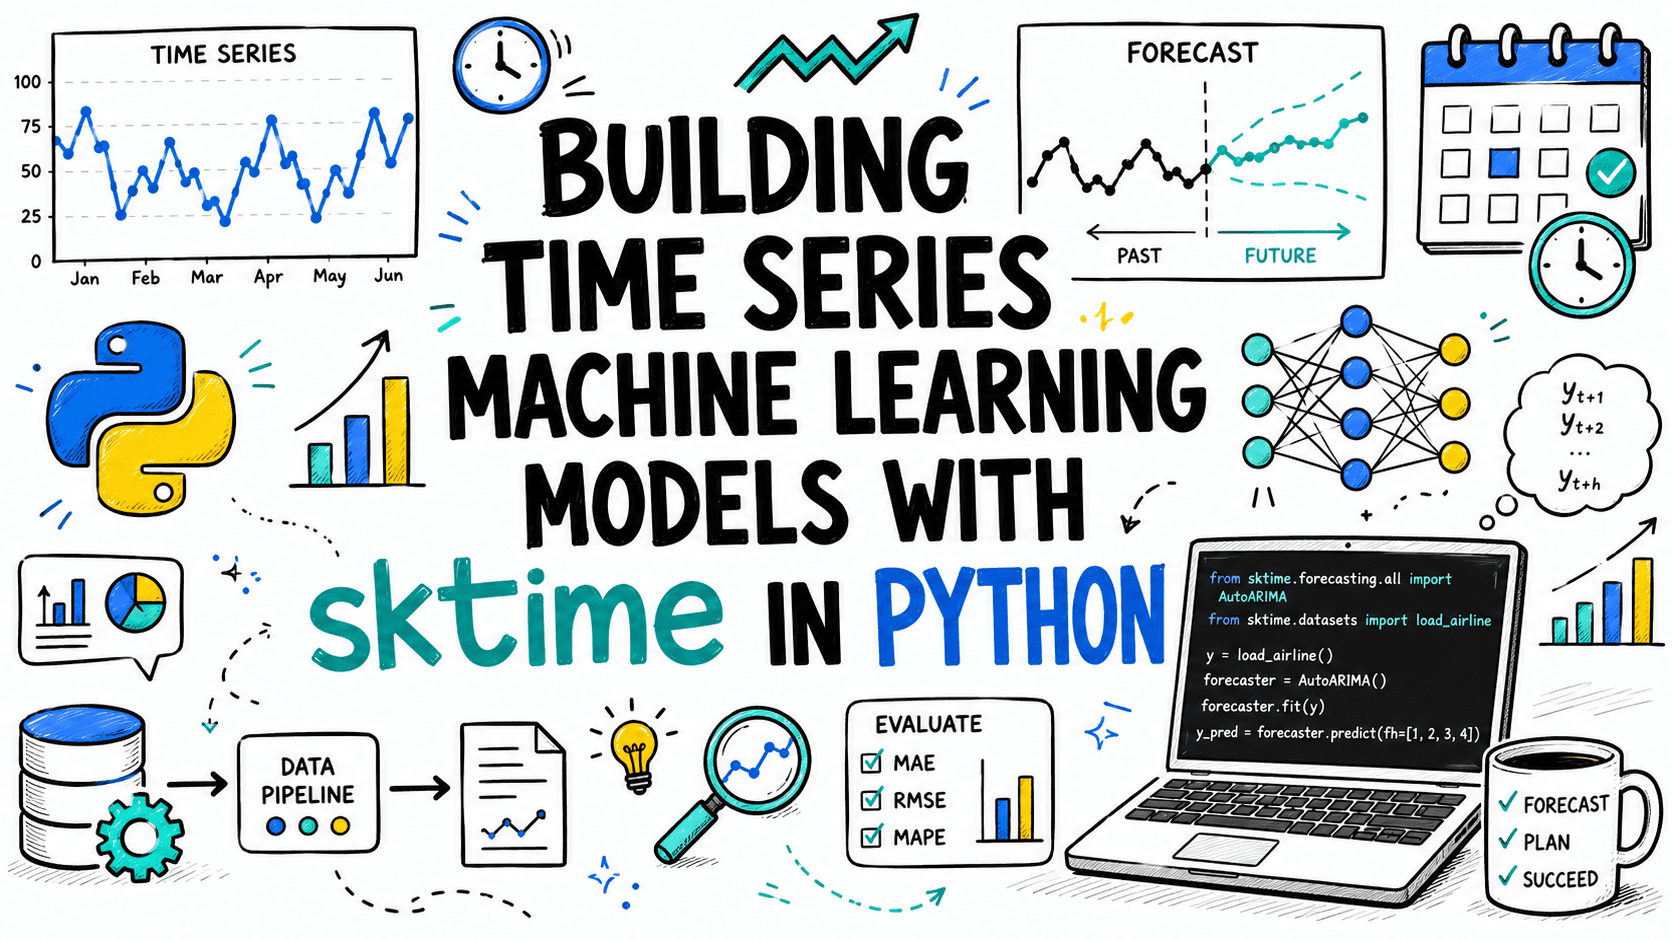
Python の sktime を用いた時系列機械学習モデルの構築方法
KDnuggets は、時系列データ分析の専門ライブラリである sktime の活用方法を解説し、Python 環境における機械学習モデル構築の実践的ガイドを提供している。
キーポイント
sktime の特徴と役割
従来の汎用 ML ライブラリとは異なり、時系列データの特殊性(季節性、トレンド、自己相関)を考慮した設計がなされた Python ライブラリとして sktime が紹介されている。
一貫した API デザイン
scikit-learn と互換性の高い API を採用しており、時系列データに対する予測、分類、クラスタリングなどのタスクを直感的かつ統一的に実行可能である点が強調されている。
実装と評価の効率化
クロスバリデーションやハイパーパラメータチューニングなど、時系列モデル構築で複雑になりがちなプロセスを簡素化する機能やベストプラクティスが解説されている。
影響分析・編集コメントを表示
影響分析
この記事は、時系列データを扱うエンジニアやデータサイエンティストにとって、実装効率とモデル精度を向上させるための具体的な技術指針を提供するものである。特に scikit-learn との親和性を強調することで、既存のワークフローへの導入ハードルを下げ、業界全体での時系列分析の標準化に寄与すると考えられる。
編集コメント
汎用的な ML ツールでは扱いにくい時系列データの特殊性を解決するライブラリとして、実務現場で即戦力となる情報を提供しています。
 image**
# イントロダクション
センサーの読み取り値、サーバーのメトリクス、または時間経過とともに到着するデータを取り扱う場合、標準的な scikit-learn パイプラインが必ずしも適していないことをすでにご存じでしょう。時系列データには、表形式モデルが無視してしまう構造があります:季節性、トレンド、時間的順序、そして将来の値が過去の値に依存するという事実です。
sktime は、このために特別に構築された Python ライブラリです。fit(学習)、predict(予測)、transform(変換)という scikit-learn 風の API を提供しますが、時系列のために最初から設計されています。時系列データに対する予測、分類、回帰、クラスタリングをすべて一貫したインターフェースで実行できます。
この記事では、産業用 HVAC センサーからの温度読み取り値の予測という例題に取り組みます。sktime が時系列データをどのように処理するか、前処理パイプラインをどのように構築するか、予測モデル(forecasters)をどのように学習させるか、そしてそれらをどのように評価するかを学びます。
# 前提条件
**
Python 3.10 Python 3.10 以上と、pandas の基本的な知識が必要です。必要なものはすべて以下のようにインストールしてください:
pip install sktime pmdarima statsmodels
すべてのオプション依存関係を一度に入手したい場合は、pip install sktime[all_extras] で対応可能です。
sktime が有用である理由
sktime が解決しようとしている問題を理解することが役立ちます。scikit-learn では、データは 2 次元の表(2D table)として扱われ、行がサンプル、列が特徴量となります。しかし、時系列データはこの前提を崩します。なぜなら、各行は実際には時間経過に伴う値の連続であり、これらの値の順序が重要だからです。
主に使用するデータコンテナは以下の通りです:
データ型 | 表現形式 | 説明
---|---|---
Series (時系列) | pd.Series または pd.DataFrame | バニラな予測(vanilla forecasting)で用いられる単一の時系列。
Panel (パネル) | 2 レベルの MultiIndex を持つ pd.DataFrame | 複数の独立した時系列の集合体。
Hierarchical (階層型) | 3 つ以上のレベルを持つ MultiIndex の pd.DataFrame | 多次元全体に集計レベルを設けた、構造化された時系列のセット。
インデックス自体については、sktime は pandas オブジェクト上で DatetimeIndex、PeriodIndex、Int64Index、RangeIndex をサポートしています。インデックスは単調である必要があります。DatetimeIndex を使用する場合は、freq 属性を設定しておくべきです。
データセットの準備
それでは、現実的なデータセットを作成しましょう。工場の HVAC センサーが毎時温度を記録している状況を想像してください。この読み取り値には、作業時間中に高くなるという日次季節パターン、夏季によるわずかな上昇トレンド、そしてノイズが含まれています。
import numpy as np
import pandas as pd
np.random.seed(42)
2026 年 1 月 1 日から始まる 90 日間の毎時読み取り値
n_hours = 90 * 24
timestamps = pd.date_range(start="2026-01-01", periods=n_hours, freq="h")
Trend: gradual 5-degree rise over 90 days
trend = np.linspace(0, 5, n_hours)
Daily seasonality: temperature peaks at 2pm, dips at 4am
hour_of_day = np.arange(n_hours) % 24
daily_cycle = 4 * np.sin(2 * np.pi * (hour_of_day - 4) / 24)
Noise
noise = np.random.normal(0, 0.8, n_hours)
Base temperature around 20°C
temperature = 20 + trend + daily_cycle + noise
Introduce a few missing values (sensor dropout)
dropout_indices = [300, 301, 302, 1440, 1441]
temperature[dropout_indices] = np.nan
y = pd.Series(temperature, index=timestamps, name="temp_celsius")
y.index.freq = pd.tseries.frequencies.to_offset("h")
print(y.head())
print(f"\nShape: {y.shape}")
print(f"Missing values: {y.isna().sum()}")
print(f"Index type: {type(y.index)}")
Output:
2026-01-01 00:00:00 16.933270
2026-01-01 01:00:00 17.063277
2026-01-01 02:00:00 18.522783
2026-01-01 03:00:00 20.190095
2026-01-01 04:00:00 19.821941
Freq: h, Name: temp_celsius, dtype: float64
Shape: (2160,)
Missing values: 5
Index type:
# Splitting Time Series Data for Training and Testing
Splitting time series data is different from tabular data — you can't shuffle rows. You must always split chronologically: train on earlier data, test on later data.
sktime provides temporal_train_test_split for this purpose:
from sktime.split import temporal_train_test_split
最後の7日(168時間)をテストセットとして保持する
y_train, y_test = temporal_train_test_split(y, test_size=168)
print(f"Train: {y_train.index[0]} → {y_train.index[-1]}")
print(f"Test: {y_test.index[0]} → {y_test.index[-1]}")
print(f"Train size: {len(y_train)}, Test size: {len(y_test)}")
出力:
Train: 2026-01-01 00:00:00 → 2026-03-24 23:00:00
Test: 2026-03-25 00:00:00 → 2026-03-31 23:00:00
Train size: 1992, Test size: 168
この関数は、分割が明確で時系列順であることを保証し、未来からのデータリーク(data leakage)がトレーニングセットに混入しないようにします。
# 予測ホライズンの定義
任意のモデルをフィットさせる前に、sktime にどの時間ステップを予測したいかを指示する必要があります。これが ForecastingHorizon です。
from sktime.forecasting.base import ForecastingHorizon
168 ステップ先(7日分の時間データ)を予測する
is_relative=False は、絶対時刻を使用していることを意味します
fh = ForecastingHorizon(y_test.index, is_relative=False)
print(f"Horizon length: {len(fh)}")
print(f"First forecast point: {fh[0]}")
print(f"Last forecast point: {fh[-1]}")
これにより以下が得られます:
Horizon length: 168
First forecast point: 2026-03-25 00:00:00
Last forecast point: 2026-03-31 23:00:00
fh = [1, 2, 3, ..., 168] のように相対的な予測期間(relative horizons)を使用することもできます。これは「1 ステップ先、2 ステップ先、…」を意味します。予測したい実際のタイムスタンプがある場合は、絶対的な予測期間(absolute horizons)の方がより明確です。
# 前処理と予測パイプラインの構築
実際のセンサーデータには欠損値や季節パターン、トレンドが含まれており、これらは予測の前または最中にすべて処理する必要があります。sktime の TransformedTargetForecaster を使用すると、変換と予測器を単一の推定量(estimator)として連結できます。変換は、学習前に対象時系列 y に適用され、予測時に自動的に逆変換されます。
from sktime.forecasting.exp_smoothing import ExponentialSmoothing
from sktime.forecasting.compose import TransformedTargetForecaster
from sktime.transformations.series.impute import Imputer
from sktime.transformations.series.detrend import Deseasonalizer, Detrender
pipeline = TransformedTargetForecaster(
steps=[
# Step 1: Fill missing sensor readings using linear interpolation
("imputer", Imputer(method="linear")),
# Step 2: Remove the linear trend so the forecaster sees a stationary series
("detrender", Detrender()),
# Step 3: Remove the daily seasonality (sp=24 for hourly data with 24-hour cycles)
("deseasonalizer", Deseasonalizer(model="additive", sp=24)),
# Step 4: Forecast the cleaned, stationary residuals
("forecaster", ExponentialSmoothing(trend=None, seasonal=None)),
]
)
pipeline.fit(y_train, fh=fh)
y_pred = pipeline.predict()
print(y_pred.head())
Output:
2026-03-25 00:00:00 21.210066
2026-03-25 01:00:00 21.788986
2026-03-25 02:00:00 22.615184
2026-03-25 03:00:00 23.688449
2026-03-25 04:00:00 24.621127
Freq: h, Name: temp_celsius, dtype: float64
Here's what each step does:
- Imputer(method="linear") fills missing values by linearly interpolating between the surrounding readings, which works well for sensor data.
- Detrender() fits a linear trend to the training series and subtracts it; on prediction it adds the trend back.
- Deseasonalizer(sp=24) removes the 24-hour cycle from the residuals; sp stands for seasonal period.
- Finally, ExponentialSmoothing forecasts the detrended, deseasonalized residuals.
- predict() が呼び出されると、すべての逆変換が自動的に逆順に適用され、元の温度スケールでの予測値が得られます。
# 予測の評価
sktime は 標準的な評価指標 と統合されています。予測においては、平均絶対誤差 (MAE: Mean Absolute Error) と平均絶対パーセント誤差 (MAPE: Mean Absolute Percentage Error) が一般的な選択肢です。
from sktime.performance_metrics.forecasting import (
mean_absolute_error,
mean_absolute_percentage_error,
)
mae = mean_absolute_error(y_test, y_pred)
mape = mean_absolute_percentage_error(y_test, y_pred)
print(f"MAE: {mae:.3f} °C")
print(f"MAPE: {mape*100:.2f}%")
出力:
MAE: 0.584 °C
MAPE: 2.40%
# 異なる予測器への差し替え
sktime のインターフェースの最大の利点の一つは、基盤となるアルゴリズムを差し替える際に、変更が必要なのはたった一行だけであることです。ここでは指数平滑化の代わりに ARIMA モデルを試して比較してみましょう。
from sktime.forecasting.arima import ARIMA
pipeline_arima = TransformedTargetForecaster(
steps=[
("imputer", Imputer(method="linear")),
("detrender", Detrender()),
("deseasonalizer", Deseasonalizer(model="additive", sp=24)),
# 洗浄された残差に対する ARIMA(1,1,1)
("forecaster", ARIMA(order=(1, 1, 1), suppress_warnings=True)),
]
)
pipeline_arima.fit(y_train, fh=fh)
y_pred_arima = pipeline_arima.predict()
mae_arima = mean_absolute_error(y_test, y_pred_arima)
mape_arima = mean_absolute_percentage_error(y_test, y_pred_arima)
print(f"ARIMA MAE: {mae_arima:.3f} °C")
print(f"ARIMA MAPE: {mape_arima*100:.2f}%")
Output:
ARIMA MAE: 0.586 °C
ARIMA MAPE: 2.41%
重要な点は、前処理のステップ(欠損値補完、トレンド除去、季節性除去)がすべて同一であったことです。最終的な予測器を変更しただけで、それ以外の部分はすべてきれいに組み合わさっています。
# 時間軸に沿った交差検証
単一のテストウィンドウを除外するだけでは誤解を招く可能性があります。sktime は、時系列順序を尊重するスプリッターを通じて時系列の交差検証を提供します。
SlidingWindowSplitter はローリングウィンドウを使用し、トレーニングウィンドウは時間軸に沿って前方にスライドしますが、常に同じ長さになります。ExpandingWindowSplitter は、前方に進むにつれてトレーニングセットを累積的に拡張するため、利用可能な履歴をすべて使用したい場合により適切です。
from sktime.split import ExpandingWindowSplitter
from sktime.forecasting.model_evaluation import evaluate
拡張ウィンドウ:1800 時間のトレーニングセットから開始し、168 時間のウィンドウで評価
cv = ExpandingWindowSplitter(
initial_window=1800,
fh=list(range(1, 169)),
step_length=168,
)
results = evaluate(
forecaster=pipeline,
y=y,
cv=cv,
scoring=mean_absolute_error,
return_data=False,
)
print(results[["test__DynamicForecastingErrorMetric", "fit_time"]].round(3))
print(f"\nMean CV MAE: {results['test__DynamicForecastingErrorMetric'].mean():.3f} °C")
Output:
test__DynamicForecastingErrorMetric fit_time
0 0.627 0.274
1 0.585 0.100
Mean CV MAE: 0.606 °C
evaluate は、各フォールドごとの指標と所要時間を示す DataFrame を返します。交差検証による平均絶対誤差 (MAE: Mean Absolute Error) の結果は、モデルがデータ内の異なる時間ウィンドウにわたって一貫して一般化できることを確認するものです。
# 次のステップ
本記事では sktime における基本的な予測ワークフローの核心を解説しましたが、このライブラリは単純な予測タスクを超えて多岐にわたる機能を提供しています。
また、時系列分類、不確実性推定を伴う 確率的予測、複数の関連する時系列にわたる共有モデルのトレーニング、逐次予測向けに従来の機械学習アルゴリズムを適応させる手法、そして モデル選択とチューニングワークフローの自動化 などの機能もサポートしています。
sktime の最大の強みの一つは、その一貫した API とより広範な Python 機械学習エコシステムとの統合であり、これは初心者から経験豊富な実践者までを問わず、実験を容易にします。sktime ドキュメント や 例題ノートブック は特に非常に良く書かれており、予測や時系列データの問題を頻繁に取り扱う場合は、ぜひブックマークしておく価値があります。
Bala Priya C はインド出身の開発者かつ技術ライターです。数学、プログラミング、データサイエンス、コンテンツ作成が交差する領域での作業を好んでいます。彼女の興味分野および専門知識には、DevOps、データサイエンス、自然言語処理が含まれます。読書、執筆、コーディング、そしてコーヒーを楽しむのが好きです。現在、チュートリアル、ハウツーガイド、意見記事などを執筆することで、開発者コミュニティに知識を共有し、学習に取り組んでいます。また、魅力的なリソースの概要やコーディングチュートリアルも作成しています。
原文を表示
**
# Introduction
If you work with sensor readings, server metrics, or any data that arrives over time, you already know that standard scikit-learn** pipelines don't quite fit. Time series data has structure that tabular models ignore: seasonality, trend, temporal ordering, and the fact that future values depend on past ones.
sktime is a Python library built specifically for this. It gives you a scikit-learn-style API — fit, predict, transform — but designed from the ground up for time series. You can do forecasting, classification, regression, and clustering on time series, all with a consistent interface.
In this article, you'll work through an example problem: forecasting temperature readings from an industrial HVAC sensor. You'll learn how sktime handles time series data, how to build preprocessing pipelines, how to fit forecasters, and how to evaluate them.
You can get the code on GitHub.
# Prerequisites
**
You'll need Python 3.10 or higher and a basic familiarity with pandas. Install everything you need with:
pip install sktime pmdarima statsmodelsIf you'd rather have all optional dependencies in one shot, pip install sktime[all_extras] covers them.
# What Makes sktime Useful
It helps to understand the problem sktime is solving. In scikit-learn, your data is a 2D table — rows are samples, columns are features. Time series data breaks this assumption because each "row" is actually a sequence of values over time, and the order of those values matters.
The main data containers you'll use are:
Data Type
Representation
Description
Series
pd.Series or pd.DataFrame
A single time series used in vanilla forecasting.
Panel
pd.DataFrame with a 2-level MultiIndex
A collection of multiple independent time series.
Hierarchical
pd.DataFrame with a 3+ level MultiIndex
A structured set of time series with aggregation levels across multiple dimensions.
For the time index itself, sktime supports several time indexes: DatetimeIndex, PeriodIndex, Int64Index, and RangeIndex on your pandas objects. The index must be monotonic. If you're using DatetimeIndex, the freq attribute should be set.
# Setting Up the Dataset
Let's create a realistic dataset. Imagine an HVAC sensor in a factory that records temperature every hour. The readings have a daily seasonal pattern (higher during working hours), a slight upward trend due to summer, and some noise.
import numpy as np
import pandas as pd

np.random.seed(42)

# 90 days of hourly readings starting Jan 1, 2026
n_hours = 90 * 24
timestamps = pd.date_range(start="2026-01-01", periods=n_hours, freq="h")

# Trend: gradual 5-degree rise over 90 days
trend = np.linspace(0, 5, n_hours)

# Daily seasonality: temperature peaks at 2pm, dips at 4am
hour_of_day = np.arange(n_hours) % 24
daily_cycle = 4 * np.sin(2 * np.pi * (hour_of_day - 4) / 24)

# Noise
noise = np.random.normal(0, 0.8, n_hours)

# Base temperature around 20°C
temperature = 20 + trend + daily_cycle + noise

# Introduce a few missing values (sensor dropout)
dropout_indices = [300, 301, 302, 1440, 1441]
temperature[dropout_indices] = np.nan

y = pd.Series(temperature, index=timestamps, name="temp_celsius")
y.index.freq = pd.tseries.frequencies.to_offset("h")

print(y.head())
print(f"\nShape: {y.shape}")
print(f"Missing values: {y.isna().sum()}")
print(f"Index type: {type(y.index)}")
Output:
2026-01-01 00:00:00    16.933270
2026-01-01 01:00:00    17.063277
2026-01-01 02:00:00    18.522783
2026-01-01 03:00:00    20.190095
2026-01-01 04:00:00    19.821941
Freq: h, Name: temp_celsius, dtype: float64

Shape: (2160,)
Missing values: 5
Index type:
# Splitting Time Series Data for Training and Testing
Splitting time series data is different from tabular data — you can't shuffle rows. You must always split chronologically: train on earlier data, test on later data.
sktime provides temporal_train_test_split for this purpose:
from sktime.split import temporal_train_test_split

# Hold out the last 7 days (168 hours) as the test set
y_train, y_test = temporal_train_test_split(y, test_size=168)

print(f"Train: {y_train.index[0]} → {y_train.index[-1]}")
print(f"Test:  {y_test.index[0]} → {y_test.index[-1]}")
print(f"Train size: {len(y_train)}, Test size: {len(y_test)}")
Output:
Train: 2026-01-01 00:00:00 → 2026-03-24 23:00:00
Test:  2026-03-25 00:00:00 → 2026-03-31 23:00:00
Train size: 1992, Test size: 168
The function ensures the split is clean and chronological — no data leakage from the future into the training set.
# Defining the Forecasting Horizon
Before fitting any model, you need to tell sktime which time steps you want to predict. This is the ForecastingHorizon.
from sktime.forecasting.base import ForecastingHorizon

# Predict 168 steps ahead (7 days of hourly data)
# is_relative=False means we're using absolute timestamps
fh = ForecastingHorizon(y_test.index, is_relative=False)

print(f"Horizon length: {len(fh)}")
print(f"First forecast point: {fh[0]}")
print(f"Last forecast point:  {fh[-1]}")
This gives:
Horizon length: 168
First forecast point: 2026-03-25 00:00:00
Last forecast point:  2026-03-31 23:00:00
You can also use relative horizons like fh = [1, 2, 3, ..., 168], which means "1 step ahead, 2 steps ahead, ...". Absolute horizons are cleaner when you have actual timestamps you want predictions for.
# Building a Preprocessing and Forecasting Pipeline
Real sensor data has missing values, seasonal patterns, and trend — you need to handle all of these before or during forecasting. sktime's TransformedTargetForecaster lets you chain transformations with a forecaster into a single estimator. The transformations are applied to the target series y before fitting, and automatically reversed on the way out during prediction.
from sktime.forecasting.exp_smoothing import ExponentialSmoothing
from sktime.forecasting.compose import TransformedTargetForecaster
from sktime.transformations.series.impute import Imputer
from sktime.transformations.series.detrend import Deseasonalizer, Detrender

pipeline = TransformedTargetForecaster(
    steps=[
        # Step 1: Fill missing sensor readings using linear interpolation
        ("imputer", Imputer(method="linear")),
        # Step 2: Remove the linear trend so the forecaster sees a stationary series
        ("detrender", Detrender()),
        # Step 3: Remove the daily seasonality (sp=24 for hourly data with 24-hour cycles)
        ("deseasonalizer", Deseasonalizer(model="additive", sp=24)),
        # Step 4: Forecast the cleaned, stationary residuals
        ("forecaster", ExponentialSmoothing(trend=None, seasonal=None)),
    ]
)

pipeline.fit(y_train, fh=fh)
y_pred = pipeline.predict()

print(y_pred.head())
Output:
2026-03-25 00:00:00    21.210066
2026-03-25 01:00:00    21.788986
2026-03-25 02:00:00    22.615184
2026-03-25 03:00:00    23.688449
2026-03-25 04:00:00    24.621127
Freq: h, Name: temp_celsius, dtype: float64
Here's what each step does:
- Imputer(method="linear") fills missing values by linearly interpolating between the surrounding readings, which works well for sensor data.
- Detrender() fits a linear trend to the training series and subtracts it; on prediction it adds the trend back.
- Deseasonalizer(sp=24) removes the 24-hour cycle from the residuals; sp stands for seasonal period.
- Finally, ExponentialSmoothing forecasts the detrended, deseasonalized residuals.
- When predict() is called, all inverse transformations are applied in reverse order automatically, and you get back predictions in the original temperature scale.
# Evaluating the Forecast
sktime integrates with standard evaluation metrics. For forecasting, mean absolute error (MAE) and mean absolute percentage error (MAPE) are common choices.
from sktime.performance_metrics.forecasting import (
    mean_absolute_error,
    mean_absolute_percentage_error,
)

mae = mean_absolute_error(y_test, y_pred)
mape = mean_absolute_percentage_error(y_test, y_pred)

print(f"MAE:  {mae:.3f} °C")
print(f"MAPE: {mape*100:.2f}%")
Output:
MAE:  0.584 °C
MAPE: 2.40%
# Swapping in a Different Forecaster
One of the biggest advantages of the sktime interface is that swapping the underlying algorithm requires changing just one line. Let's try an ARIMA model in place of exponential smoothing and compare.
from sktime.forecasting.arima import ARIMA

pipeline_arima = TransformedTargetForecaster(
    steps=[
        ("imputer", Imputer(method="linear")),
        ("detrender", Detrender()),
        ("deseasonalizer", Deseasonalizer(model="additive", sp=24)),
        # ARIMA(1,1,1) on the cleaned residuals
        ("forecaster", ARIMA(order=(1, 1, 1), suppress_warnings=True)),
    ]
)

pipeline_arima.fit(y_train, fh=fh)
y_pred_arima = pipeline_arima.predict()

mae_arima = mean_absolute_error(y_test, y_pred_arima)
mape_arima = mean_absolute_percentage_error(y_test, y_pred_arima)

print(f"ARIMA MAE:  {mae_arima:.3f} °C")
print(f"ARIMA MAPE: {mape_arima*100:.2f}%")
Output:
ARIMA MAE:  0.586 °C
ARIMA MAPE: 2.41%
The key point is that the preprocessing steps — imputation, detrending, deseasonalization — stayed identical. You only changed the final forecaster, and everything else composed cleanly around it.
# Cross-Validating Across Time
Holding out a single test window can be misleading. sktime provides time series cross-validation through splitters that respect temporal ordering.
SlidingWindowSplitter uses a rolling window: the training window slides forward in time, always staying the same length. ExpandingWindowSplitter grows the training set cumulatively as you move forward, which is more appropriate when you want to use all available history.
from sktime.split import ExpandingWindowSplitter
from sktime.forecasting.model_evaluation import evaluate

# Expanding window: start with 1800-hour train set, evaluate on 168-hour windows
cv = ExpandingWindowSplitter(
    initial_window=1800,
    fh=list(range(1, 169)),
    step_length=168,
)

results = evaluate(
    forecaster=pipeline,
    y=y,
    cv=cv,
    scoring=mean_absolute_error,
    return_data=False,
)

print(results[["test__DynamicForecastingErrorMetric", "fit_time"]].round(3))
print(f"\nMean CV MAE: {results['test__DynamicForecastingErrorMetric'].mean():.3f} °C")
Output:
   test__DynamicForecastingErrorMetric  fit_time
0                                0.627     0.274
1                                0.585     0.100

Mean CV MAE: 0.606 °C
evaluate returns a DataFrame with per-fold metrics and timing. The cross-validation MAE confirms that the model generalizes consistently across different time windows in the data.
# Next Steps
This article covered the core forecasting workflow in sktime, but the library extends far beyond basic prediction tasks.
It also supports time-series classification, probabilistic forecasting with uncertainty estimates, training shared models across multiple related time series, adapting traditional machine learning algorithms for sequential forecasting, and automating model selection and tuning workflows.
One of sktime's biggest strengths is its consistent API and integration with the broader Python machine learning ecosystem, making experimentation easier for both beginners and experienced practitioners. The sktime docs and example notebooks are especially well-written and are worth bookmarking if you regularly work with forecasting or temporal data problems.
Bala Priya C** is a developer and technical writer from India. She likes working at the intersection of math, programming, data science, and content creation. Her areas of interest and expertise include DevOps, data science, and natural language processing. She enjoys reading, writing, coding, and coffee! Currently, she's working on learning and sharing her knowledge with the developer community by authoring tutorials, how-to guides, opinion pieces, and more. Bala also creates engaging resource overviews and coding tutorials.
関連記事
Python を用いた時系列分析の習得に向けた7 つのステップ
KDnuggets が公開した記事は、Python を活用して時系列データを効果的に分析・処理するための具体的な7 つの手順を解説している。
データサイエンティストが知るべき Python の必須概念 5 つ
この記事は、データサイエンティストがスパゲッティコードから高速で生産レベルのデータパイプラインへ移行するために必要な Python の 5 つの必須概念を詳しく解説しています。
シミュレーション「もしも」のシナリオに役立つ SciPy.stats の 5 つの技
KDnuggets が紹介する記事では、SciPy.stats モジュールを活用して「もしも」のシナリオをシミュレーションするための 5 つの実用的なテクニックが解説されています。
今日のまとめ
AI日報で今日の重要ニュースをまとめ読み