Google Cloud、BigQuery Graph に測定値機能を追加
本文の状態
日本語全文を表示中
詳細モードで約5分の本文を読めます。
同じ出来事の情報源
この情報源を基点に整理
Google Cloud AI
従来のフラットなテーブルでは捉えきれない「なぜ」という文脈を、BigQuery Graph が補完し、AI エージェントが正確な洞察を提供できるようにする。
Continue in AI NEW LAB
このニュースを、実務の判断につなげる
AI NEW LABで、試したことや先に確認したい条件を共有できます。まずはログインなしで読めます。
AI NEW LABで論点を見るAI深層分析を開く2026年8月14日 04:15
AI深層分析
キーポイント
エージェントの推論精度向上
従来のフラットなテーブルでは捉えきれない「なぜ」という文脈を、BigQuery Graph が補完し、AI エージェントが正確な洞察を提供できるようにする。
計測値と関係性の統合
BigQuery Graph のプレビュー機能により、統制された指標(measures)とビジネスエンティティ間の複雑な依存関係を単一のプラットフォームで管理可能にする。
システム断絶の解消
サプライヤー関係マップと SQL メトリクスを別々のシステムで維持する非効率な運用を解消し、ランタイムでの結合コストや不整合リスクを低減する。
ゼロETLでのプロパティグラフへのマッピング
既存のテーブルをゼロETLでプロパティグラフにマッピングできるため、メジャー機能によりデータ統合が実現される。
問い合わせの論理的進化の支援
メタデータによるデータの把握、ビジネス指標によるパフォーマンス計算、関係性マップによる原因特定という3段階で問いを深化させる。
重要な引用
Agents are prone to inaccurate insights when working with directly raw tables.
BigQuery Graph helps organizations move beyond flat, static tables to represent enterprises exactly how they exist in the physical world
This process is slow, expensive, and leads to inconsistent KPI calculations.
map existing tables to a property graph in-place with zero ETL
編集コメントを表示
編集コメント
AI エージェントの実用化において最大の障壁の一つである「文脈の欠如」を、データ基盤レベルで解決するアプローチは画期的である。BigQuery Graph の新機能は、単なる分析ツールの進化ではなく、自律型システムが現実世界の問題を解決するための信頼性を担保する重要な一歩となる。
Source Article
元記事を日本語で読む
本文に関係しない購読案内、埋め込み通知、サイト内プロモーションは除いています。
企業が単純なチャットアシスタントから自律型のエージェントワークロードへ移行する際、すぐに直面するのが厳しい現実です。生データテーブルを直接扱うと、エージェントは不正確な洞察を下しがちになります。
BigQuery Graph は、組織が平面的で静的なテーブルから脱却し、物理世界における企業の実態——相互接続されたビジネスエンティティであり、現実世界の依存関係を持つ存在——を正確に表現することを可能にします。BigQuery Graph(プレビュー)の「measures」機能のサポートにより、管理された指標とリレーションシップマッピングが統合されます。これにより、エージェントはグラフに捕捉された複雑な依存関係を、measures の精度を持って推論できるようになります。
なぜ関係性が重要なのか
従来のデータ構造は、多段階にわたるビジネス文脈を認識できません。その結果、AI エージェントが誤った業務判断を下す原因となります。
- 具体的な課題: 小売業者が「シアトルでの冬用ジャケットの売上が 12% 減少した理由」をエージェントに問うたとします。エージェントは平面的なテーブルを検索して、「何(12% の減少)」については報告できます。しかし、なぜそうなったのかという「理由」には対応できません。その理由は、シアトルの注文 ➔ 配送センター ➔ 地域的な嵐によるサプライヤーの遅延といった、関係性の経路をたどらなければ理解できないからです。
システムが分断されているリスク:関係性の文脈を欠いたエージェントは、無関係な 15% オフキャンペーンを提案し、余計に利益率を削ってしまう可能性があります。さらに、一つのチームが別々のグラフデータベースでサプライヤー間の関係をマッピングし、別のチームが SQL メトリクスを管理するというようにシステムを分断して維持することは、エージェントが実行時にこれらのスタックをつなぎ合わせることを強いることになります。このプロセスは遅く、高価であり、一貫性のない KPI 計算につながります。
BigQuery Graph の Measures は、ETL をゼロにして既存のテーブルをその場でプロパティグラフにマッピングできることで、この課題を解決します。この統合された設定により、問いかけの論理的な進化が可能になります。
- メタデータグラウンディング(Metadata grounding)は、どのようなデータが存在するかを明確にします。
- ビジネス指標(measures)は、ビジネスのパフォーマンスを計算します。
- リレーションシップマッピング(graph)は、その理由を明らかにします。
仕組みの内部
従来、グラフ走査中の標準 SQL の結合では行が重複し、集計計算に誤りが生じていました。BigQuery Graph はこれをネイティブで解決しています。
データモデラーは、プロパティグラフの DDL 内で直接 SUM や AVG といった MEASURE を定義できます。標準 SQL では、GRAPH_EXPAND 関数と AGG ...
アグリゲーターにおいて、エンジンが構造的グラフパスを解決する前に
指標の評価を行います。これにより、エージェントが「計算機(SQL)」を必要とするタイミングと、「マップ(グラフ)」を必要とするタイミングを賢く判断できるようになります。
public projects の bigquery-public-data は厳格に読み取り専用であるため、論理プロパティグラフを自分のプロジェクト内でマッピングする際はプレースホルダー変数(YOUR_PROJECT_ID)を使用し、読み取り専用の公開テーブルはノードとエッジとして直接参照する必要があります。
- BigQuery Studio におけるグラフ知能の民主化
開発者とビジネスユーザーの両者がこれらの関係ネットワークを管理・展開する際の摩擦をなくすため、BigQuery Studio にはネイティブで直感的な運用ツールを直接実装しました:
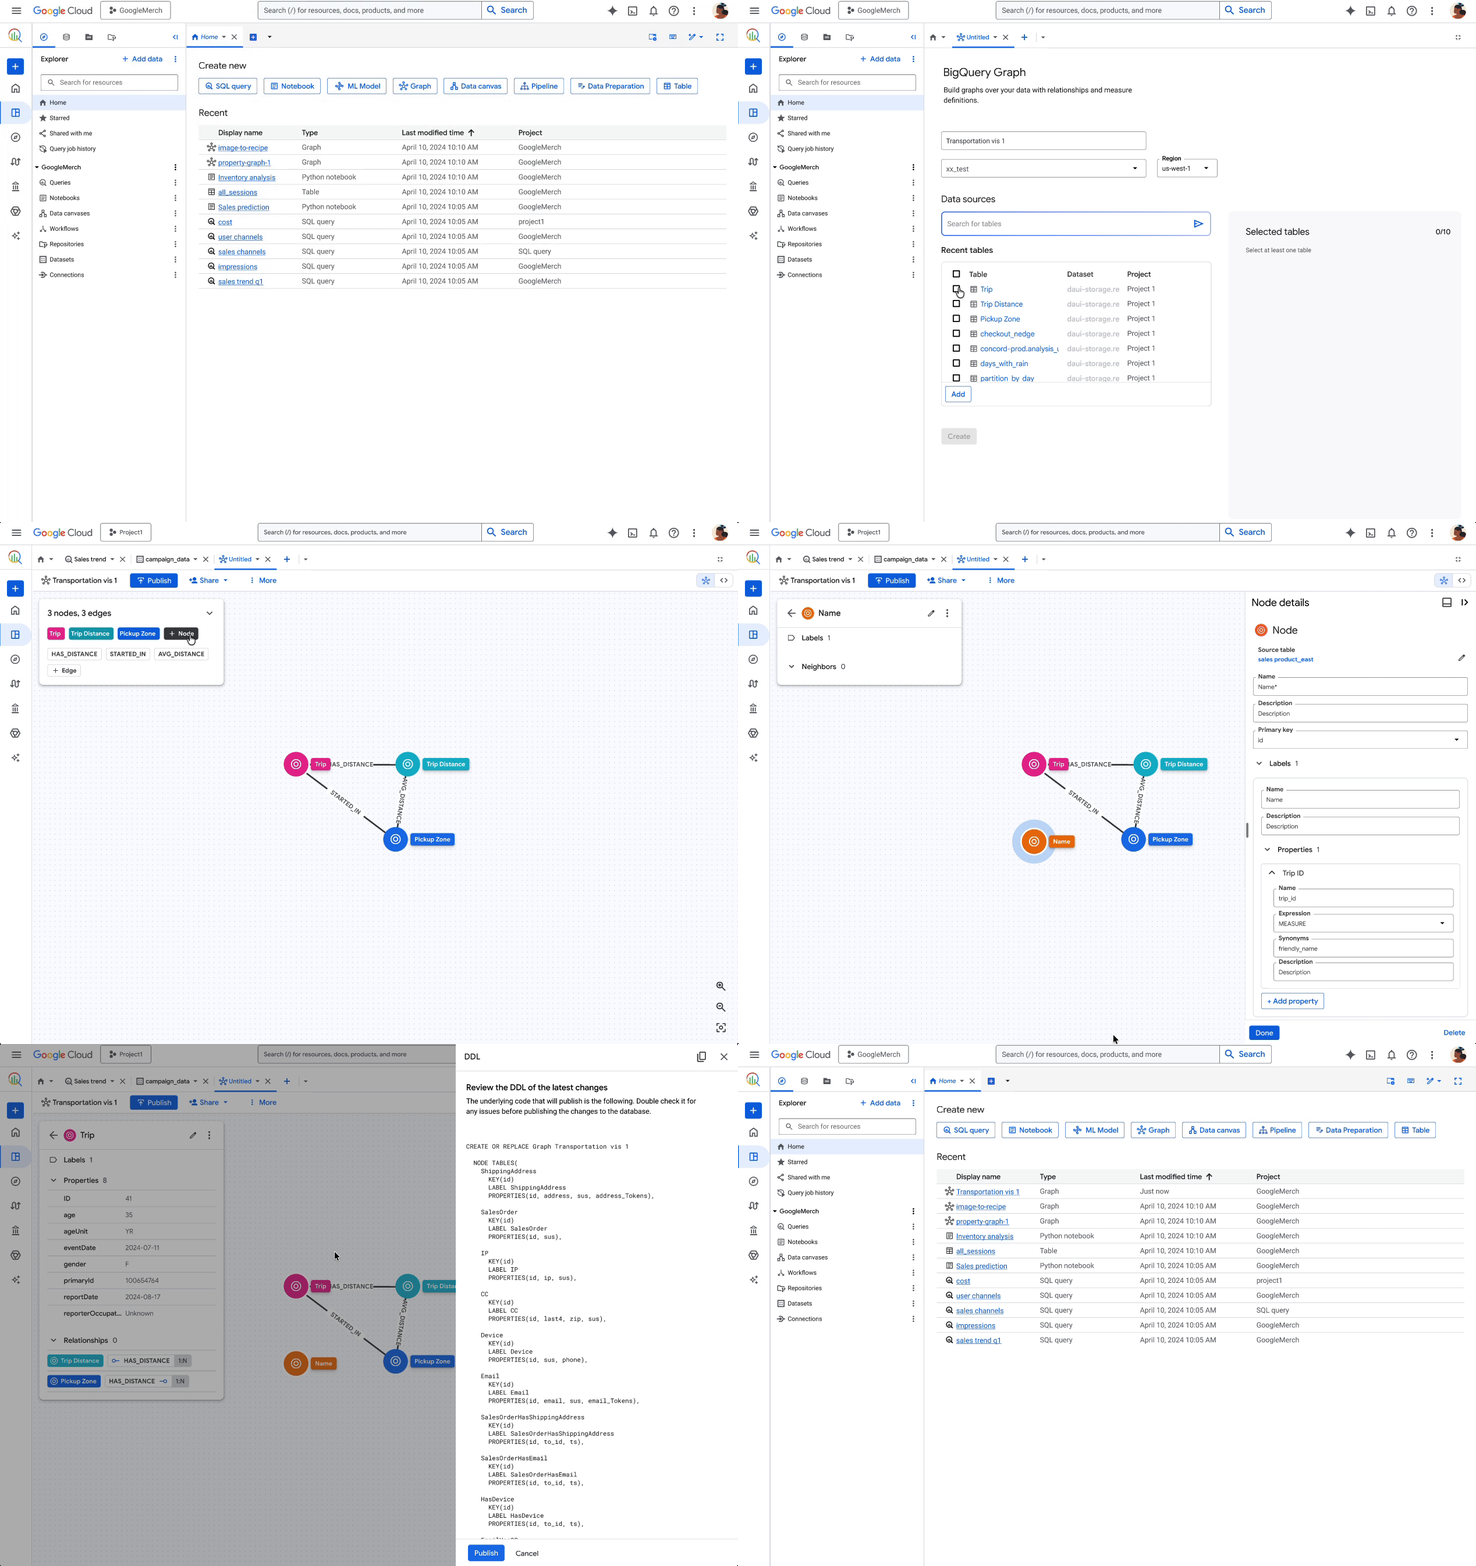
ビジュアルグラフモデラー: BigQuery Studio 内に組み込まれたノーコードのドラッグ&ドロップインターフェースです。複雑な DDL スクリプトを手動で記述することなく、視覚的にプロパティグラフ、ノード、エッジを構築・編集・マッピングできます。
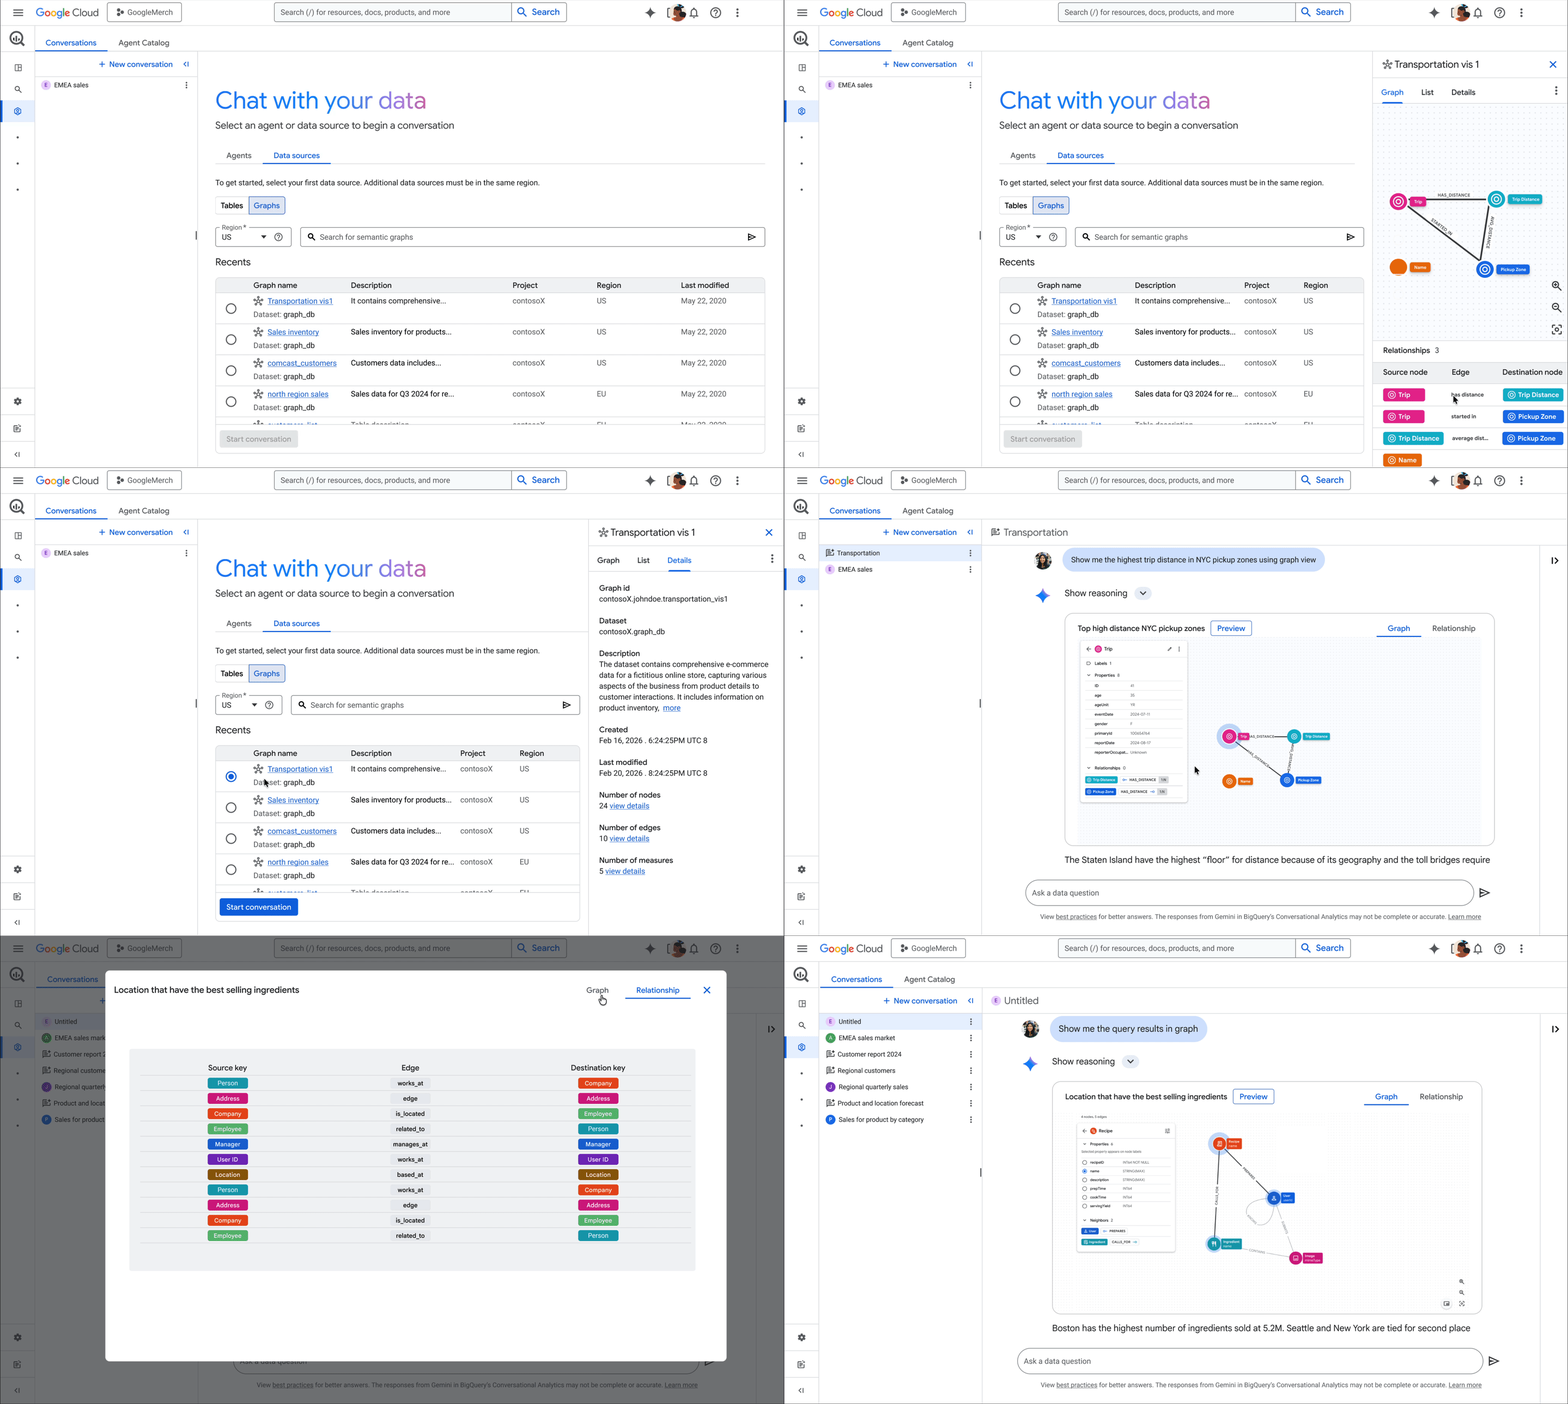
- Conversational Analytics (CA) の統合: ユーザーは自然な形でグラフと対話できます。テーブル結合を推測する代わりに、Conversational Analytics エージェントは決定論的で関係性を意識したグラフマップをナビゲートし、自然言語の質問を境界条件に制約された正確な GoogleSQL または ISO GQL クエリに変換します。これによりモデルの誤生成(ハルシネーション)を防ぎ、意味的な一貫性を保証します。
統一されたセマンティクス:ネイティブ Looker 統合
断片化されたロジックスタックの維持を避けるため、ビジネス指標はデータレイヤーに存在させる必要があります。BigQuery Graphs をネイティブな in-database analytic models として Looker (LookML) と統合することで、コアとなるロジックを一度だけ定義できます。
- データベース管理モデル (
sql_analytic_model_name): sql_analytic_model_name を使用して Looker を直接、データベースで定義された BigQuery Graph にポイントします。これにより、標準的な LookML の次元と指標をグラフのプロパティに直接マッピングできます。
- Looker 管理モデル (
derived_analytic_model): derived_analytic_model を使用して、BigQuery Graph のスキーマを LookML ビュー内で直接定義します。Looker が動的に SQL DDL ステートメントを生成・実行し、BigQuery 内のグラフを維持します。
- エンタープライズ DevOps ワークフロー: Looker IDE、Git ベースのバージョン管理、そして Continuous Integration (CI) を活用して、グラフのライフサイクル全体を管理します。コア KPI(チャーンレートなど)は完全に同一であり、検証済みで信頼性があります。
原文を表示
When enterprises transition from using simple chat assistants to autonomous, agentic workloads, they quickly run into a hard truth: Agents are prone to inaccurate insights when working with directly raw tables.
BigQuery Graph helps organizations move beyond flat, static tables to represent enterprises exactly how they exist in the physical world: as interconnected business entities with real-world dependencies. With the support of measures in BigQuery Graph (preview), we are unifying governed metrics with relationship mapping. This allows your agents to reason across complex dependencies captured in graphs with precision of measures.
Why relationships matter
Traditional data structures are blind to multi-hop business context, causing AI agents to make incorrect operational decisions:
- The concrete problem: If a retailer has an agent who is asked why winter jacket sales dropped 12% in Seattle, it can query flat tables to report the what (the 12% dip). But it fails at the why because it cannot trace the relational path: Seattle orders ➔ distribution centers ➔ suppliers delayed by regional storms.
- The risk of disjointed systems: Lacking relationship context, the agent suggests an irrelevant 15% markdown campaign, needlessly eroding margins. Furthermore, maintaining separate systems - where one team maps supplier relationships in a separate graph database while another maintains SQL metrics - forces your agent to stitch these stacks together at runtime. This process is slow, expensive, and leads to inconsistent KPI calculations.
Measures in BigQuery Graph solves this by letting you map existing tables to a property graph in-place with zero ETL. This unified setup enables a logical evolution of inquiry:
- Metadata grounding establishes what data you have.
- Business metrics (measures) calculate how your business performed.
- Relationship mapping (graph) uncovers why it happened.
Under the hood
Historically, standard SQL joins during graph traversals duplicate rows, leading to incorrect aggregation calculations. BigQuery Graph solves this natively.
Data modelers define a MEASURE (like SUM or AVG) directly within the Property Graph DDL. Using standard SQL via the GRAPH_EXPAND function and the AGG aggregator, the engine resolves the structural graph paths before evaluating metrics. This ensures your agent is smart enough to know when it needs a calculator (SQL) and when it needs a map (graph).
Because public projects like bigquery-public-data are strictly read-only, you must map the logical property graph inside your own project using a placeholder variable (YOUR_PROJECT_ID), while directly referencing the read-only public tables as nodes and edges.
code_block
- )])]>
Democratizing graph intelligence in BigQuery Studio
To make managing and deploying these relationship networks frictionless for both developers and business users, we have built native, intuitive operational tools directly into BigQuery Studio:
Visual graph modeler: A no-code, drag-and-drop interface inside BigQuery Studio that lets you visually build, edit, and map property graphs, nodes, and edges without writing complex DDL scripts manually.
- Conversational Analytics (CA) integration: Users can interact with the graph naturally. Instead of guessing table joins, Conversational Analytics agents navigate the deterministic, relationship-aware map of the graph, converting natural language questions into precise, boundary-constrained GoogleSQL or ISO GQL queries. This prevents model hallucinations and enforces semantic consistency.
Unified semantics: Native Looker integration
To avoid maintaining fragmented logic stacks, business metrics must live at the data layer. By integrating Looker (LookML) natively with BigQuery Graphs asin-database analytic models, you define logic once at the core:
- Database-managed models (sql_analytic_model_name): Point Looker directly to your database-defined BigQuery Graph using sql_analytic_model_name to map standard LookML dimensions and measures directly to your graph properties.
- Looker-managed models (derived_analytic_model): Define your BigQuery Graph schema directly inside your LookML view using derived_analytic_model. Looker will dynamically generate and execute the SQL DDL statements to maintain the graph inside BigQuery.
- Enterprise DevOps workflows: Manage your graph's entire lifecycle using the Looker IDE, Git-based version control, and Continuous Integration (CI). Core KPIs (like Churn Rate) remain completely identical, verified, and trusted.
関連記事
今日のまとめ
AIデイリーブリーフで今日の重要ニュースをまとめ読み