本番環境でエージェントが自己修復する仕組み
LangChainのソフトウェアエンジニアが、GTM Agent向けに構築した自己修復デプロイパイプラインは、デプロイ後の回帰を自動検出・トリアージし、修正PRを自動生成するエージェントを起動することで、人手を介さずに問題を解決する仕組みを実現している。
キーポイント
自己修復デプロイパイプラインの概要
GTM Agent向けに構築されたパイプラインは、デプロイ後に回帰を自動検出し、変更が原因かどうかをトリアージした上で、修正PRを自動生成するエージェントを起動し、レビュー時まで人手を介さずに問題解決を閉じる。
Dockerビルド失敗の自動検出と対応
デプロイ直後にビルドログをチェックし、Dockerイメージのビルド失敗を検出すると、エラーログと直前のコミット差分を自動取得し、Open SWEエージェントに渡して修正PRを生成する。
デプロイ後エラーの監視とノイズ分離
サーバーサイドの回帰検出では、過去7日間のエラーログをベースラインとして収集し、エラー署名に正規化してバケット化することで、変更によるエラーと既存のノイズを分離する。
Open SWEエージェントによる自動修正
オープンソースの非同期コーディングエージェントであるOpen SWEが、コードベースの調査、修正の作成、PRのオープンを自動で行い、生産環境のエラーと修正プロセスを接続する。
Poisson分布を用いた統計的検定による回帰検出
7日間のベースラインデータから時間当たりの期待エラー率を推定し、デプロイ後60分間の観測エラー数と比較することで、統計的に有意な増加(p < 0.05)を検出する。
トリアージエージェントによる因果関係の検証
変更ファイルを分類し、ランタイム変更の場合のみ、具体的なコード変更行と観測エラーの間の因果関係を確立することで、誤検知を防止する。
Future Improvements for Self-Healing System
The author outlines several planned enhancements including widening the lookback window for bug attribution, implementing smarter error grouping using vector embeddings or smaller models, and adopting a more nuanced approach to deciding between fix-forward strategies and rollbacks based on severity and confidence.
影響分析・編集コメントを表示
影響分析
この記事は、AIエージェントによる完全自動化されたデプロイ運用の実現可能性を示す重要な事例であり、ソフトウェア開発の運用負荷を大幅に軽減するパラダイムシフトを予感させる。特に、回帰検出の自動化と修正エージェントの連携は、DevOpsからAIOpsへの進化を具体化しており、AI駆動のソフトウェアエンジニアリングの新たな標準となり得る。
編集コメント
AIエージェントが単なる実験段階を超え、実運用環境でのクリティカルな問題解決に適用された画期的な事例。開発者の運用負荷を根本から変える可能性を秘めた実用的なソリューションとして注目に値する。
 imageBy Vishnu Suresh, Software Engineer @ LangChain
このブログは最初にXで公開されました。
私はGTM Agentのための自己修復型デプロイメントパイプラインを構築しました。すべてのデプロイ後、このパイプラインはリグレッションを検出し、変更が原因かどうかをトリアージし、修正を含むPRを作成するエージェントを起動します。レビュー時まで手動介入は一切必要ありません。
リリースの難しい部分は、コードをデプロイすることではありません。その後のすべてです。つまり、直前のデプロイが何かを壊していないか確認し、実際に自らの変更が原因かを判断し、ユーザーが気づく前に修正することです。私は、デプロイしたら次に進み、何かがリグレッションしてもシステムが自動的に検知して対処する、そんな信頼性を求めていました。
自己修復フローの仕組み
GTM AgentはDeep Agents上で動作し、LangSmith Deploymentsを通じてデプロイされます。私たちは既に「Open SWE」という内部のコーディングエージェントを保有していました。これはオープンソースの非同期コーディングエージェントで、コードベースを調査し、修正を書き、PRを作成できます。欠けていたピースは、本番環境のエラーをOpen SWEにつなぐための、自動化されたリグレッション検出とトリアージでした。
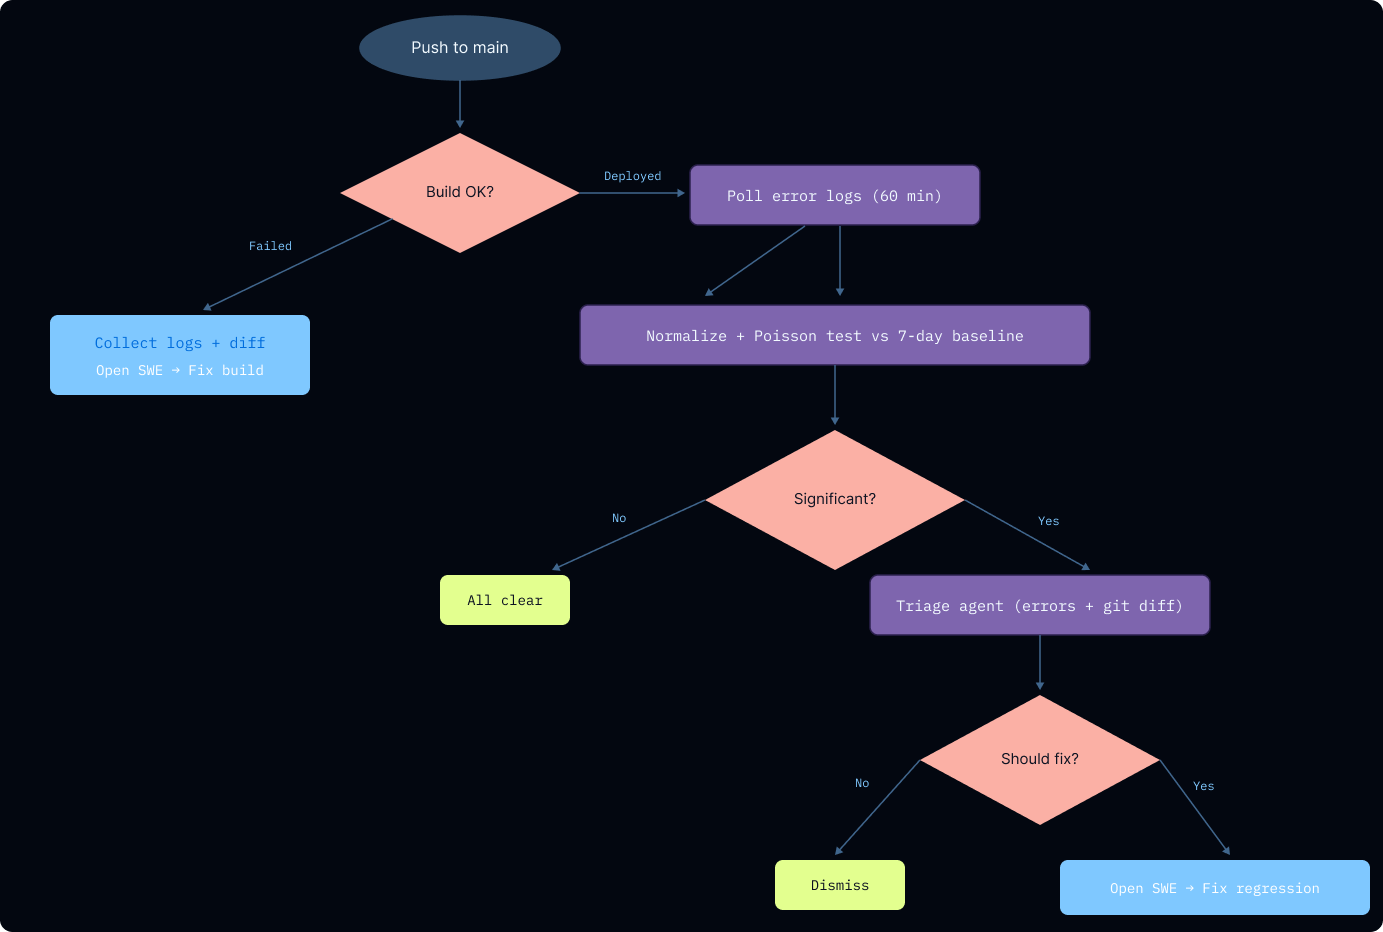 imagemainブランチへのデプロイ直後、自己修復用のGitHub Actionがトリガーされ、ビルドログとサーバーログを取得します。フローには2つの経路があります。ビルド失敗を即座に捕捉する経路と、監視期間内にサーバーサイドのリグレッションを検出する経路です。どちらかで実際の問題が見つかると、Open SWEが起動され、修正を行ってPRを作成します。
Dockerビルド失敗の捕捉
まず、ビルドログをチェックし、Dockerイメージが正常にビルドされることを確認します。イメージのビルドに失敗した場合、パイプラインは自動的にCLIからのエラーログを取得し、mainブランチへの直前のコミットからのgit diffをフェッチし、それをOpen SWEに渡します。人的介入は一切ありません。ビルド失敗はほぼ常に直近の変更によって引き起こされるため、限定されたdiffがOpen SWEに行動するための十分な文脈を提供します。
デプロイ後のエラー監視
サーバーサイドの問題は、ビルド失敗よりも扱いが難しいものです。あらゆる本番システムには、一定の背景エラー率、ネットワークタイムアウト、サードパーティAPIの問題、一時的な障害が存在します。理想を言えば、一つひとつのエラーを追跡して修正すべきですが、「直前のデプロイが何かを壊したか」という問いに答えようとするときは、自らの変更が引き起こしたエラーと、元から存在していたノイズとを区別する必要があります。このステップがその役割を果たします。
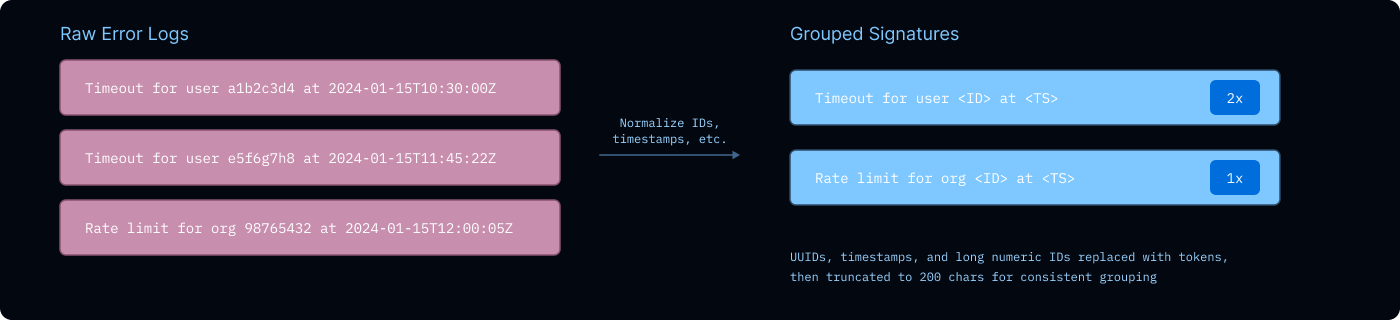
まず、過去7日間のすべてのエラーログをベースラインとして収集します。これらはエラーシグネチャに正規化されます。具体的には、正規表現を使ってUUID、タイムスタンプ、長い数値文字列を置換し、200文字に切り詰めます。これにより、論理的に同一のエラーは、詳細が異なっていても一つのグループにまとめられます。
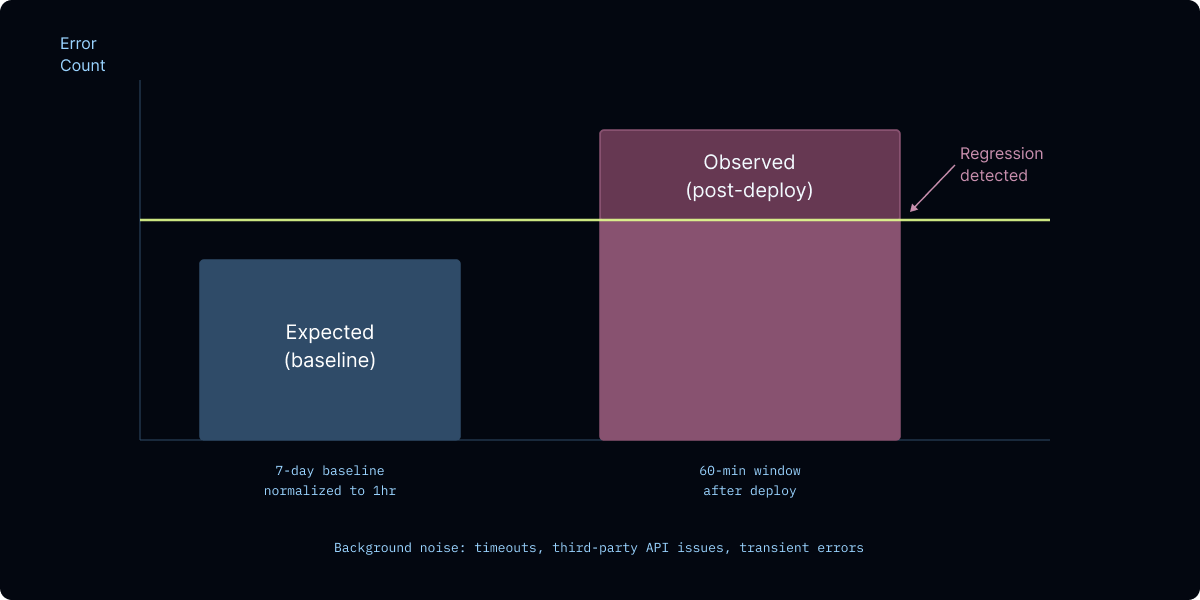
 image次に、デプロイ後の60分間の監視ウィンドウにおいて、現在のリビジョンからのエラーをポーリングし、同じ方法で正規化します。このウィンドウが閉じると、2つの異なる時間スケール(1週間分のベースラインデータと1時間分のデプロイ後データ)からのエラーカウントが得られます。単純にこの2つの数字を比較して最新の変更がエラーを引き起こしたか検出することも可能ですが、私はより原理に基づいたアプローチを取りたかったのです(ついでに確率分布の復習もしました)。
ポアソン検定によるゲーティング
ポアソン分布は、既知の平均発生率(λ)と、事象が独立しているという仮定のもとで、一定期間内に事象が発生する回数をモデル化します:
 image私の考えでは、あらゆる本番システムは常に背景エラー率、ネットワークタイムアウト、サードパーティAPIの問題などを抱えています。これらのベースラインエラーは、ポアソンモデルに合理的によく適合します。
7日間のベースラインを使用して、各エラーシグネチャについて1時間あたりの期待エラー率を推定し、それを60分のデプロイ後ウィンドウにスケーリングします。観測されたカウントが分布の予測値を有意に上回る場合(p < 0.05)、それを潜在的なリグレッションとしてフラグ付けします。ベースラインに全く存在しない、完全に新しいエラーシグネチャについては、監視ウィンドウ内で繰り返し発生した場合にフラグ付けします。
 imageしかし、サーバーエラーは常に独立しているとは限りません。トラフィック急増やAPI障害に起因する相関失敗は、独立性の仮定に違反する可能性があります。また、統計的検定だけでは、「コード変更が原因でこのエラーが急増した」のか、「サードパーティAPIがダウンしたためにこのエラーが急増した」のかを区別できません。ここでトリアージエージェントが登場します。
トリアージエージェント
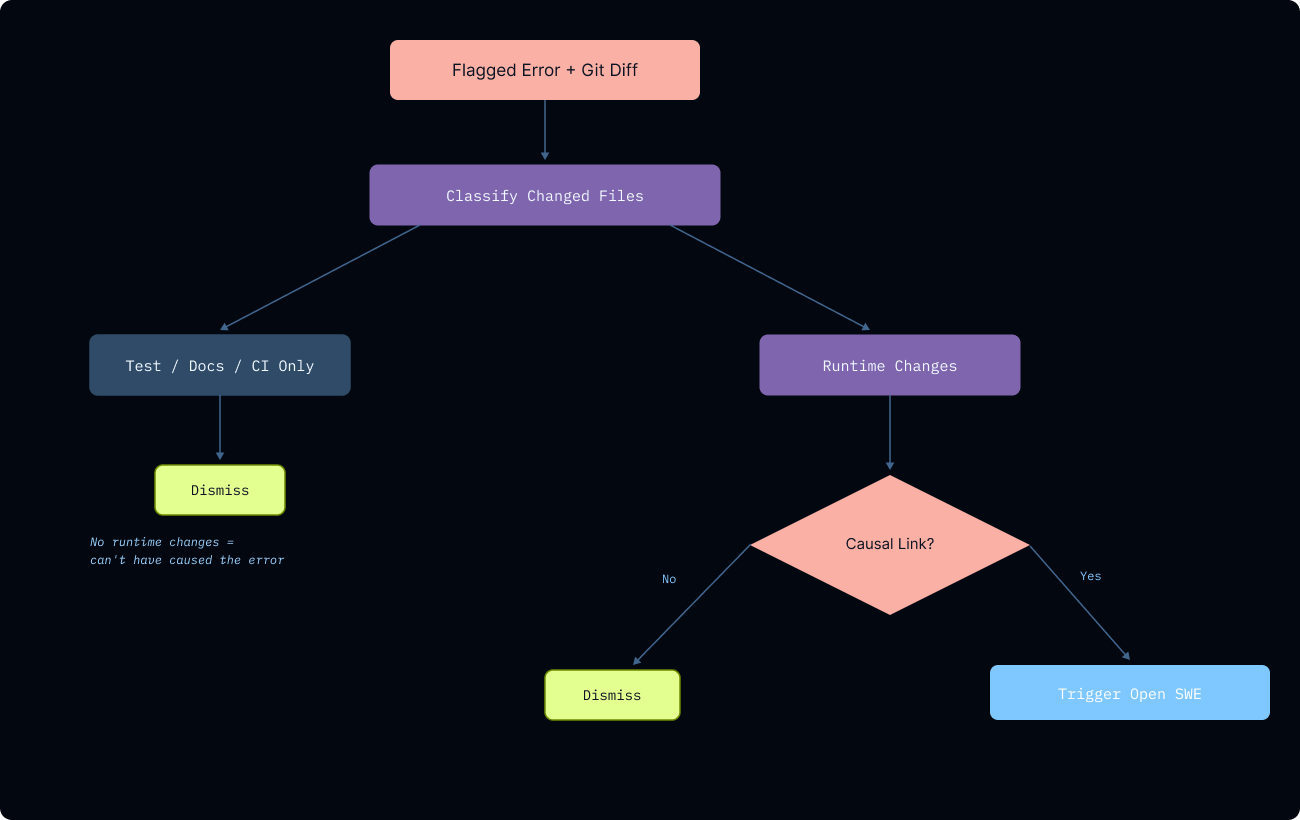 imageエラーを(変更を加えたがる傾向にある)Open SWEに直接送り込む代わりに、別のゲーティング機構を追加しました。直前のコミットからのdiffと具体的なエラーは、Deep Agents上に構築されたトリアージエージェントに渡されます。
まず、トリアージエージェントは変更されたすべてのファイルを、ランタイム、プロンプト/設定、テスト、ドキュメント、CIのいずれかに分類します。デプロイが非ランタイムファイルのみに触れている場合、そのデプロイがエラーを引き起こした可能性は極めて低いです。これにより、エージェントがテストファイルと本番バグの間に架空の因果関係を見出してしまうような誤検知を防ぎます。
ランタイム変更については、エージェントはdiff内の特定の行と観測されたエラーの間の具体的な因果関係を確立しなければなりません。
エージェントは、その判断、確信度、推論、および変更に起因すると考えるエラーシグネチャを含む、構造化された判定を返します。この絞り込みにより、Open SWEは急増したすべてのエラーの羅列ではなく、焦点を絞った調査プロンプトを受け取ることになります。
Open SWEによるループの完結
トリアージエージェントが調査を承認すると、Open SWEが引き継ぎ、バグに対処してPRを作成します。レビュー準備が整った時点で通知が届くため、エラー検出から修正提案までの全フローが、人手を介さずに行われます。
これまでのところ、この仕組みは、大きなクラッシュを起こさないバグを捕捉するのに最も有用でした。誤ったデフォルト値を返すサイレント障害、コードとデプロイメント間の設定不一致、そして一つのバグを修正すると次のデプロイで次のバグが表面化する連鎖リグレッションなどです。
今後の改善点
より広い遡及範囲
トリアージエージェントは現在、現在のデプロイ済みリビジョンとその直前のリビジョンとの間のdiffを調べます。以前のデプロイで導入され、後になってから表面化するバグは、自動的には原因帰属されません。遡及範囲を広げることは明白な改善策ですが、トリアージに供給するdiffが大きくなるほど、シグナルはノイズの多いものになり、因果関係の特定が難しくなります。適切なバランスはまだ見つかっていません。
よりスマートなエラーグループ化
現在のアプローチは、エラーメッセージからIDやタイムスタンプを除去するファジーマッチングを使用しています。これは正しく動作するまでに時間がかかり、除去ロジックの限界により、関連するエラーが一緒にグループ化されないケースがまだ残っているかもしれません。
検討しているアイデアの一つは、エラーメッセージをベクトル空間に埋め込み、正規表現による正規化に頼るのではなく、それらをクラスタリングする方法です。同じ意味を持つエラーは、表面的な違いに関わらず自然に近くに位置し、デプロイ後に新しいクラスターが形成されるか、既存クラスターが成長することを監視することでリグレッションを検出できます。課題は、意味のあるクラスターの変化と通常のばらつきとを区別する距離の閾値を調整することです。
別の選択肢は、より小型で低コストなモデルを使用してエラーを分類・グループ化し、その構造化されたクラスターを調査プロンプトの一部としてOpen SWEに直接渡すことです。これにより、何が失敗しているのか、完全なエラーがどのように見えるのかについて、はるかに豊かな情報を提供できます。
Ramp社は、そのSheets製品を自己維持させるために興味深いアプローチを採用しました。すべてのPRマージ時に、LLMがdiffを読み取り、変更されたコードに合わせたモニターを生成します。各モニターには、エラー率の急増やレイテンシーのリグレッションなど、明示的な閾値が設定されています。モニターが作動すると、ウェブフックがアラートの文脈を直接エージェントに送信してトリアージを行います。事前に定義された、対象を絞ったモニターにより、はるかに明確なシグナルが生成され、下流のエージェントが問題を診断しやすくなります。
前進修正 vs ロールバック
現在、システムは常に前進修正を行い、Open SWEは問題のあるデプロイメントが稼働したままPRで作業します。よりスマートなアプローチは、重大度、エラー率、およびトリアージの確信度に基づいて、前進修正とロールバックのどちらかを選択することです。因果関係の確信度が低いにもかかわらず重大度の高いエラー急増は即時ロールバックを正当化するかもしれませんが、明確な修正方法が判明しており原因帰属が確実なバグは、パッチを前進させることでより適切に処理できるでしょう。
結論
このパターンは、デプロイメントの提供においてより一般的になっていくと考えています。システムが自らのリグレッションを検出、トリアージ、修正できるようになればなるほど、リリースは速くなり、エンジニアがダッシュボードを監視する時間を減らして、構築に集中できる時間が増えるからです。
原文を表示
imageBy Vishnu Suresh, Software Engineer @ LangChain
This blog was initially published on X.
I built a self-healing deployment pipeline for our GTM Agent. After every deploy, it detects regressions, triages whether the change caused them, and kicks off an agent to open a PR with a fix, with no manual intervention needed until review time.
The hard part of shipping isn't getting code out. It's everything after: figuring out if your last deploy broke something, whether it's actually your fault, and fixing it before users notice. I wanted to deploy, move on, and trust that if something regressed, the system would catch it and close the loop itself.
How the Self-Healing Flow Works
The GTM Agent runs on Deep Agents and deploys through LangSmith Deployments. We already had an internal coding agent called Open SWE, an open-source async coding agent that can research a codebase, write fixes, and open PRs. The missing piece was automated regression detection and triage to connect production errors back to Open SWE.
imageRight after a deployment to main, a self-healing GitHub Action triggers, capturing the build and server logs. The flow has two paths: catching build failures immediately, and detecting server-side regressions over a monitoring window. If either path finds a real issue, Open SWE gets kicked off to fix it and open a PR.
Catching Docker Build Failures
First, we check the build logs to make sure the Docker images build properly. If the image fails to build, the pipeline automatically pipes the error logs from the CLI, fetches the git diff from the last commit to main, and hands it off to Open SWE — no human involved. Build failures are almost always caused by the most recent change, so a narrow diff gives Open SWE enough context to act on.
Monitoring for Post-Deploy Errors
Server-side issues are trickier than build failures. Any production system carries a background error rate, network timeouts, third-party API issues, transient failures. In an ideal world you'd track and fix every single one, but when you're trying to answer "did my last deploy break something," you need to separate the errors your change caused from the noise that was already there. That's what this step does.
First, I collect a baseline of all error logs from the past 7 days. These get normalized into error signatures, regex replaces UUIDs, timestamps, and long numeric strings, then truncates to 200 characters, so logically identical errors get bucketed together even when the specifics differ.
imageNext, I poll for errors from the current revision over a 60-minute window after deployment, normalizing the same way. Once that window closes, I have error counts from two very different time scales—a week of baseline data and an hour of post-deployment data. While I could naively compare these two numbers to detect if our latest change caused an error, I wanted to take a more principled approach (and brush up on my probability distributions ).
Gating with a Poisson Test
A Poisson distribution models how many times an event occurs in a fixed interval, given a known average rate (λ) and the assumption that events are independent:
imageMy view is that any production systems always carry a background error rate, network timeouts, third-party API issues, etc. These baseline errors fit a Poisson model reasonably well.
Using the 7-day baseline, I estimate the expected error rate per hour for each error signature, then scale it to the 60-minute post-deployment window. If the observed count significantly exceeds what the distribution predicts (p < 0.05), I flag it as a potential regression. For error signatures that are completely new (not present in the baseline at all), I flag them if they occur repeatedly in the monitoring window.
imageBut server errors aren't always independent. Correlated failures from traffic spikes or API outages can violate the independence assumption, and a statistical test alone can't distinguish "this error spiked because of our code change" from "this error spiked because a third-party API went down." That's where the triage agent comes in.
The Triage Agent
imageRather than feeding errors directly into Open SWE (which is tempted to make changes), I add another gating mechanism. The diffs from the last commit and the specific error get passed into a triage agent built on Deep Agents.
First, the triage agent classifies every changed file as runtime, prompt/config, test, docs, or CI. If a deploy only touches non-runtime files, it's extremely unlikely the deployment caused the error. This prevents false positives where the agent might hallucinate a causal chain from a test file to a production bug.
For runtime changes, the agent must establish a concrete causal link between a specific line in the diff and the observed error.
The agent returns a structured verdict with its decision, confidence, reasoning, and the error signatures it attributes to the change. This narrowing means Open SWE receives a focused investigation prompt rather than a dump of every error that spiked.
Closing the Loop with Open SWE
Once the triage agent green-lights an investigation, Open SWE takes over, works through the bug, and opens a PR. I get notified when it's ready for review, so the entire flow from error detection to proposed fix happens without any manual intervention.
So far, it's been most useful for catching bugs that don't crash loudly: silent failures that return wrong defaults, configuration mismatches between code and deployment, and cascading regressions where fixing one bug unmasks the next on the subsequent deploy.
Future Improvements
Wider Lookback Window
The triage agent currently looks at the diff between the current and previous deployed revision. Bugs introduced in earlier deployments that only surface later won't get auto-attributed. Widening the look back is the obvious fix, but the more diffs you feed into triage, the noisier the signal gets and the harder it is to pinpoint a causal link. I haven't landed on the right balance yet.
Smarter Error Grouping
The current approach uses fuzzy matching by sanitizing IDs and timestamps from error messages. It took some time to get right, and there are probably still cases where related errors don't get grouped together due to limitations in the sanitization logic.
One idea I've been considering is embedding error messages into a vector space and clustering them, rather than relying on regex normalization. Errors that mean the same thing would naturally land near each other regardless of surface-level differences, and we could detect regressions by monitoring for new clusters forming or existing clusters growing after a deploy. The challenge is tuning distance thresholds for what constitutes a meaningful cluster shift versus normal variance.
Another option is using a smaller, cheaper model to classify and group errors, then pass those structured clusters directly to Open SWE as part of the investigation prompt — giving it a much richer picture of what's failing and how the full error looks
Ramp took an interesting approach to make their Sheets product self-maintaining. On every PR merge, an LLM reads the diff and generates monitors tailored to the changed code, each with explicit thresholds for error rate spikes, latency regressions, etc. When a monitor fires, a webhook delivers the alert context directly to an agent for triage. Defining a targeted monitor upfront produces a much clearer signal, making it easier for a downstream agent to diagnose the issue.
Fix-Forward vs Looking Back
Right now the system always fixes forward, Open SWE works on a PR while the broken deployment stays live. A smarter approach would be deciding between the two based on severity, error rate, and triage confidence. A high-severity spike with a low-confidence causal chain might warrant an immediate rollback, while a well-attributed bug with a clear fix path is better handled by pushing a patch forward.
Conclusion
I think this pattern will become more prevalent in deployment offerings. The more your system can detect, triage, and fix its own regressions, the faster you can ship and the less time engineers spend watching dashboards instead of building.
関連記事
Helidon 4.4.0がOpenJDKリリースサイクルへの準拠とJava Verified Portfolioによるサポートを導入
Oracleがマイクロサービスフレームワーク「Helidon」のバージョン4.4.0をリリースした。新バージョンはOpenJDKのリリースサイクルに準拠し、Java Verified Portfolioによるサポート、新たなコア機能、LangChain4j向けのエージェントAIサポートを特徴とする。
オープンモデルが閾値を超えた
LangChain社が評価したところ、GLM-5やMiniMax M2.7などのオープンウェイト大規模言語モデルは、ファイル操作やツール使用などのコアエージェントタスクにおいて、従来のクローズドモデルと同等の性能を、低コスト・低遅延で達成している。
本番環境におけるディープエージェントのランタイム基盤
長期動作するエージェントの本番デプロイには専用インフラが必要である。本ガイドは、耐久性のある実行、メモリ管理、人間による監督(HITL)、観測可能性について解説し、「deepagents」がこれらを本番環境に展開する方法を示す。