実用的な洞察のためのセキュリティ概要ダッシュボードの構築
Cloudflareは、セキュリティチームが膨大なデータから「今すぐ対処すべきこと」を優先的に特定できるようにする、行動可能なインサイトに焦点を当てた新しい「Security Overview」ダッシュボードを発表した。
キーポイント
「可視性」から「行動可能なインサイト」への転換
従来の「何が起きているかを見せる」ダッシュボードから、「今すぐ何を修正すべきか」を明確に示す設計へとパラダイムシフトを図っている。
「Security Action Items」による優先順位付け
脆弱性を自動的に発見・提示する機能を導入し、重大度(Critical/Moderate/Low)でランク付けすることで、効果的なトリアージを可能にする。
「設定ギャップ」の解消
セキュリティツールが有効化・適切に設定されているかを一覧表示する「Detection Tools」モジュールにより、ツールの未使用や誤設定という盲点を解消する。
単一インターフェースによる効率化
複数のツール間を行き来する必要性を減らし、リアクティブな監視からプロアクティブな制御への移行を支援することを目的としている。
セキュリティダッシュボードの統合可視性
Suspicious ActivityカードをSecurity OverviewとSecurity Analyticsの2箇所に配置し、カードをクリックすると関連フィルターが自動適用された状態でAnalyticsダッシュボードに直接遷移することで、インシデント対応のワークフローを効率化している。
マイクロサービスアーキテクチャによるスケーラブルなシステム
チェッカーと呼ばれる専門的なマイクロサービスを採用し、DNSレコードなどの特定のスタック部分を担当させることで、スケジュールされた設定チェックとリアルタイムリスナーの2つの方法でシステムに統合し、独立したスケーリングを可能にしている。
リアルタイムイベントハンドラーの仕組み
イベントハンドラーはリアルタイムで動作し、コントロールプレーンからのシグナルやイベントを監視し、異常を検出するとインサイトを登録する。
影響分析・編集コメントを表示
影響分析
この発表は、セキュリティ運用(SecOps)の実務における長年の課題である「アラート疲労」と「データ過多」への具体的な解決策を示している。単なる監視ツールの追加ではなく、意思決定と行動を支援する「オペレーショナルインテリジェンス」の提供へと焦点を移すことで、セキュリティチームの生産性と効果を高める可能性がある。特に、ツールの設定状態を可視化するアプローチは、多くの組織が直面する実践的な問題に対処している。
編集コメント
AI技術そのものの進展ではなく、AIを含む現代のテクノロジー環境が生み出す膨大なデータを、人間が効果的に処理・活用するための「インターフェースと優先順位付け」という根本的な課題に取り組む製品発表。実務家の悩みに直結する実用的なアップデートと言える。
長年にわたり、業界の脅威への答えは「より多くの可視性」でした。しかし、文脈のないより多くの可視性は、単なるノイズの増加に過ぎません。現代のセキュリティチームにとって、最大の課題はもはやデータの不足ではなく、圧倒的なデータの過剰です。ほとんどのセキュリティ専門家は、複数のダッシュボードを渡り歩き、ばらばらなログを探し回って、一見単純な「さて、何をすべきか?」という問いに答えることから一日を始めます。
単一の設定ミスを特定するためだけに異なるツール間で切り替えを強いられると、インシデントを防ぐ機会を逃してしまいます。だからこそ、私たちは刷新されたセキュリティ概要ダッシュボードを構築しました:これは、リアクティブな監視からプロアクティブな制御へと移行することで、防御者を強化するように設計された単一のインターフェースです。
 image
image
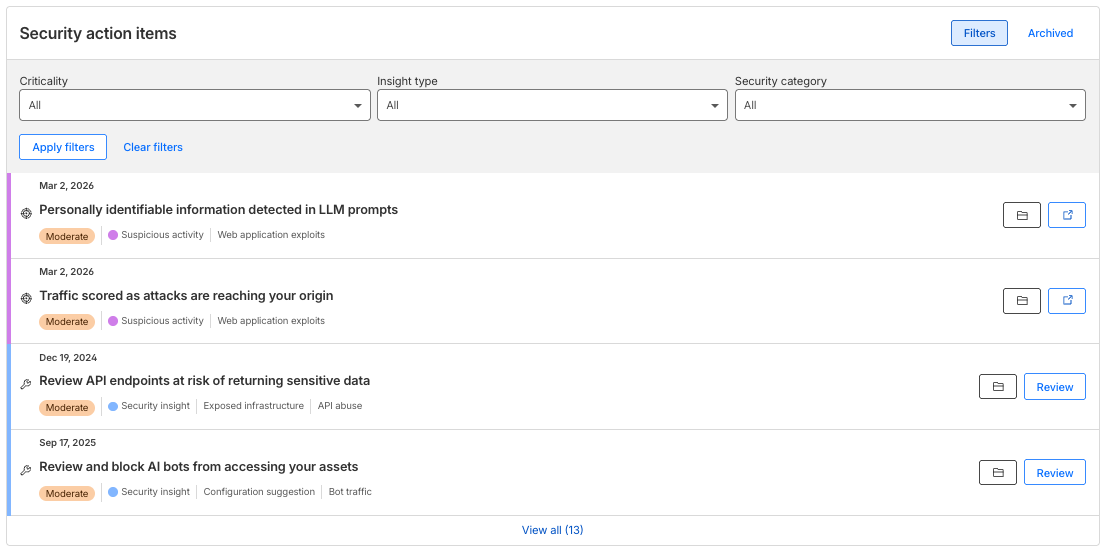
新しいセキュリティ概要ダッシュボード。
ノイズからアクションへ:セキュリティ概要の再考
歴史的に、ダッシュボードは起こっていることすべてを表示することに焦点を当ててきました。しかし、多忙なセキュリティアナリストにとって、より重要な質問は「今すぐ修正すべきことは何か?」です。
これを解決するために、私たちはセキュリティアクション項目を導入しています。この機能は、検出と調査の間の機能的な橋渡しとして機能し、脆弱性を表面化させるので、もうそれらを探し回る必要はありません。効果的にトリアージできるように、項目は重大度によってランク付けされています:
重大:悪用を防ぐために即時の対応が必要な緊急のリスク。
中程度:強固なセキュリティ態勢を維持するために対処すべき問題。
低:ベストプラクティスの最適化と強化の提案。
インサイトタイプ(疑わしいアクティビティや安全でない設定など)でフィルタリングすることで、組織が最も直面する特定の脅威にワークフローを合わせることができます。
 image
image
侵害の最も一般的な原因の一つは、セキュリティツールの不在ではなく、ツールが一度もオンにされなかったか、誤って設定されていたという事実です。私たちはこれを設定ギャップと呼びます。
新しい検出ツールモジュールは、この盲点を排除します。ネストされた設定ページを掘り下げてトラフィックが実際に検査されているかどうかを確認する代わりに、Cloudflareセキュリティスタック全体のハイレベルなステータスを一つのビューで提供します:
主要なシールドはアクティブですか、それとも変動性の高い期間に「ログのみ」モードになっていますか?
シャドウAPIを発見していますか、それとも手探り状態ですか?
これらのツールをセキュリティアクション項目と直接並べて表面化させることで、会話を「このツールは持っていますか?」から「このツールは今、積極的に私たちを守っていますか?」へと移行させます。
 image
image
ハイレベルな要約は、それを支えるデータと同じくらい良いものです。赤旗から解決策への移行をシームレスにするために、私たちは疑わしいアクティビティカードの可視性を統一しました。これらのカードは現在、2つの戦略的な場所、すなわちセキュリティ概要ページとセキュリティアナリティクスページに存在します。
概要ページで興味を引く疑わしいアクティビティカードを見つけた場合、手動でアナリティクスに移動してフィルターを再作成する必要はありません。カードをクリックすると、関連するすべてのフィルターが自動的に適用された状態で、セキュリティアナリティクスダッシュボードに直接ディープリンクされます。これにより、インシデント対応を遅らせる「タブ切り替えコスト」が排除され、ワークフローが流動的になり、応答時間が速くなります。
新しいセキュリティ概要ダッシュボードの構築方法
プロアクティブな防御を維持するために、私たちのエンジンは毎日1000万以上の実用的な洞察を生成・更新し、保護が常に最新であることを保証します。
このレベルで運用することは、2つの明確なエンジニアリング上の課題を提示します。1つ目はスケール:膨大な量のデータをシームレスに処理することです。2つ目は、おそらくより難しい課題である、広がりです。真のセキュリティは水平方向であり、スタック全体に広がっています。リスクと脆弱性の包括的なビューを提供する実用的な洞察を生成するために、私たちのエンジンは単純なSSL証明書から複雑なAIボット設定まで、すべてを検証する必要があります。
これを解決するために、私たちはより小さな専門的なマイクロサービスで構成されるシステムを構築しました。これをチェッカーと呼びます。各チェッカーは、DNSレコードなど、スタックの特定の部分の専門家です。チェッカーの分散により、それらは独立してスケールし、2つの方法でシステムに接続されます:スケジュールされた設定チェック、またはイベント発生時に即座にリスクをフラグ立てするリアルタイムリスナーです。
- スケジュールチェック:深い検査が必要なリスクに対して、このモードを展開します。これらはオーケストレーター(スケジューラー)によってトリガーされ、定期的にチェッカーが実行するタスクをプッシュします。私たちはチェッカーのワークロードを大規模並列システムに分散させます。例えば、DNSチェッカーに送信されるタスクは、「ゾーンxyz.comのDNS関連設定をすべてスキャンして異常を見つける」といったものかもしれません。
チェッカーはこれらのタスクを独立して受け取ります。彼らは専門的な知能を使用して、資産と設定をスキャンします。DNSチェッカーの場合、専門的で知的なルールを使用して、ゾーンのすべてのDNS資産と設定、つまりA/AAAA/CNAMEレコードやDMARC、SPFレコードなどをスキャンします。
これがインサイトライフサイクルの様子です:
メッセージを受信するとチェッカーが起動します。
チェッカーはゾーンまたはアカウントに関する関連資産(例:DNSレコード)を収集します。
チェッカーは資産のステータスを確認するためにいくつかのチェックを実行します。例:CNAMEレコードがサーバーを指しているかどうか。
状態または設定が必要な閾値を満たしていない場合、インサイトがフラグ立てされます。
次のチェック中にインサイトが持続する場合、タイムスタンプが更新されます。
次のチェック中にインサイトが修正された場合、データベースから削除されます。
 image
image
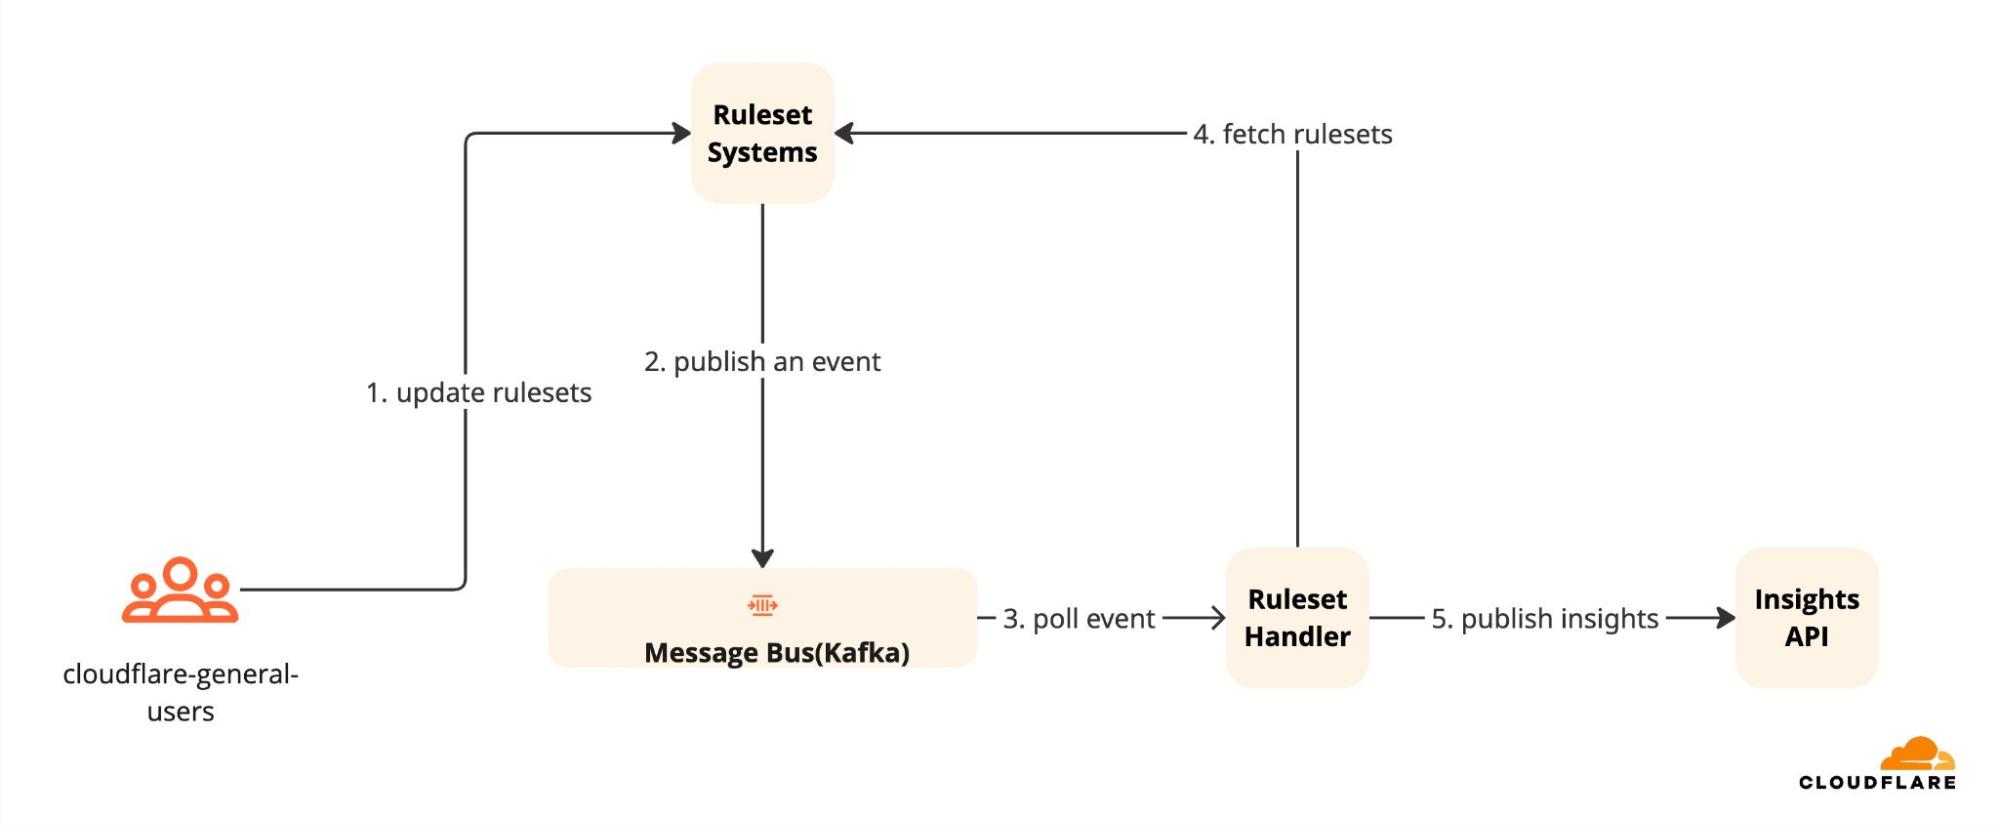
- イベントハンドラー:チェッカーは24時間体制でスケジュールに従って動作しますが、イベントハンドラーはリアルタイムで機能します。彼らはコントロールプレーンからの信号とイベントをリッスンします。
 image
image
これがリアルタイムルールセットインサイトライフサイクルの様子です:
WAFルール設定が変更されます。
変更の詳細を含むイベントが即座にトリガーされます。
積極的にリッスンしているルールセットハンドラーが動作を開始します。
ハンドラーは異常を検出します。例:Cloudflare Managed Rulesetを有効にしたが、「ログのみ」モードのままにしている。
ハンドラーは、攻撃が記録されているがブロックされていないと推論します。
ハンドラーはインサイトを登録し、ダッシュボードで利用可能にします。
設定が安全な設定に更新された場合、ハンドラーはインサイトをクリアします。
ルールセットハンドラーのリアルタイム性により、設定ミスを即座にフラグ立てしたり、修正を確認したりすることができます。
文脈のある洞察によるセキュリティ可視性の統一
私たちの顧客は、可視性だけでなく、文脈を一貫して求めてきました。レコードが誤って設定されているという通知は役に立ちますが、それは物語の半分に過ぎません。即座に確信を持って行動するために、防御者はビジネスへの影響や技術的根本原因を含む「それでどうなるの?」を知る必要があります。これに対処するために、私たちは検出エンジンに文脈的洞察を開発しました。壊れたAレコードへのトラフィック量などのデータを表面化させることで、すべての洞察が行動への招待状となることを保証します。
私たちは、DNSインサイトの深さを拡張することで、この文脈的洞察の旅を始めています。単に壊れたレコードをフラグ立てするだけでなく、宙ぶらりんの信号を追加の文脈とリアルタイムトラフィックデータと相関させて、「なぜ」と「どのように」を提供します:
ターゲット文脈:レコードが指す削除されたリソース(例:古いS3バケットやクラウドインスタンス)を正確に特定します。
影響文脈:その壊れたレコードにまだアクセスしようとしているユーザーの正確な数を示します。
例として、「宙ぶらりんのA/AAAA/CNAMEレコード」の洞察を探ってみましょう。
これらの洞察を提供するために、私たちは毎秒ネットワークを流れる膨大な量のデータを分析する必要があります。舞台裏で行われている作業の規模を示すために:
1億以上のDNSレコードが毎週私たちのエンジンによってスキャンされます。先週、私たちのエンジンは100万以上の宙ぶらりんDNSレコードを特定しました。大部分(97%)は宙ぶらりんのA/AAAAレコードで、残りの3%は宙ぶらりんのCNAMEレコードです。
31,000の宙ぶらりんCNAMEレコードのうち:
95%はMicrosoft Azureサービスを指しています。
3%はAWS Elastic Beanstalkを指しています。
これは、これらがサブドメイン乗っ取りの高優先度ターゲットであることを示しています。攻撃者はこれらの放棄されたクラウドリソースを要求し、即座にサブドメインを制御して、信頼できるブランドの下でフィッシング攻撃を開始したり、誤った情報を拡散したりすることができます。数千のヒットがある宙ぶらりんレコードは、サブドメイン乗っ取りの高優先度リスクを提示し、脅威を即座に評価して軽減するために即時の修復が必要です。
私たちのDNSチェッカーは、これらの洞察を生成するために2段階のプロセスを使用します。
ステップ1:アクティブインサイト検出
チェッカーは、スキャンを開始するメッセージを受け取るとすぐに検証を開始します。このプロセスは前のセクションで説明されています。
ステップ2:文脈的強化
インサイトが生成されると、チェッカーは顧客がセキュリティインサイトの影響を理解するのに役立つ、インサイトに関連する文脈データを収集します。
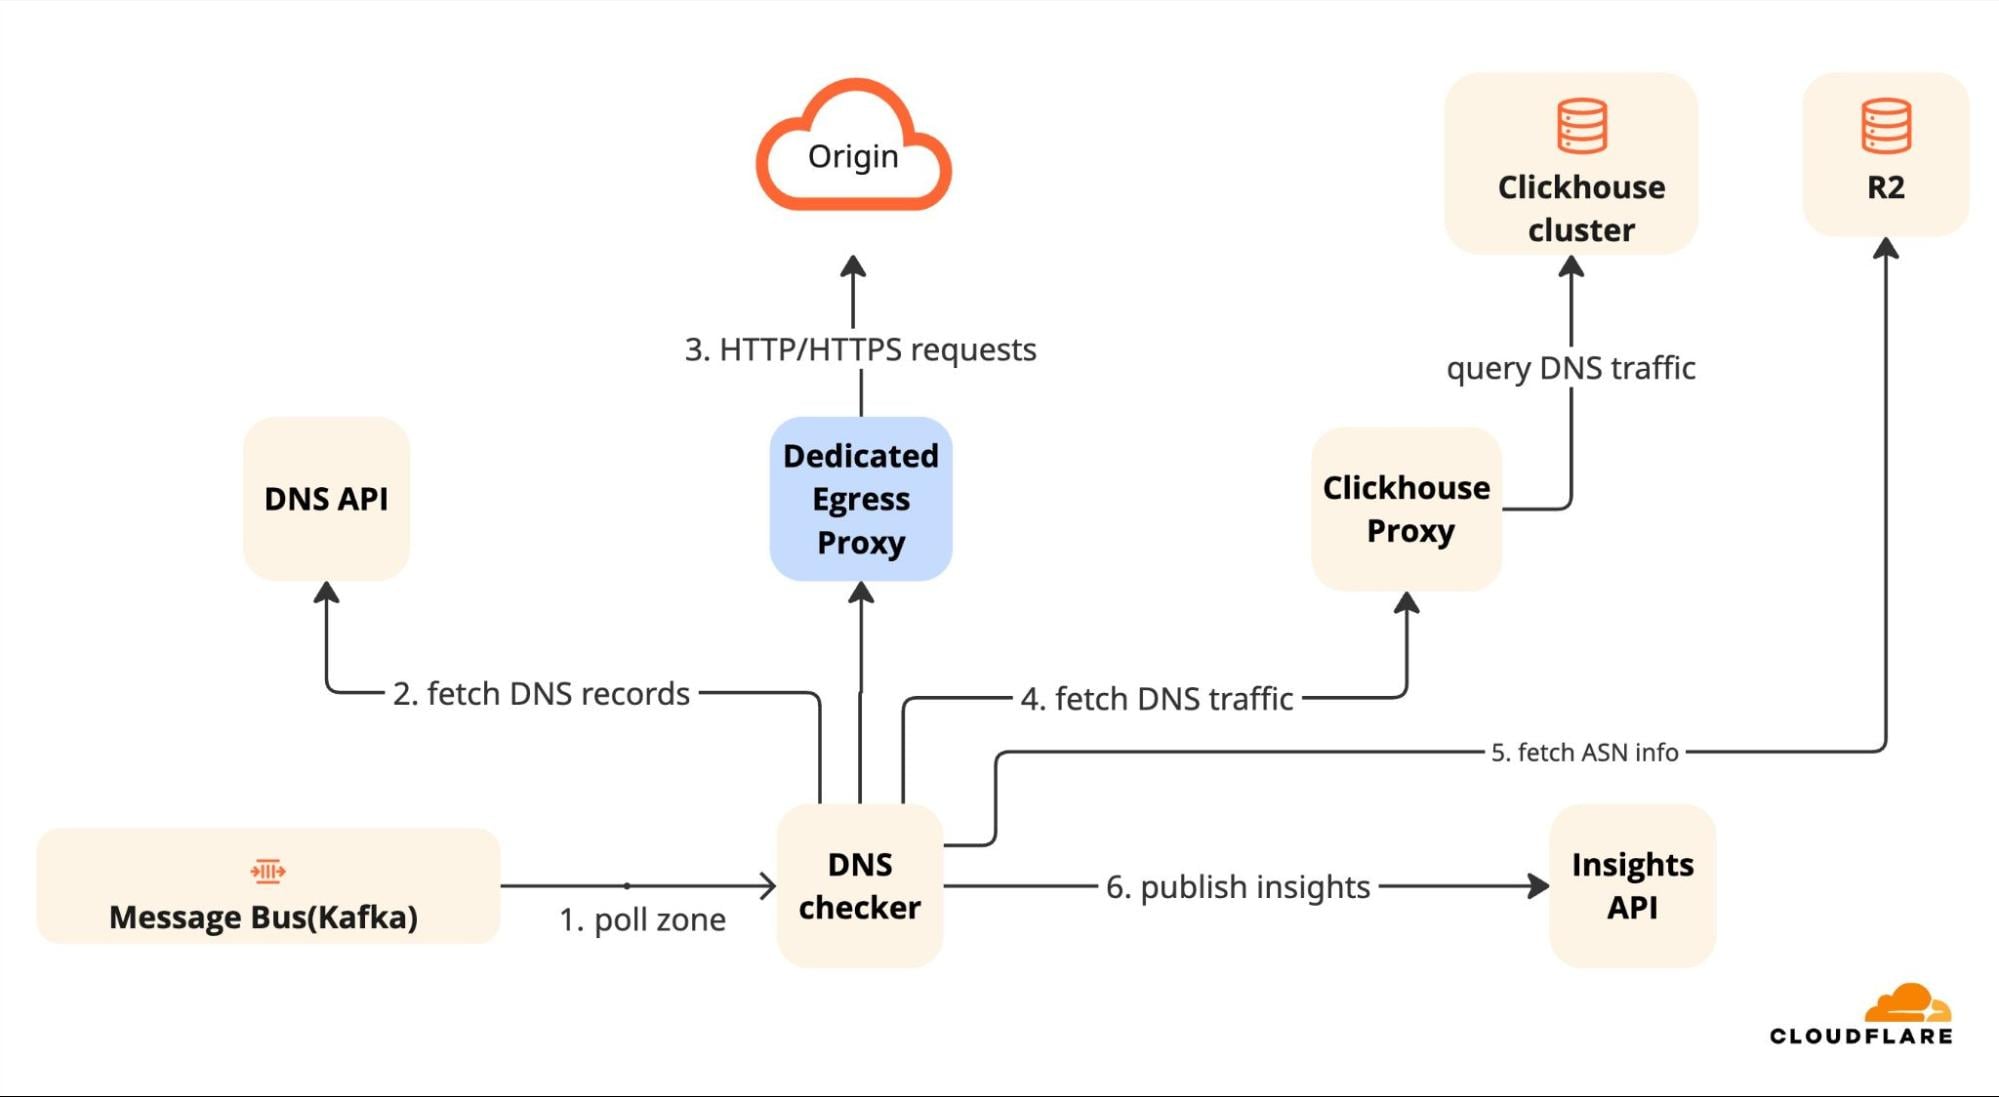
ダングリングDNSレコードの洞察がどのように生成されるか、関与する2段階のプロセスに焦点を当てて深く探ってみましょう。
 image
image
第1段階: アクティブ検証
DNSレコードがIPアドレスを指している場合、その背後にあるサーバーが何ヶ月も前に廃止されていても、書面上は完全に有効に見えることがよくあります。リスクが現実のものかどうかを確認するため、私たちのエンジンはネットワークの外に出て、リアルタイムで宛先を調査する必要があります。実行されるチェックは以下のように分類できます。
デッドサーバーチェック (A/AAAAレコード): IPアドレスを直接指しているレコードについては、宛先がまだアクティブかどうかを確認します。私たちのエンジンは専用のエグレスプロキシを起動し、HTTPおよびHTTPS経由でオリジンへの接続を試みます。この特別なゲートウェイを使用することで、実際のユーザーがCloudflareのネットワーク外からどのように接続するかをシミュレートします。接続がタイムアウトするか、サーバーが「404 Not Found」エラーを返した場合、そのリソースがデッドであることを確認します。これはDNSレコードが「ダングリング」、つまり空き地を指す生きた標識であることを証明します。
テイクオーバーチェック (CNAMEレコード): ドメインエイリアス (CNAME) は、ヘルプデスクやストレージバケットなどのサードパーティサービスにトラフィックを委譲することがよくあります。そのサービスをキャンセルしてもDNSレコードを削除し忘れると、攻撃者が取得できる「ダングリング」リンクを作成してしまいます。
これらを見つけるために、私たちのエンジンは3段階のプロセスを実行します。
まず、CNAMEレコードを再帰的に解決して最終的な宛先 (例: my-bucket.s3.amazonaws.com) を見つけるために、チェーンをトレースします。
次に、その宛先がAWS、Azure、Shopifyなどの既知のクラウドサービスに属しているかどうかをチェックしてプロバイダーを特定します。
最後に、空き状況を確認します。各クラウドプロバイダーは、リソースが存在しない場合に特定のエラーパターン (例: S3の「NoSuchBucket」) を返します。宛先URLを調査し、これらのパターンと照合して、リソースが取得可能かどうかを確認します。
私たちのエンジンがリソースが解放されたがDNSレコードが残っていることを検出した場合、攻撃者があなたのサブドメインを引き継ぐ前にレコードを削除するよう促す洞察を作成します。
第2段階: コンテキストエンリッチメント
レコードが壊れていると確認されたら、より良い行動を取るのに役立つ必要なコンテキストを洞察に追加します。チェッカーは必要なコンテキストを収集するために異なるシステムに接続します。ダングリングの洞察については、3つの重要な側面に焦点を当てます。
トラフィック量 (影響) 私たちのグローバルClickHouseクラスターは情報の宝庫です。レコードが実際に使用されているかどうかを理解するために、チェッカーはグローバルClickHouseクラスターにクエリを実行し、過去7日間のそのレコードに対する合計DNSクエリを合計します。この貴重なコンテキストにより、修復の優先順位を決めることができます。クエリ数が0のレコードは時間があるときに修正できますが、10,000クエリのレコードは直ちにパッチを当てる必要があるアクティブな脆弱性です。
ClickHouseへのクエリは次のようになります。
SELECT query_name,
sum(_sample_interval) as total
FROM <dnslogs_table_name>
WHERE account_id = {{account_id}}
AND zone_id = {{zone_id}}
AND timestamp >= subtractDays(today(), 7)
AND timestamp < today()
AND query_name in ('{{record1}}', '{{record2}}', ...)
GROUP BY query_name
このクエリは、「過去7日間で、この特定の壊れたレコードが実際のユーザーから何回リクエストされたか?」と尋ねています。
インフラストラクチャ所有者 (ターゲット) 宛先インフラストラクチャの所有者を知ることは、修復と重大度評価の両方にとって極めて重要です。
IPレコード (A/AAAA) の場合: Cloudflare R2バケットからの最新のジオロケーションデータを使用し、メモリ内で高速ルックアップを実行して、ネットワーク所有者 (ASN) を特定します。これにより、デッドリソースがどこに存在していたか (例: 「Google Cloud」対「DigitalOcean」) が正確にわかり、調査が迅速化します。
CNAMEレコードの場合: 特定のホスティングプロバイダー (例: AWS S3、Shopify) を特定します。これがリスクレベルを決定します。レコードが (S3のような) テイクオーバーが容易なことで知られるプロバイダーを指している場合、それを「クリティカル」とマークします。そうでなければ「モデレート」です。
DNS TTL レコード設定から直接TTL (Time To Live) 値を抽出します。
これは修正の「ラグタイム」を示します。高いTTL (例: 24時間) を持つダングリングレコードを削除すると、世界中のリゾルバーに丸1日キャッシュされ続けるため、パッチを当てた後も脆弱性が開いたままになります。これを知ることで、インシデント対応中の期待値を管理するのに役立ちます。
今後の展望
このエクスペリエンスは現在ドメインレベルでローンチされていますが、エンタープライズ顧客にとってセキュリティは一度に1つのドメインだけで管理されるものではないことを私たちは理解しています。私たちのロードマップは、次にこのインテリジェンスをアカウントレベルに導入することに焦点を当てています。まもなく、セキュリティチームは、セキュリティアクションアイテムを集約し、すべてのCloudflareドメインにわたって最も重要なリスクを修復する優先順位を付ける一元化されたビューを使用できるようになります。
セキュリティは追いかけっこのゲームのように感じるべきではありません。あまりにも長い間、アプリケーションセキュリティ管理の複雑さが攻撃者に有利に働いてきました。専門的なチェッカーとリアルタイムイベントハンドラーのアーキテクチャを通じて、私たちは潜在的なリスクを検出し、重要なコンテキストでそれらを充実させ、防御者が迅速かつ正確に対応できるようにします。
新しいセキュリティ概要は、リスクデータが優先順位付けされた戦略に変換される場所、あなたの一日の出発点となりました。今日、Cloudflareダッシュボードにログインして、新しいアプリケーションセキュリティ概要ページを探索してください!
原文を表示
For years, the industry’s answer to threats was “more visibility.” But more visibility without context is just more noise. For the modern security team, the biggest challenge is no longer a lack of data; it is the overwhelming surplus of it. Most security professionals start their day navigating a sea of dashboards, hunting through disparate logs to answer a single, deceptively simple question: "What now?"
When you are forced to pivot between different tools just to identify a single misconfiguration, you’re losing the window of opportunity to prevent an incident. That’s why we built a revamped Security Overview dashboard: a single interface designed to empower defenders, by moving from reactive monitoring to proactive control.
image
The new Security Overview dashboard.
From noise to action: rethinking the security overview
Historically, dashboards focused on showing you everything that was happening. But for a busy security analyst, the more important question is, "What do I need to fix right now?"
To solve this, we are introducing Security Action Items. This feature acts as a functional bridge between detection and investigation, surfacing vulnerabilities, so you no longer have to hunt for them. To help you triage effectively, items are ranked by criticality:
Critical: Urgent risks requiring immediate attention to prevent exploitation.
Moderate: Issues that should be addressed to maintain a strong security posture.
Low: Best-practice optimizations and hardening suggestions.
By filtering by Insight Type (such as Suspicious Activity or Insecure Configuration), you can tailor your workflow to the specific threats your organization faces most.
image
One of the most common causes of a breach isn't the absence of a security tool, it’s the fact that the tool was never turned on or was configured incorrectly. We call this the configuration gap.
The new Detection Tools module eliminates this blind spot. Instead of digging through nested settings pages to see if your traffic is actually being inspected, we provide a high-level status of your entire Cloudflare security stack in one view:
Are your primary shields active, or are you in "Log Only" mode during a period of increased volatility?
Are you discovering shadow APIs, or are you flying blind?
By surfacing these tools directly alongside your Security Action Items, we move the conversation from "Do we have this tool?" to "Is this tool actively protecting us right now?"
image
A high-level summary is only as good as the data behind it. To make the transition from a red flag to a solution seamless, we have unified the visibility of our Suspicious Activity cards. These cards now live in two strategic places: the Security Overview and the Security Analytics page.
If you spot a Suspicious Activity card on your Overview page that piques your interest, there is no need to manually navigate to Analytics and re-create your filters. By clicking on the card, you are deep-linked directly into the Security Analytics dashboard with all the relevant filters automatically applied. This eliminates the "tab switching tax" that slows down incident response, keeping your workflow fluid and your response times fast.
How we built our new security overview dashboard
To maintain a proactive defense, our engine produces and refreshes over 10 million actionable insights every day to ensure protection is always current.
Operating at this level presents two distinct engineering challenges. The first is scale: processing massive volumes of data seamlessly. The second and arguably harder challenge, is breadth. True security is horizontal, spanning your entire stack. To generate actionable insights that give you a comprehensive view of your risks and vulnerabilities, our engine must validate everything from simple SSL certificates to complex AI bot configurations.
To solve this, we built a system composed of smaller, specialized micro services, which we call checkers. Each checker is a subject-matter expert for a specific part of your stack, such as DNS records. The distribution of our checkers allows them to scale independently, hooked into the system in two ways: scheduled configuration checks or real-time listeners that flag a risk the instant an event occurs.
- Scheduled checks: We deploy this mode for risks that need deep inspection. These are triggered by an orchestrator (scheduler), which periodically pushes tasks for the checkers to execute. We distribute the checker workload across a massively parallel system. For example, a task sent to the DNS checker might be: "Scan all the DNS related configurations of zone xyz.com and find anomalies."
The checkers pick up these tasks independently. They use their specialized intelligence to scan through the assets and configurations. In the case of the DNS checker, it uses specialized and intelligent rules to scan all the DNS assets and configurations of a zone, be it A/AAAA/CNAME records or DMARC or SPF records.
This is what the insight lifecycle looks like:
The checker activates when a message is received.
The checker collects relevant assets (e.g., DNS records) about the zone or account.
The checker runs several checks to verify the status of the asset, e.g., if a CNAME record points to a server.
If the state or configuration doesn’t meet the required threshold, an insight is flagged.
During the next check, if the insight persists, the timestamp is updated.
If the insight has been remedied during the next check, it will be removed from the database.
image
- Event handlers: The checkers operate on a schedule round the clock, whereas the event handlers function in real-time. They listen to signals and events from our control plane.
image
This is what the real-time ruleset insight lifecycle looks like:
A WAF rule configuration is modified.
An event containing details of the change is triggered immediately.
The ruleset handler, which is actively listening, kicks into action.
The handler detects an anomaly, e.g, you have enabled the Cloudflare Managed Ruleset but left it in "Log Only" mode.
The handler deduces that the attacks are being recorded but not blocked.
The handler registers an insight and makes it available on the dashboard.
If the configuration has been updated to a secure setting, the handler clears the insight.
The real-time nature of Ruleset handlers allow us to flag a misconfiguration or confirm a fix instantly.
Unifying security visibility with contextual insights
Our customers have consistently asked for more than just visibility: they’ve asked for context. While a notification that a record is misconfigured is helpful, it’s only half the story. To take immediate, confident action, defenders need to know the "so what?" including the business impact and the technical root cause. To address this, we have developed Contextual Insights for our detection engine. By surfacing data like traffic volume to a broken A record, we ensure that every insight is an invitation to act.
We are starting this journey of Contextual Insights by expanding the depth of our DNS insights. Instead of just flagging a broken record, we correlate the dangling signal with additional context and real-time traffic data to provide the “why” and the “how”:
Target Context: We identify exactly which deleted resource (e.g., an old S3 bucket or cloud instance) the record points to.
Impact Context: We show you exactly how many users are still trying to reach that broken record.
Let’s explore the ‘Dangling A/AAAA/CNAME record’ insights as an example.
To provide these insights, we must analyze the massive amount of data flowing through our network every second. To give you an idea of the work happening behind the scenes:
100+ million DNS records are scanned weekly by our engine. In the past week, our engine identified over 1 million dangling DNS records. The majority (97%) are Dangling A/AAAA records and the remaining 3% are Dangling CNAME records.
Of the 31,000 dangling CNAME records:
95% point to Microsoft Azure services.
3% point to AWS Elastic Beanstalk.
This signals that these are high-priority targets for a subdomain takeover. An attacker can claim these abandoned cloud resources and immediately control your subdomain, allowing them to launch phishing attacks or spread misinformation under your trusted brand. With thousands of hits, a dangling record presents a high-priority risk for a subdomain takeover, necessitating immediate remediation to instantly gauge and mitigate the threat.
Our DNS checker uses a two-step process to generate these insights
Step 1: Active Insight detection
The checker starts verification as soon as it gets the message to start a scan. This process has been described in an earlier section.
Step 2: Contextual enrichment
Once the insight is generated, the checkers gather relevant contextual data for the insight that helps the customer in understanding the impact of the security insight.
Let’s explore in depth how the dangling DNS record insights are generated, focusing on the two-phase process involved.
image
Phase 1: Active Verification
A DNS record pointing to an IP address often looks perfectly valid on paper, even if the server behind it was decommissioned months ago. To confirm if a risk is real, our engine has to step outside the network and probe the destination in real-time. The checks performed can be categorized as follows:
The dead server check (A/AAAA records): For records pointing directly to IP addresses, we verify if the destination is still active. Our engine spins up a dedicated egress proxy to attempt a connection to the origin over HTTP and HTTPS. By using this special gateway, we simulate how a real user would connect from outside Cloudflare’s network. If the connection times out or the server returns a "404 Not Found" error, we confirm the resource is dead. This proves the DNS record is "dangling", a live signpost pointing to an empty lot.
The takeover check (CNAME records): Domain aliases (CNAMEs) often delegate traffic to third-party services, like a helpdesk or storage bucket. If you cancel that service but forget to delete the DNS record, you create a "dangling" link that attackers can claim.
To find these, our engine performs a 3-step process:
First, we trace the chain by recursively resolving the CNAME record to find its final destination (e.g., my-bucket.s3.amazonaws.com).
Next, we identify the provider by checking if that destination belongs to a known cloud service like AWS, Azure, or Shopify.
Finally, we confirm vacancy. Each cloud provider returns specific error patterns when a resource doesn't exist (e.g., S3's "NoSuchBucket"). We probe the destination URL and match against these patterns to confirm if the resource is claimable.
If our engine detects that a resource has been released but the DNS record remains, we create an insight, prompting you to remove the record before an attacker can take over your subdomain.
Phase 2: Context Enrichment
Once a record is verified as broken, we add the necessary context to the insight that helps you take better action. The checker connects to different systems to gather the required context. For dangling insights, we focus on three critical dimensions:
Traffic Volume (The Impact) Our global ClickHouse clusters are a treasure trove of information. To understand if the record is actually in use, the checker queries our global ClickHouse clusters to sum up the total DNS queries for that record over the last 7 days. This valuable context lets you prioritize the remedy. A record with 0 queries can be fixed when you have time; a record with 10,000 queries is an active vulnerability that needs to be patched immediately.
Query to the clickhouse looks like:
SELECT query_name,
sum(_sample_interval) as total
FROM <dnslogs_table_name>
WHERE account_id = {{account_id}}
AND zone_id = {{zone_id}}
AND timestamp >= subtractDays(today(), 7)
AND timestamp < today()
AND query_name in ('{{record1}}', '{{record2}}', ...)
GROUP BY query_name
The query asks “How many times has this specific broken record been requested by real users in the last seven days?”
Infrastructure owner (The Target) Knowing who owns the destination infrastructure is vital for both remediation and severity assessment.
For IP records (A/AAAA): We identify the network owner (ASN) through the latest geolocation data from a Cloudflare R2 bucket and performing high-speed lookups in memory. It tells you exactly where the dead resource lived (e.g., "Google Cloud" vs. "DigitalOcean"), speeding up your investigation.
For CNAME Records: We identify the specific Hosting Provider (e.g., AWS S3, Shopify). This dictates the risk level. If a record points to a provider known for easy takeovers (like S3), we mark it as Critical; otherwise, it is Moderate.
DNS TTL We also extract the TTL (Time To Live) value directly from the record configuration.
This tells you the "lag time" of your fix. If you delete a dangling record with a high TTL (e.g., 24 hours), it will remain cached in resolvers around the world for a full day, meaning the vulnerability stays open even after you patch it. Knowing this helps you manage expectations during an incident response.
Looking forward
While this experience is launching at the domain level today, we know that for enterprise customers, security isn't managed just one domain at a time. Our roadmap is focused on bringing this intelligence to the account level next. Soon, security teams can use a centralized view that aggregates security action items and prioritizes the most critical risks to remediate across all of their Cloudflare domains.
Security shouldn't feel like a game of catch-up. For too long, the complexity of managing application security has given the advantage to the attacker. Through our architecture of specialized checkers and real-time event handlers, we detect potential risks and enrich them with critical context, ensuring defenders can respond with speed and precision.
The new Security Overview is now the starting point for your day, a place where risk data is transformed into a prioritized strategy. Log in to the Cloudflare dashboard today to explore your new Application Security Overview page!
関連記事
今日のまとめ
AI日報で今日の重要ニュースをまとめ読み