Amazon Bedrock AgentCore Observability、生産環境の AI エージェント最適化を支援
本文の状態
日本語全文を表示中
詳細モードで約19分の本文を読めます。
同じ出来事の情報源
この情報源を基点に整理
AWS Machine Learning Blog
AWS は Amazon Bedrock AgentCore の新機能である観測機能を公開し、プロダクション環境で動作する AI エージェントの性能ボトルネックやメモリ増大問題を特定・診断する手法を提示した。
AI深層分析を開く2026年8月1日 01:23
AI深層分析
キーポイント
プロダクション環境での性能課題の明確化
エラーが発生しないが応答が遅い、またはメモリが増大し続けるという、ユーザー体験とコストに悪影響を与える隠れた問題を指摘している。
AgentCore Observability と CloudWatch の連携活用
Amazon Bedrock AgentCore の観測機能と Amazon CloudWatch を組み合わせることで、エージェントの実行パス全体におけるボトルネックを特定する手法を解説している。
パフォーマンス予算の設定と監視の重要性
バッチ処理とチャットボットなど用途によって許容される応答時間が異なるため、具体的なユースケースに応じたパフォーマンス予算を設定し、それを遵守する必要があると述べている。
劣化の早期検知に向けたモニタリング実装
ユーザーが不満を持つ前に性能劣化を検知するための監視プラクティスを実装する方法を提示しており、P95 レスポンス時間の閾値超過などの兆候を注視するよう推奨している。
パフォーマンス劣化の兆候と特定
エラー率が低くても応答時間が徐々に増加する現象は、アーキテクチャの最適化が必要なシステミックなボトルネックを示唆している。
重要な引用
Slow response times and unbounded memory growth are the most common operational issues that surface after you resolve the initial debugging problems.
You must establish performance budgets for your specific use case, then systematically identify which components violate those budgets.
Agents might start with acceptable 2-second response times, but as you add features... latency creeps to 5 seconds, then 10, then becomes unusable.
The agent works correctly but responds too slowly.
編集コメントを表示
編集コメント
本記事は、AI エージェントの実運用において最も厄介な「エラーにはならないが性能が劣化する」状態への対処法を体系的に示しており、実務レベルの知見として価値が高い。AWS の公式ブログであるため、具体的なツールの連携方法や設定手順に関する信頼性の高い情報が得られる。
Source Article
元記事を日本語で読む
本文に関係しない購読案内、埋め込み通知、サイト内プロモーションは除いています。
AI エージェントをプロトタイプから本番環境へ移行すると、課題は「動かすこと」から「高速かつ効率的に運用すること」へとシフトします。このシリーズの第 1 部では、無限ループやツール呼び出しエラーという 2 つの一般的なエージェント障害のデバッグ方法をご紹介しました。これらは文字通り機能していないエージェントへの対応でした。
一方、今回の記事で取り上げるのは、正しく動作しているにもかかわらずパフォーマンスが低いケースです。本番環境での初期デバッグ問題を解決した後に顕在化するのが、応答時間の遅延とメモリ使用量の無制限な増加といった運用上の課題です。これらはエラーアラートを発令するわけではありませんが、ユーザーの信頼を損ない、長期的にはコスト増にもつながります。
Amazon Bedrock AgentCore の機能である「AgentCore Observability」と、Amazon CloudWatch を活用すれば、エージェントの実行パス全体におけるパフォーマンスのボトルネックを特定し、長時間実行されるセッションでのメモリ問題も診断できます。また、ユーザーが不具合に気づく前に検知できるモニタリング手法を実装することも可能です。詳細やベストプラクティスについては、同様に Amazon Bedrock AgentCore の機能である「AgentCore Evaluations」および「AgentCore Insights」のドキュメントも併せてご参照ください。
前提条件
AWS アカウントを用意し、Amazon Bedrock AgentCore へのアクセス権限を付与した上で、CloudWatch のトランザクション検索機能を有効化している必要があります。さらに、エージェントがデプロイ済みであることも必須です。完全なセットアップ手順については、パート 1 をご確認ください。
シナリオ3:パフォーマンスのボトルネック
エージェントは正しく動作しているにもかかわらず、応答が遅すぎる場合にパフォーマンスのボトルネックに陥ります。1 秒未満での応答を期待していても、実際には数秒の遅延が発生します。タスク自体は成功裏に完了しますが、そのレイテンシのために対話型のユースケースでは実用性が損なわれます。
このシナリオが特に難しいのは、「遅い」という基準が主観的である点です。バッチ処理用のエージェントには許容される速度でも、カスタマーサポートのチャットボットにとっては許容できません。まずは特定のユースケースに応じたパフォーマンスの目標値(予算)を設定し、その目標をどのコンポーネントが違反しているかを体系的に特定する必要があります。
注意すべき症状
パフォーマンスの低下は、しば然是ゆっくりと現れます。最初は 2 秒程度の応答時間で問題なかったエージェントも、機能追加やツールの統合、メモリ量の増加に伴い、遅延が徐々に 5 秒、10 秒へと悪化し、最終的には使い物にならなくなるケースがあります。
P95 レスポンス時間が閾値を超え、ユーザーがセッションを離脱しても、エラー発生率は低いままであることが特徴です。これは「エージェントは正しく動作しているが、応答が遅すぎる」状態を示しています。
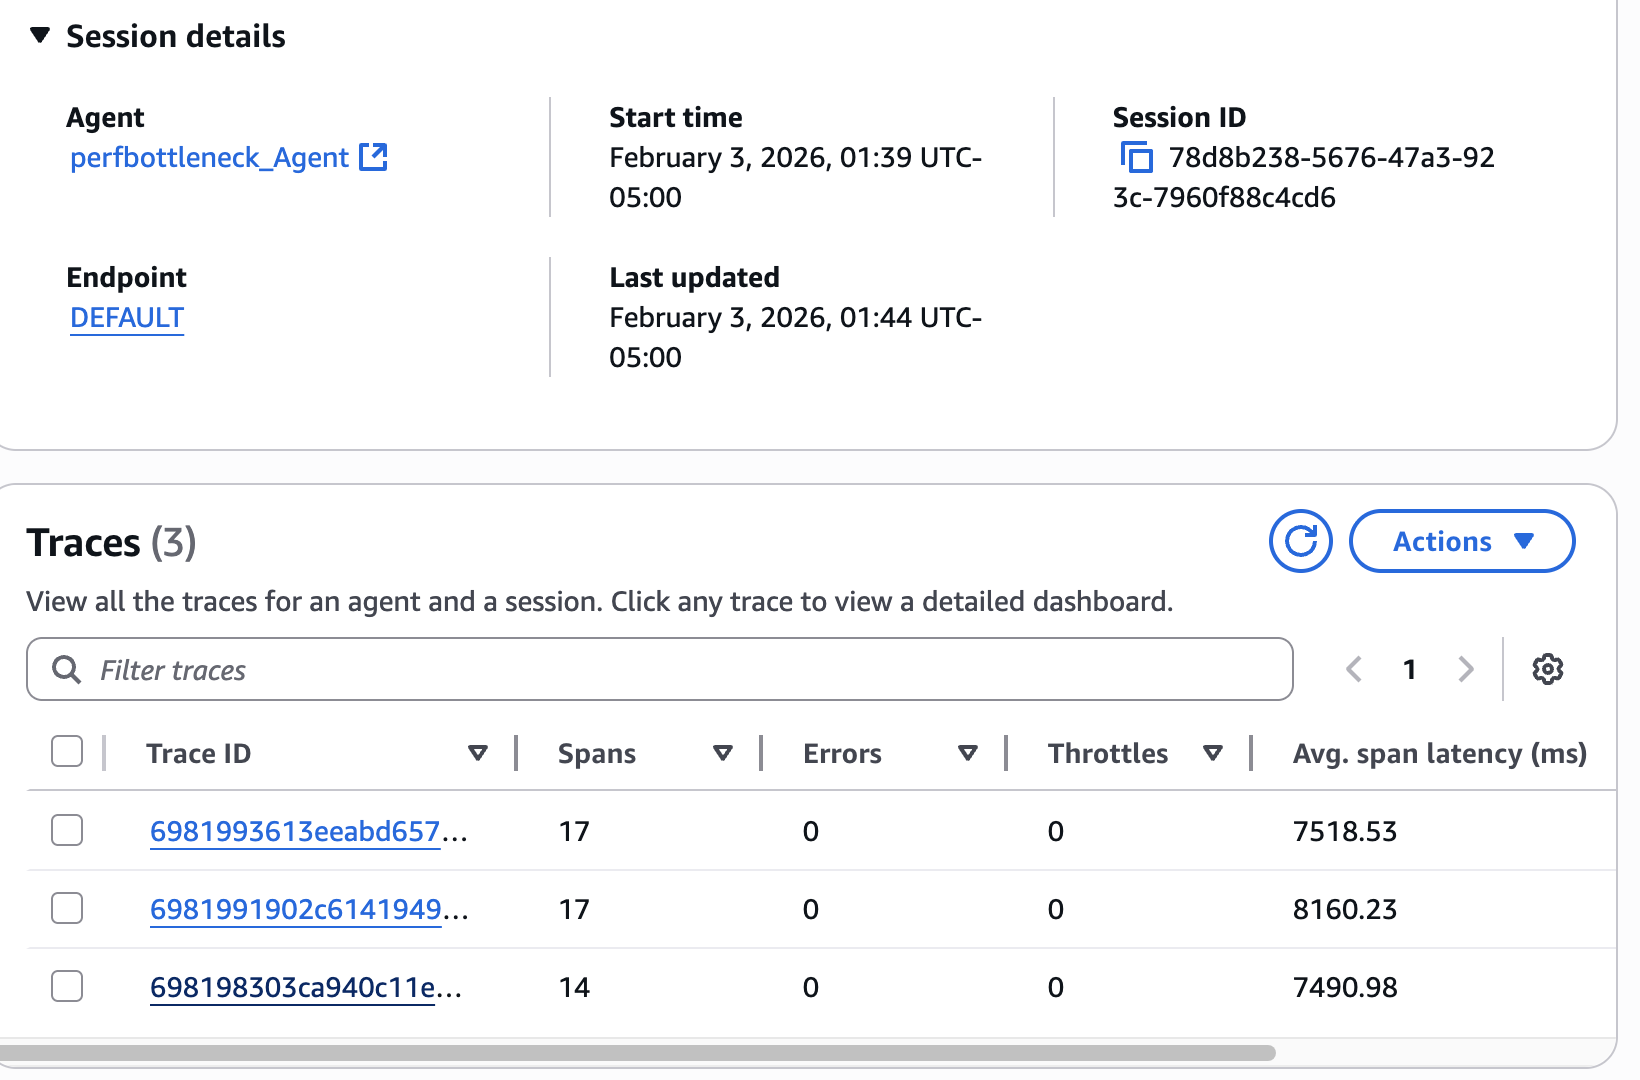
図 1 — セッション詳細。複数のトレースで一貫して高いレイテンシが確認されています。3 回の呼び出しはそれぞれ 7.5〜8.2 秒(平均スパンレイテンシ)を要しており、偶発的な遅延ではなくシステム全体の性能ボトルネックであることがわかります。このパターンから、エージェントのアーキテクチャに最適化が必要だと判断できます。
ボトルネックを特定するには、まずレイテンシの高いリクエストから始めましょう。CloudWatch でパフォーマンス予算を超えたエージェント呼び出しをクエリします。
fields @timestamp, RequestId, Latency
| filter Operation like /InvokeAgent/
| filter Latency > 3000
| sort Latency desc
| limit 50
このクエリは、3 秒以上かかったエージェント呼び出し(閾値は要件に応じて調整可能)をレイテンシ順にソートして返します。代表となる高レイテンシのリクエストを選び、その RequestId をメモしておきます。
次に、リクエストのタイムラインを分析して、どこで時間が消費されているかを把握しましょう。
fields @timestamp, Operation, Duration, SpanName
| filter RequestId = ""
| sort @timestamp asc
このクエリでは、リクエスト内の操作シーケンスと各操作にかかった時間が表示されます。不釣り合いに時間を要している操作がないか確認してください。よくある原因としては、メモリ検索処理、ツール呼び出し、トークン生成、そして並列実行可能なものを逐次実行しているケースなどが挙げられます。
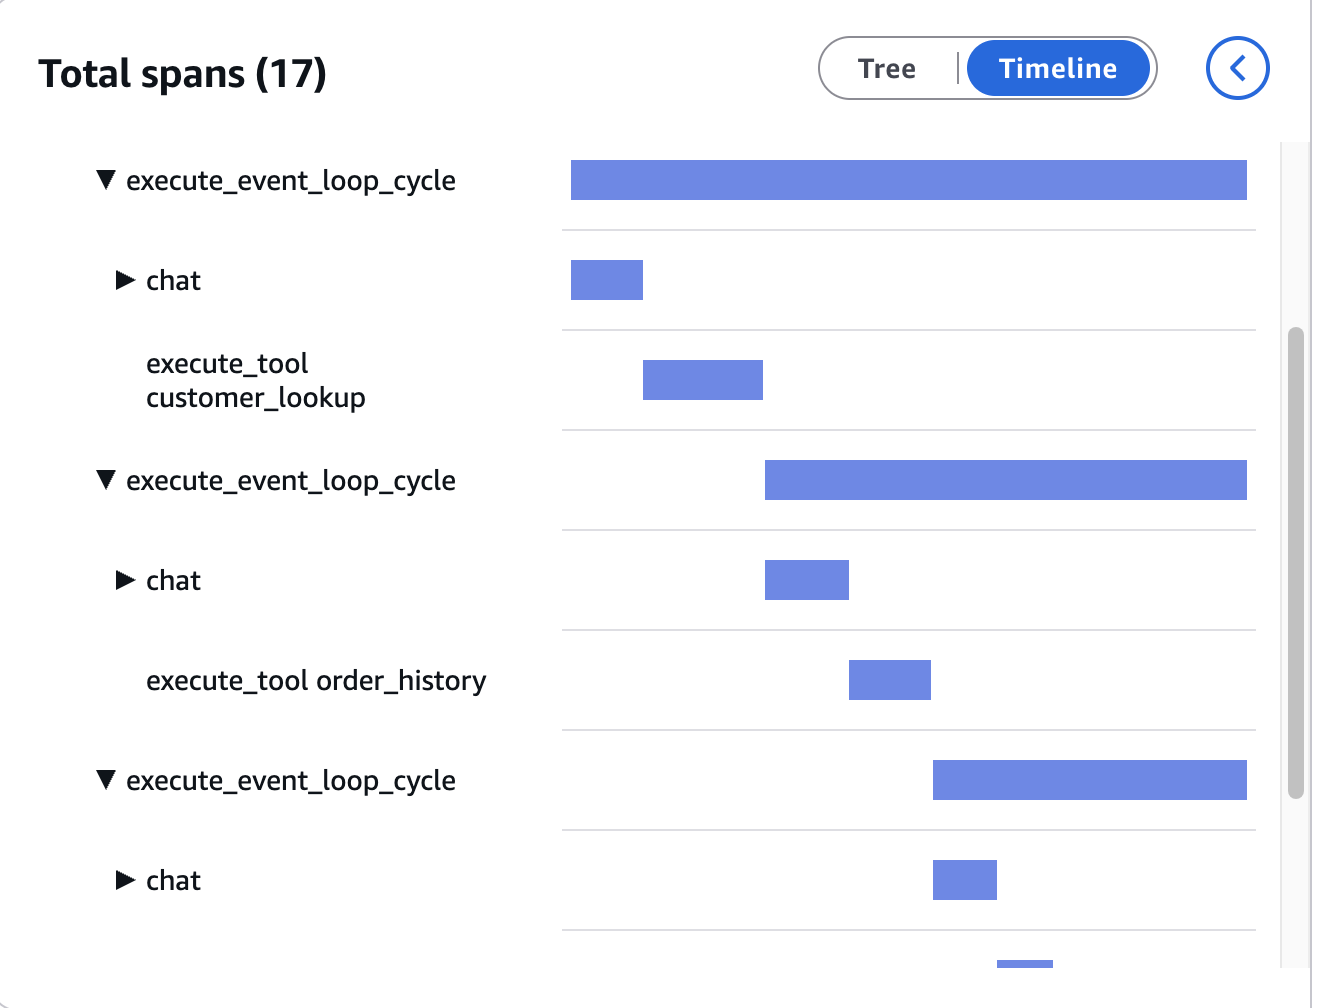
*図 2 — OpenTelemetry のトレースタイムライン。3 つの逐次実行される execute_event_loop_cycle 操作にまたがる 17 スパンが表示されています。ツール(customer_lookup、order_history)は並列ではなく順次実行されており、各サイクルは前回の完了を待ってから次の処理を開始します。この逐次的なパターンにより、各ツールの呼び出しでレイテンシが累積していきます。
メモリ検索のレイテンシについては特に注意して確認しましょう。
fields @timestamp, MemoryRetrievalLatency, MemoryNamespace
| filter RequestId = ""
| stats avg(MemoryRetrievalLatency), max(MemoryRetrievalLatency) by MemoryNamespace
メモリ検索は 200 ミリ秒以内で完了させる必要があります。これを超えると、ユーザーは対話型アプリケーションにおいて遅延を明確に感じるようになります。応答が遅い場合は、メモリの構成が非効率である可能性があります。
ツールの呼び出し遅延を確認し、動作の重い統合箇所を特定しましょう:
fields @timestamp, ToolName, ToolLatency
| filter RequestId = ""
| sort ToolLatency desc
このクエリにより、全体のパフォーマンスに最も影響を与えるツールがわかります。1 つでも応答が遅いツールがあれば、それがエージェントワークフロー全体のボトルネックになる恐れがあります。
根本原因の分析
パフォーマンスのボトルネックは、主に以下の3つの根本原因から発生します。
- ツールの実行遅延: 外部ツールの最適化不足、過負荷、またはネットワークの問題により、応答に数秒を要する場合に発生します。呼び出しが連続するほど遅延は蓄積するため、2 秒かかるツールを3回連続で呼べば、6 秒のボトルネックが生じます。
- トークン生成量の過多: 基盤モデル(FMs)はトークンを順次生成するため、500 トクンの応答は100 トクンの応答よりも約5倍時間がかかります。これは遅延だけでなくコストにも直結します。
- 逐次処理の実行: 独立した処理を並列化せず、一つずつ順番に行う方式では、計算コストと実行時間の両方が増加してしまいます。
改善策
ツール実行が遅い場合は、レスポンス時間を短縮するためにキャッシュの導入、コネクションプールの設定、適切なデータベースインデックスの作成を実行してください。タイムアウト制限を設定し、より高速なツールの代替案も検討しましょう。特定のツールが常に遅延を示す場合は、そのツール単体でプロファイリングを行う必要があります。問題の原因はロジック自体ではなく、ネットワークレイテンシ、コールドスタート、リソース競合にある可能性が高いです。
メモリ検索の最適化には、大規模な単一名前空間を「設定」「履歴」「ドメイン知識」などトピック固有のパティションに分割して検索範囲を狭めることが有効です。過去の会話はそのまま保存するのではなく要約してコンパクトなエントリに変換し、各名前空間に対してサイズ制限(例:設定 100 件、直近メッセージ 50 件、ドメイン知識 500 件)を設定しましょう。
トークン生成においては、詳細な指示がない限り 2〜3 文で簡潔かつ直接的な回答を促すようプロンプトを最適化します。明確な長さの制約を追加し、予期せぬ長文応答に対してアラートを発令する形でトークン使用量を監視してください。
順次処理の場合は、独立したツール呼び出しを並列実行しましょう。個別に 2 秒、1.5 秒、1 秒かかる合計 4.5 秒の順次呼び出しも、並列化すればわずか 2 秒で完了し、最小限の手間でレイテンシが 50% 以上短縮されるケースが多々あります。最適化の効果を検証するには、ボトルネックを特定した際のレイテンシクエリを再実行してください。P95 レスポンス時間がパフォーマンス予算内に収まっていること、およびトレースタイムラインで期待通りに並列実行が行われていることを確認しましょう。
シナリオ 4:長時間実行されるセッションにおけるメモリ問題
エージェントがセッションを維持する際、メモリ使用量が無制限に増加すると、長時間実行されるセッションでメモリ不足が発生します。コンテキストが蓄積され続け、最終的にトークン制限に達したり、重要な文脈を見失ったり、利用可能なメモリが枯渇したりします。その結果、セッションは予期せず失敗し、会話の状態を失ってしまいます。この問題は、カスタマーサポートやリサーチアシスタント、監視エージェントなど、拡張されたワークフローをサポートするエージェントにとって特に深刻です。適切なメモリ管理が行われない場合、これらのユースケースを実用的に運用することは困難になります。
注意すべき症状
異常に長いセッションが存在する場合、トークン使用量はセッションの継続時間に応じて線形に増加します。また、メモリストアが成長するにつれて、メモリ検索のレイテンシも徐々に高まります。最終的に、メモリエラーやコンテキストウィンドウ超過エラーにより、セッションが予期せず終了してしまいます。
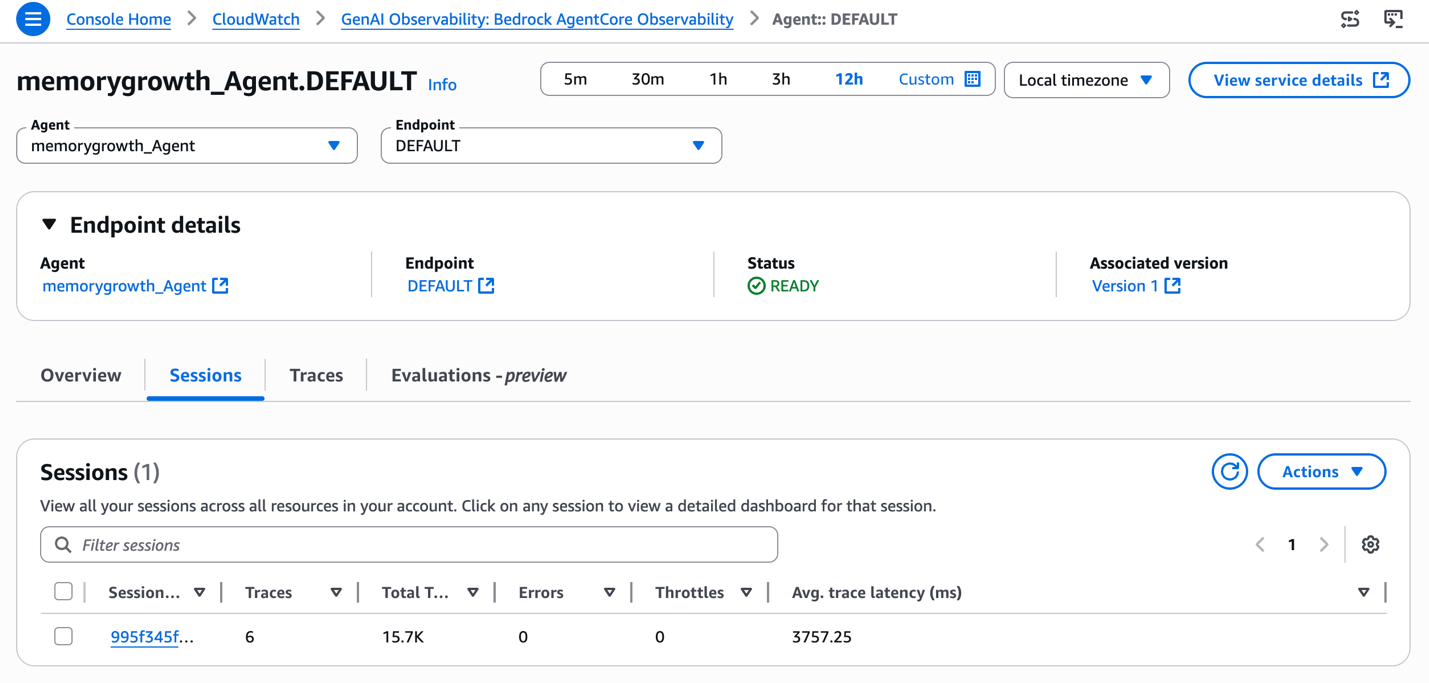
*図 3 — メモリ増加を示す「memorygrowth_Agent」のセッション詳細。1 つのセッション内で 6 つのトレース、合計 15.7K トークンの消費、平均トレースレイテンシ 3,757 ミリ秒が確認されています。トークン使用量は各呼び出しごとに増加し、コンテキストが無制限に蓄積されている様子が示されています。数時間にわたる本番環境のセッションでは、このパターンがコンテキストウィンドウの枯渇や予期せぬセッション障害を引き起こします。
メモリ使用量の高い長時間実行セッションを特定するには:*
次のクエリを実行します。
fields @timestamp, SessionId, SessionDuration, MemorySize, TokenUsage
| filter SessionDuration > 3600
| sort MemorySize desc
| limit 20
このクエリは、1 時間(3600 秒)以上継続したセッションをメモリ使用量の降順でソートして返します。異常にメモリ使用量が高いセッションを選び出し、その SessionId を記録してください。
統合処理が正しく行われているか確認するために、メモリの抽出パターンを検査します。
fields @timestamp, MemoryExtractionStatus, MemoryExtractionLatency, MemoriesExtracted
| filter SessionId = ""
| sort @timestamp asc
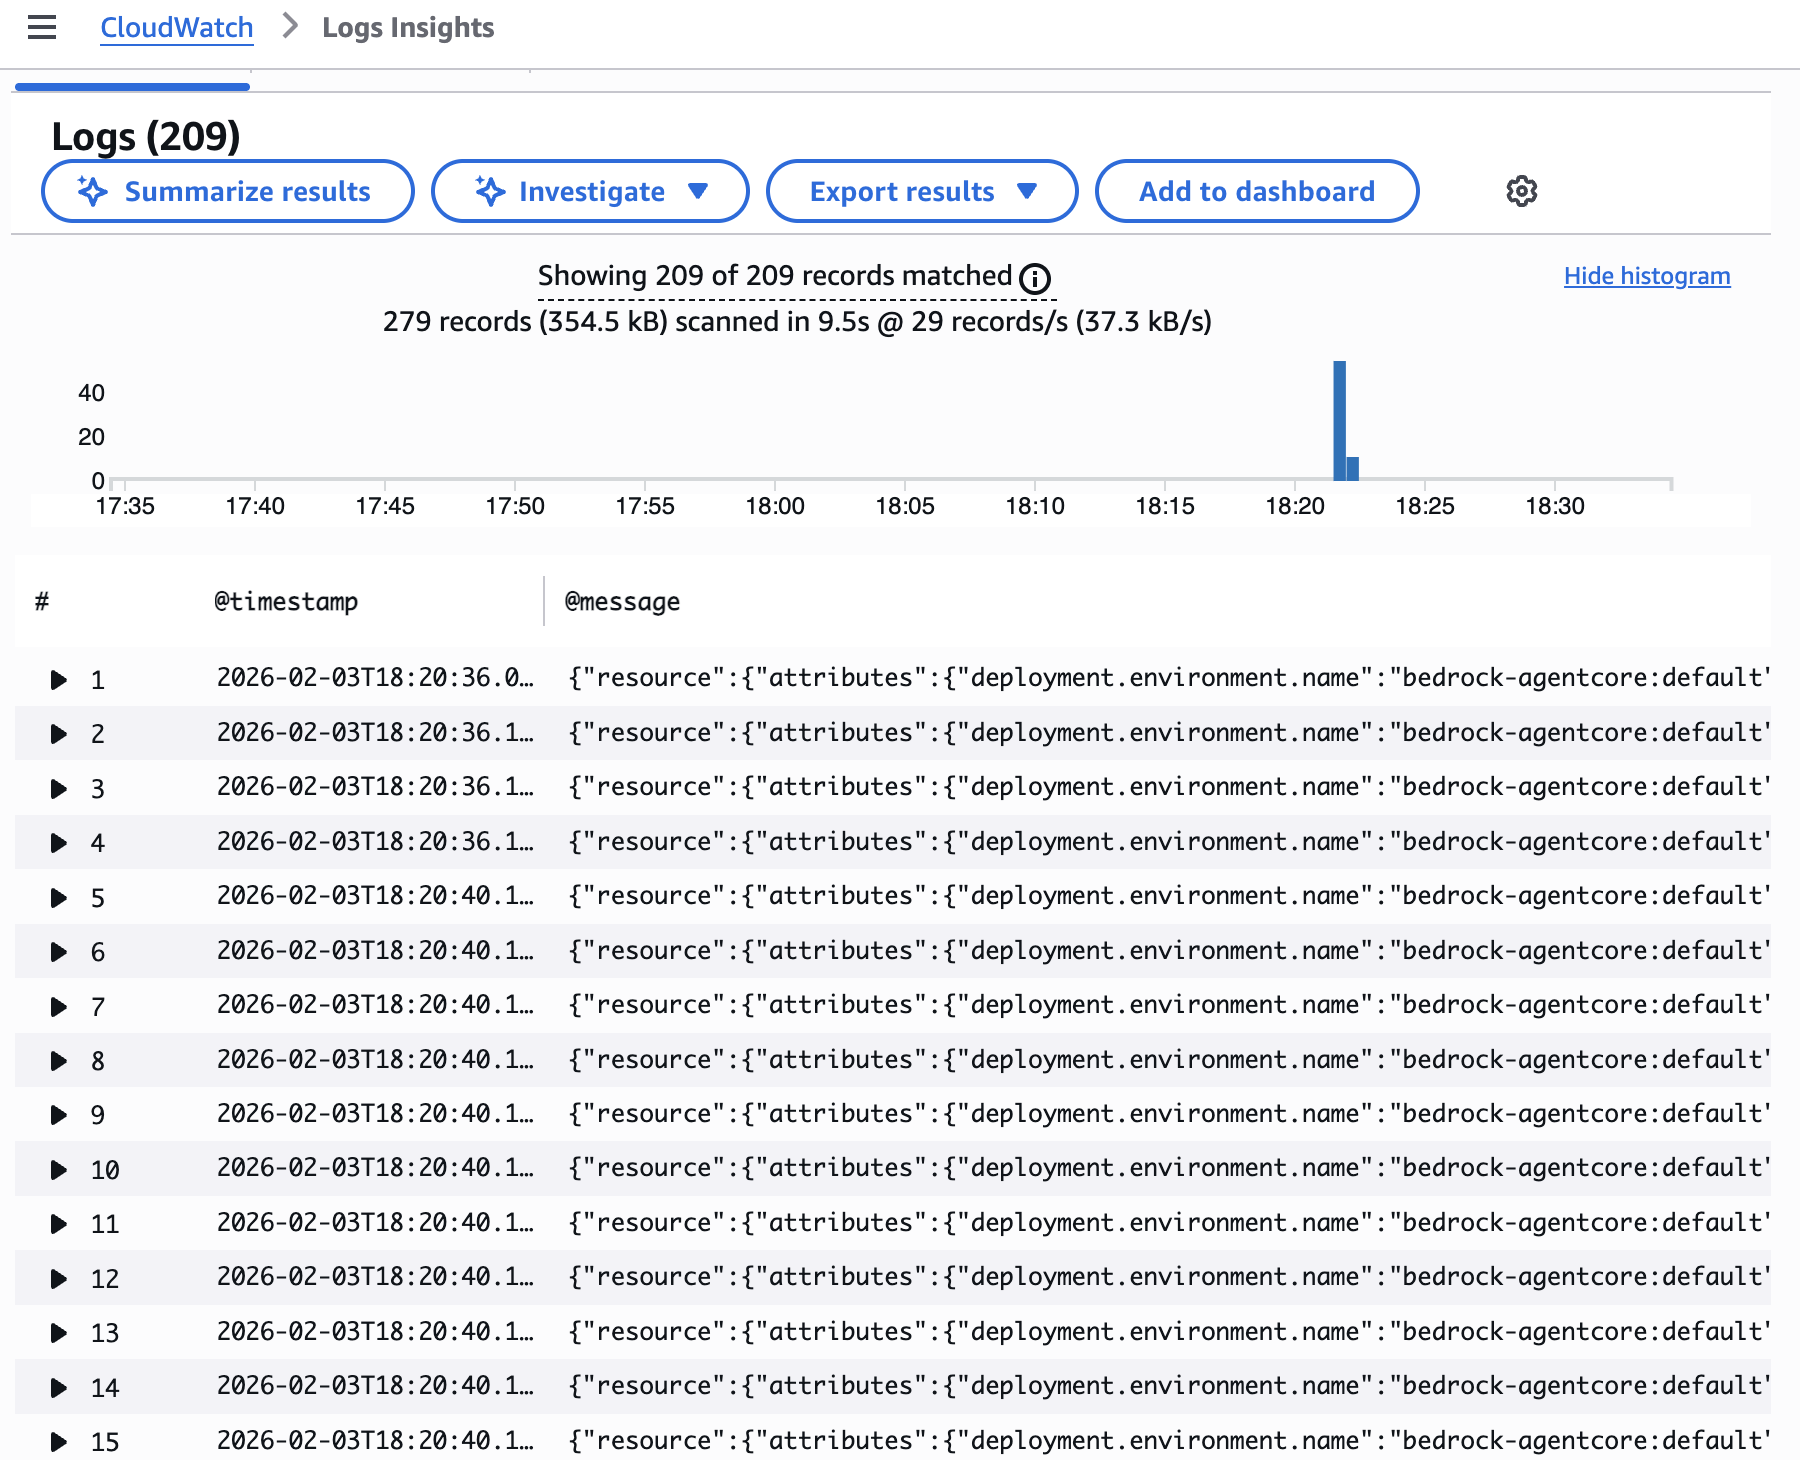
*図 4 — CloudWatch Logs Insights のスクリーンショット。18:20 頃に集中した 209 件のメモリ関連ログエントリが表示されています。メモリエントリの急増は、エージェントが情報を保存しているものの統合処理を行っていないことを示しています。各呼び出しで add_conversation_note や add_user_context ツールを通じて新しいメモリエントリが追加される一方、古いデータの削除や要約が行われないため、無制限に成長するパターンが確認できます。
メモリ抽出はセッション全体を通して定期的に発生する必要があります。もし一定期間全く抽出が発生しないギャップがある場合は、エージェントが適切に記憶を統合できていない可能性があります。
メモリの抽出エラーがないか確認します。
fields @timestamp, ErrorMessage, MemoryExtractionStatus
| filter SessionId = ""
| filter MemoryExtractionStatus = "Failed"
メモリ抽出に失敗すると、エージェントが文脈を統合できず、メモリ量が制御不能に増大してしまいます。よくある失敗原因としては、要約処理中にトークン制限を超えてしまうこと、処理できない形式の無効なメモリデータ、メモリストレージへの書き込み時に発生するネットワークタイムアウト、そしてメモリ更新をブロックする権限エラーなどが挙げられます。
メモリの名前空間構成を確認しましょう。
fields @timestamp, MemoryNamespace, MemoryCount, MemorySize
| filter SessionId = ""
| stats sum(MemoryCount) as TotalMemories, sum(MemorySize) as TotalSize by MemoryNamespace
| sort TotalSize desc
メモリは複数の名前空間に分散されています。名前空間の構成が不適切だと、メモリの検索や統合が非効率になる恐れがあります。もし単一の名前空間に数千件のメモリが格納されている場合は要注意です。これはエージェントに対して、より良いメモリ組織化が必要であることを示すシグナルです(大規模なエージェントのメモリ整理:AgentCore Memory における名前空間設計パターン を参照)。
根本原因分析
メモリに関する問題の多くは、設定の不備やレコード内の組み込み日時メタデータに対するフィルターの誤りなどに起因します。AgentCore のメモリ機能がどのように動作するかをより深く理解したい場合は、AgentCore Memory をご覧ください。
解決策
メモリ関連の問題を解消するには、記憶戦略に統合設定が含まれていることを確認してください。これにより、AgentCore のメモリは記録を時間とともに統合・要約し、無制限に蓄積されるのを防ぎます。また、戦略定義で名前空間テンプレートを用いて記録を整理することで、検索が適切なコンテキスト範囲内に収まるようにします。
イベントの有効期限(eventExpiryDuration)を設定して、生イベントの保持期間を制御することも重要です。設定可能な期間は 7〜365 日です。
実装の詳細については、AgentCore メモリ実装 をご覧ください。
本番環境でのベストプラクティス
これまで両パートで取り上げた 4 つの障害シナリオを解説しました。ここからは、これらの問題が起きる前に防ぐための本番環境向けのベストプラクティスについて説明します。
これまでに紹介したトラブルシューティングの手順は、問題が発生した際の対応に役立ちますが、適切に設計された観測戦略(observability strategy)を用いれば、問題を未然に検出できます。AgentCore と CloudWatch の連携が、この予防的なアプローチの基盤となります。これにより、エージェントの健全性とパフォーマンスをリアルタイムで把握することが可能になります。
本番環境のエージェント、メモリシステム、ゲートウェイに対して包括的な計測(instrumentation)を有効にしてください。CloudWatch ログ、CloudWatch メトリクス、OpenTelemetry トレースを設定することで、より詳細な可視化を実現できます。
クリティカルな指標に対して CloudWatch のアラームを設定しましょう。エラー率が 5%、95 パーセンタイル(P95)レイテンシが 3 秒、セッションあたりのトークン使用量といった閾値を定義します。ユーザーからの報告を待つのではなく、これらの指標が許容範囲を超えた時点で CloudWatch が自動的に通知する仕組みを用意してください。
運用用のダッシュボードを作成しましょう。メインのダッシュボードには直近 24 時間の総呼び出し数、現在のエラー率とベースラインとの比較、P50/P95/P99 のレイテンシ、トークン使用量の推移、アクティブなセッション数を表示します。また、エージェントごとのダッシュボードでは、各エージェント特有の呼び出しパターン、ツールの使用内訳、メモリ消費量の傾向、エラー種類の分布、セッションあたりのコストを可視化しましょう。これらのダッシュボードは毎日確認し、問題化する前にトレンドを把握しておくことが重要です。
必要になる前に観測基盤への投資を行いましょう。開発プロセスの初日から監視機能を組み込みます。プロダクトマネージャーやステークホルダーとダッシュボードを共有し、エージェントのパフォーマンスについて全員が共通認識を持てるようにしてください。複雑な本番環境の問題を誰かが解決した際は、そのアプローチをチーム全体で共有し、一般的な障害パターンの知見として蓄積していくことが大切です。
ツールの精度を大規模に監視するには、Amazon Bedrock の AgentCore Evaluators を活用できます。これにより、エージェントの動作を継続的かつ自動的に評価することが可能です。失敗が発生した後に手動でトレースを確認するのではなく、Evaluators はセッションをリアルタイムで検査し、事前に定義された品質基準に基づいてスコアリングを行います。
Amazon Bedrock の AgentCore Insights (プレビュー) は、この Evaluators を基盤としており、トリアージ分析機能を提供します。Insights では、失敗の原因分析やユーザーの意図抽出、実行サマリーなどの情報を得ることができます。
クリーンアップ
本記事で解説した最適化手法をテストした後、不要な課金を防ぐためにリソースの整理を行いましょう。
CloudWatch リソースについては、デバッグ中に作成したテストダッシュボードを削除し、テスト用に設定したアラームを解除してください。また、もはや必要がなくなった古いロググループはアーカイブするか、削除することをお勧めします。
AgentCore リソースについては、本チュートリアル用に特別に作成したテストエージェントがあれば、AgentCore コンソール から削除してください。メモリ最適化のテストで作成されたメモリの名前空間もすべて削除しましょう。パフォーマンステストのために使用した一時的なツール連携についても同様に削除します。
コスト最適化のため、Amazon CloudWatch Logs の保持設定を見直し、コンプライアンス要件に基づいて調整してください。古いログのストレージコストを削減するには、CloudWatch Logs データ保護機能の利用も検討しましょう。
CloudWatch ロググループを削除する場合は、以下のコマンドを実行します。
aws logs delete-log-group --log-group-name /aws/bedrock-agentcore/your-agent-name
CloudWatch アラームを削除する場合は、以下のように指定してください。
aws cloudwatch delete-alarms --alarm-names your-alarm-name
結論
デバッグシナリオ(Part 1 で解説)を超えた生産環境のエージェントにおいて、パフォーマンスのボトルネックやメモリ問題は最も一般的な運用課題です。CloudWatch のトレースとメトリクスを体系的に診断することで、レイテンシの原因がツールの遅延なのか、メモリアクセスの非効率性なのか、トークン生成量の過多なのか、あるいは逐次処理によるものなのかを特定できます。長時間実行されるセッションでは、メモリ使用量の変動パターンを監視し、統合戦略を実装することで、エージェントを安定した状態に保つことが可能です。
次のステップ
これらのテクニックを実践に移す準備はできましたか?まだであれば、まず生産環境のエージェントで AgentCore Observability を有効化することから始めましょう。この一度きりの設定が、これまでに解説したすべての機能の基盤となります。重要なメトリクスに対して CloudWatch アラームを設定し、各エージェントやワークフローに合わせたトラブルシューティングの手順書(ランブック)を作成してください。手順書には、実行するクエリ、問題を示す閾値、そして適用する修正策を明記しておきましょう。
本番環境でデバッグを行う際は、非本番環境を活用しましょう。意図的に障害を発生させ、これまで紹介したワークフローを使って診断する練習を重ねます。いざ本番で問題が発生した際に備え、トラブルシューティングの勘所を体に染み込ませておくことが重要です。また、チーム内でこの知見を広め、エージェントを運用する全員がこれらのデバッグ手法を理解し、AgentCore の観測機能を活用できる体制を整えてください。
生産用エージェントが失敗する原因の多くは、未然に防げるものです。適切な観測ツールと体系的なトラブルシューティングのアプローチ、そして「すべての課題は改善の機会」と捉える文化があれば、問題を早期に発見し、迅速に対応できます。その結果、長期的な信頼を獲得できるエージェントを構築することが可能になります。
さらに詳しく知る
AgentCore や観測機能の詳細については、以下のドキュメントをご覧ください。
原文を表示
As your AI agents move from prototype to production, the challenges shift from getting them to work to keeping them fast and efficient. In Part 1 of this series, we walked through debugging two common agent failures: infinite loops and tool invocation errors. Those scenarios dealt with agents that were broken. In this post, we tackle a different challenge: agents that work correctly but perform poorly. Slow response times and unbounded memory growth are the most common operational issues that surface after you resolve the initial debugging problems. They don’t trigger error alerts, but they erode user trust and increase costs over time.
Using AgentCore Observability, a capability of Amazon Bedrock AgentCore, and Amazon CloudWatch, you will learn how to identify performance bottlenecks across your agent’s execution path and diagnose memory issues in long-running sessions. You will also implement monitoring practices that catch degradation before users notice it. For additional information and best practices, review AgentCore Evaluations, a capability of Amazon Bedrock AgentCore, and AgentCore Insights.
Prerequisites
You need an AWS account with Amazon Bedrock AgentCore access, CloudWatch Transaction Search enabled, and a deployed agent. See Part 1 for full setup details.
Scenario 3: Performance bottlenecks
Agents experience performance bottlenecks when they work correctly but respond too slowly. You expect sub-second responses but experience multi-second delays. Agents complete tasks successfully, but the latency makes them impractical for interactive use cases. This scenario is particularly challenging because *slow* is subjective. What’s acceptable for a batch processing agent is unacceptable for a customer service chatbot. You must establish performance budgets for your specific use case, then systematically identify which components violate those budgets.
Symptoms to watch for
Performance degradation often manifests gradually. Agents might start with acceptable 2-second response times, but as you add features, integrate more tools, or accumulate more memory, latency creeps to 5 seconds, then 10, then becomes unusable. P95 response times exceed your thresholds, users abandon sessions, but error rates stay low. The agent works correctly but responds too slowly.
*Figure 1 — Session details showing multiple traces with consistently high latency. The three invocations took 7.5-8.2 seconds (average span latency), demonstrating a systemic performance bottleneck rather than occasional slowness. This pattern indicates the agent’s architecture needs optimization.*
To find bottlenecks, start by identifying high-latency requests. Query CloudWatch for agent invocations that exceed your performance budget:
fields @timestamp, RequestId, Latency
| filter Operation like /InvokeAgent/
| filter Latency > 3000
| sort Latency desc
| limit 50This query returns agent invocations that took longer than 3 seconds (adjust the threshold based on your requirements), sorted by latency. Pick a representative high-latency request and note its RequestId.
Next, analyze the request timeline to understand where time is spent:
fields @timestamp, Operation, Duration, SpanName
| filter RequestId = ""
| sort @timestamp ascThe query shows you the sequence of operations within the request and how long each took. Look for operations that consume disproportionate time. Common culprits include memory retrieval operations, tool invocations, token generation, and sequential operations that could run in parallel.
*Figure 2 — OpenTelemetry trace timeline showing 17 spans across three sequential execute_event_loop_cycle operations. The tools (customer_lookup, order_history) execute one after another rather than in parallel, with each cycle waiting for the previous one to complete. This sequential pattern compounds latency across each tool invocation.*
Check memory retrieval latency specifically:
fields @timestamp, MemoryRetrievalLatency, MemoryNamespace
| filter RequestId = ""
| stats avg(MemoryRetrievalLatency), max(MemoryRetrievalLatency) by MemoryNamespaceMemory retrieval should complete in under 200 milliseconds, representing the point where users begin perceiving noticeable delays in interactive applications. Higher latency suggests inefficient memory organization.
Examine tool invocation latency to identify slow integrations:
fields @timestamp, ToolName, ToolLatency
| filter RequestId = ""
| sort ToolLatency descThe query identifies which tools contribute most to overall latency. A single slow tool can bottleneck the entire agent workflow.
Root cause analysis
Performance bottlenecks typically stem from three root causes. *Slow tool execution* occurs when external tools take seconds to respond because of poor optimization, overload, or network issues. Latencies compound with sequential calls, so a 2-second tool called three times becomes a 6-second bottleneck. *Excessive token generation* is a factor because foundation models (FMs) produce tokens sequentially, meaning a 500-token response takes 5x longer than a 100-token one, impacting both latency and cost. Finally, *sequential processing*, performing independent operations one at a time instead of in parallel, increases both cost and compute times.
The fix
For slow tool execution, implement caching, connection pooling, and proper database indexing to reduce response times. Set timeout limits and consider faster tool alternatives. If a tool consistently lags, profile it independently. The issue might be network latency, cold starts, or resource contention rather than the tool’s logic itself.
For memory retrieval, replace single large namespaces with topic-specific partitions, such as preferences, history, and domain knowledge, to reduce search space. Summarize old conversations into compact entries rather than storing them verbatim, and set size limits per namespace, such as 100 preferences, 50 recent messages, or 500 domain facts.
For token generation, optimize prompts to encourage brief, direct answers of 2–3 sentences unless more detail is requested. Add explicit length constraints and monitor token usage with alerts for unexpectedly long responses.
For sequential processing, run independent tool calls in parallel. Sequential calls totaling 4.5s (2s + 1.5s + 1s) drop to only 2s when parallelized, often cutting latency by 50 percent or more with minimal effort. To verify your optimizations, re-run the latency query from the identifying bottlenecks section. Confirm that P95 response times now fall within your performance budget and that the trace timeline shows parallel execution where expected.
Scenario 4: Memory issues in long-running sessions
Agents experience memory issues in long-running sessions when they maintain sessions where memory usage grows unbounded. Agents accumulate context, and eventually, agents hit token limits, lose important context, or exhaust available memory. Sessions fail unexpectedly, and you lose conversation state. This scenario is particularly problematic for agents that support extended workflows, such as customer service sessions, research assistants, or monitoring agents. Without proper memory management, these use cases become impractical.
Symptoms to watch for
When abnormally long agent sessions exist, token usage grows linearly with session duration. Memory retrieval latency increases over time as memory stores grow. Sessions terminate unexpectedly with out-of-memory errors or context window exceeded errors.
*Figure 3 — Session details for the memorygrowth_Agent showing 6 traces, 15.7K total tokens consumed, and an average trace latency of 3,757 ms within a single session. Token usage grows with each successive invocation, demonstrating unbounded context accumulation. In production sessions spanning hours, this pattern leads to context window exhaustion and unexpected session failures.*
To identify long-running sessions with high memory usage:
fields @timestamp, SessionId, SessionDuration, MemorySize, TokenUsage
| filter SessionDuration > 3600
| sort MemorySize desc
| limit 20The query returns sessions lasting longer than one hour (3600 seconds), sorted by memory size. Pick a session with unusually high memory usage and note its SessionId.
Examine memory extraction patterns to verify consolidation is occurring:
fields @timestamp, MemoryExtractionStatus, MemoryExtractionLatency, MemoriesExtracted
| filter SessionId = ""
| sort @timestamp asc*Figure 4 — CloudWatch Logs Insights showing 209 memory-related log entries concentrated around 18:20. The spike in memory operations indicates the agent storing information without consolidation. Each invocation adds new memory entries (through add_conversation_note and add_user_context tools) without pruning or summarizing old data, demonstrating the unbounded growth pattern.*
Memory extraction should occur regularly throughout the session. If you see gaps where no extraction happens for extended periods, the agent isn’t consolidating memories properly.
Check for memory extraction failures:
fields @timestamp, ErrorMessage, MemoryExtractionStatus
| filter SessionId = ""
| filter MemoryExtractionStatus = "Failed"Failed memory extraction stops agents from consolidating context, causing unbounded growth. Common failure reasons include token limits exceeded during summarization, invalid memory formats that can’t be processed, network timeouts when writing to memory storage, and permission errors that block memory updates.
Analyze memory namespace organization:
fields @timestamp, MemoryNamespace, MemoryCount, MemorySize
| filter SessionId = ""
| stats sum(MemoryCount) as TotalMemories, sum(MemorySize) as TotalSize by MemoryNamespace
| sort TotalSize descMemories are distributed across namespaces. Poor namespace organization can lead to inefficient memory retrieval and consolidation. If you see a single namespace containing thousands of memories, that’s a red flag indicating your agent needs better memory organization.
Root cause analysis
Memory issues typically stem from misconfigured settings, filter on inbuilt datetime metadata of the record. For a deeper understanding of how AgentCore memory works, see AgentCore memory.
The fix
To resolve memory issues, verify your memory strategies include a consolidation configuration so AgentCore memory merges and summarizes records over time rather than accumulating them indefinitely. Organize records using namespace templates in your strategy definitions to make sure retrieval stays scoped to relevant context. Set eventExpiryDuration to control how long raw events persist (between 7–365 days). For implementation details, see AgentCore memory implementation.
Production best practices
Having covered the four failure scenarios across both parts, we now turn to production best practices that stop these issues before they occur. The troubleshooting workflows we’ve covered help you respond when things go wrong, but a well-architected observability strategy helps you proactively catch issues. The integration of AgentCore with CloudWatch provides the foundation for this proactive approach, giving you real-time visibility into agent health and performance.
Turn on comprehensive instrumentation for production agents, memory systems, and gateways. Configure CloudWatch logs, CloudWatch metrics, and OpenTelemetry traces.
Configure CloudWatch alarms for critical metrics. Set thresholds for error rates (5 percent), 95th percentile (P95) latency (3 seconds), and token usage per session. Don’t wait for users to report problems. Let CloudWatch alert you when metrics exceed acceptable thresholds.
Create operational dashboards. Build a primary dashboard showing total invocations (last 24 hours), error rate (current compared to baseline), P50/P95/P99 latency, token usage trends, and active sessions count. Create per-agent dashboards showing agent-specific invocation patterns, tool usage breakdown, memory consumption trends, error types distribution, and cost per session. Review these dashboards daily to spot trends before they become problems.
Invest in observability infrastructure before you need it. Build monitoring into your development process from day one. Share dashboards with product managers and stakeholders so everyone understands agent performance. When someone diagnoses a tricky production issue, share the approach with the team to build institutional knowledge about common failure patterns.
To monitor tool accuracy at scale, you can use Amazon Bedrock AgentCore Evaluators to continuously and automatically assess agent behavior. Instead of manually reviewing traces after failures occur, Evaluators inspect agent sessions in real time, scoring them against predefined quality criteria. Amazon Bedrock AgentCore Insights (preview) builds off Evaluators and provides triage analysis. Insights can provide failure analysis, user intent extraction, and execution summary.
Cleaning up
After testing the optimization techniques in this post, clean up resources to avoid unnecessary charges.
For CloudWatch resources, delete test CloudWatch dashboards created during debugging, remove CloudWatch alarms set up for testing purposes, and consider archiving or deleting old CloudWatch log groups if no longer needed.
For AgentCore resources, if you created test agents specifically for this tutorial, delete them through the AgentCore console. Remove any test memory namespaces created during memory optimization testing. Delete any temporary tool integrations used for performance testing.
For cost optimization, review your Amazon CloudWatch Logs retention settings and adjust based on your compliance requirements. Consider using CloudWatch Logs data protection to cut storage costs for older logs.
To delete CloudWatch log groups:
aws logs delete-log-group --log-group-name /aws/bedrock-agentcore/your-agent-nameTo remove CloudWatch alarms:
aws cloudwatch delete-alarms --alarm-names your-alarm-nameまとめ
Performance bottlenecks and memory issues represent the most common operational challenges for production agents beyond the debugging scenarios covered in Part 1. With systematic diagnosis using CloudWatch traces and metrics, you can identify whether latency stems from slow tools, inefficient memory retrieval, excessive token generation, or sequential processing. For long-running sessions, monitoring memory growth patterns and implementing consolidation strategies keeps agents stable over extended interactions.
Next steps
Ready to put these techniques into practice? Start by turning on AgentCore Observability for your production agents if you haven’t already. This one-time setup provides the foundation for everything we’ve covered. Set up CloudWatch alarms for critical metrics. Create troubleshooting runbooks for your specific agents and workflows, documenting the queries you run, the thresholds that indicate problems, and the fixes you implement.
Practice debugging in non-production environments. Deliberately introduce failures and practice diagnosing them using the workflows we’ve covered. Build muscle memory for troubleshooting before you need it in production. Share this knowledge with your team to help confirm everyone who operates your agents understands these debugging techniques and knows how to use the observability features of AgentCore.
Production agents often fail for preventable reasons. With the right observability tools, systematic troubleshooting approaches, and a culture that treats every issue as a chance to improve, you can catch problems early, resolve them quickly, and build agents that earn lasting trust.
Learn more
For more information about AgentCore and observability features, visit the
関連記事
今日のまとめ
AIデイリーブリーフで今日の重要ニュースをまとめ読み