データサイエンティストの逆襲
Hamel Husainは、LLMの普及によりデータサイエンティストの役割が不要になるという懸念に対し、モデル訓練以外の「ハイス設計」や評価指標の構築といったデータサイエンスの本質的価値がむしろ重要になっていると主張している。
キーポイント
データサイエンティストの役割変化への反論
LLMによりAI実装のハードルが下がったことで、データサイエンティストの存在意義が問われているが、モデル訓練は業務の一部に過ぎず、その核心はシステム全体の設計にある。
ハイス(Harness)におけるデータサイエンスの重要性
OpenAIやAndrej Karpathyの事例から、エージェントやモデルを制御する「ハイス」にはテスト、仕様、そして何より観測可能性(ログ、メトリクス、トレース)が不可欠であり、これらはデータサイエンスの領域である。
実務の本質は実験とデバッグ
データサイエンティストの主要業務はモデル作成ではなく、AIが未知のデータに対してどのように汎化するかを検証する実験設計、確率的システムのデバッグ、適切な指標の設計にある。
汎用指標の限界とデータ探索の重要性
オフ・ザ・シェルフの指標(有用性や一貫性のスコアなど)は実際の障害を特定できず、データとトレースを直接確認してドメイン固有の失敗パターンを分析することが不可欠である。
カスタム指標とエラー分析の実践
ROUGEやBLEUのような汎用類似度指標はLLM出力には適合しにくく、「カレンダー予約の失敗」や「人間へのエスカレーション漏れ」など、アプリケーション固有の指標を定義しエラー分析を行う必要がある。
検証されていないJudgeの信頼性問題
LLMを評価者(Judge)として使用する場合、その判断をどう信頼するかという明確な答えを持たないチームが多く、Judgeの検証プロセスが不透明である。
Judgeを分類器として扱い、過学習を防ぐ
評価モデル(Judge)を機械学習の分類器として扱い、訓練データから例を抽出し、検証セットでプロンプトを最適化、テストセットで過学習を確認する標準的なML手法を適用すべきである。
影響分析・編集コメントを表示
影響分析
この記事は、LLM時代におけるデータサイエンティストのキャリアパスと企業内での役割再定義において重要な示唆を与える。技術的には、モデルそのものよりも、それを用いたシステムの信頼性保証(ハイス設計)が競争優位性の鍵となることを示唆しており、開発現場の優先順位変更に影響を与える可能性がある。
編集コメント
LLMの台頭で「データサイエンティストは不要」という議論が盛んである中、その実務の本質を「ハイス設計」という観点から再定義した示唆に富む分析である。技術者だけでなく、組織のスキルマップ見直しにも役立つ内容だ。
img.img-fluid {
border: 1px solid rgba(255, 255, 255, 0.25);
border-radius: 4px;
}
データサイエンティストの黄金時代は終わったのでしょうか。ハーバード・ビジネス・レビュー(Harvard Business Review)はかつて、これを「21 世紀で最もセクシーな職業」と呼びました。1 テクノロジー業界では、データサイエンティストの役割はしばしば最高水準の報酬を得るものの一つでした。2 この仕事にはまた、異例とも言えるスキルセットの組み合わせが求められました:
データサイエンティスト(名詞):統計学をどのソフトウェアエンジニアよりも得意とし、統計学者をどのソフトウェアエンジニアよりもソフトウェア工学に優れている人物。
— JosH100 (@josh_wills) 2012 年 5 月 3 日
これらのスキルは参入障壁を高めるだけでなく、データサイエンティストが予測モデル(predictive models)の構築や因果関係(casuality)の測定、データ内のパターン発見を可能にしました。この中で最も報酬が高かったのは予測モデリングです。企業は後にその業務を切り離し、新しい肩書きである機械学習エンジニア(Machine Learning Engineer、「MLE」)3 に割り当てました。
長年にわたり、AI を実装するとは、データサイエンティストと MLE をクリティカルパスに据えることを意味していました。しかし、大規模言語モデル(LLM)の登場により、これがデフォルトではなくなりました。ファウンデーション・モデル API(Foundation-model APIs)が現在、チームが AI を独自に統合することを可能にしています。
このプロセスから外されたことは、私が知るデータサイエンティストや MLE たちを動揺させました。もし企業が AI の実装のためにあなたを必要としなくなったなら、その仕事に以前と同じような将来性があるのか疑問を抱くのは当然です。人々が自分自身に語るより厳しい物語はこうです。「ファウンデーション・モデルの研究所で事前学習(pretraining)を行っていない限り、あなたは最も重要な現場にはいない」と。
⟦CODE_0⟧
⟦CODE_1⟧
私は逆の視点から読みました。モデルのトレーニングは仕事の大部分ではありません。実際の業務の大半は、AI が未見のデータにどの程度一般化するかをテストするための実験設計、確率的システムのデバッグ、そして適切な指標の設計です。LLM を API 経由で呼び出すだけでは、こうした作業がなくなるわけではありません。
私はこの主張を単なる断言ではなく具体例をもって示すため、最近 PyAI Conf で「データサイエンティストの復讐」と題した講演を行いました。以下は、そのプレゼンテーションに注釈を加えたバージョンです。
ハルネスこそがデータサイエンスである
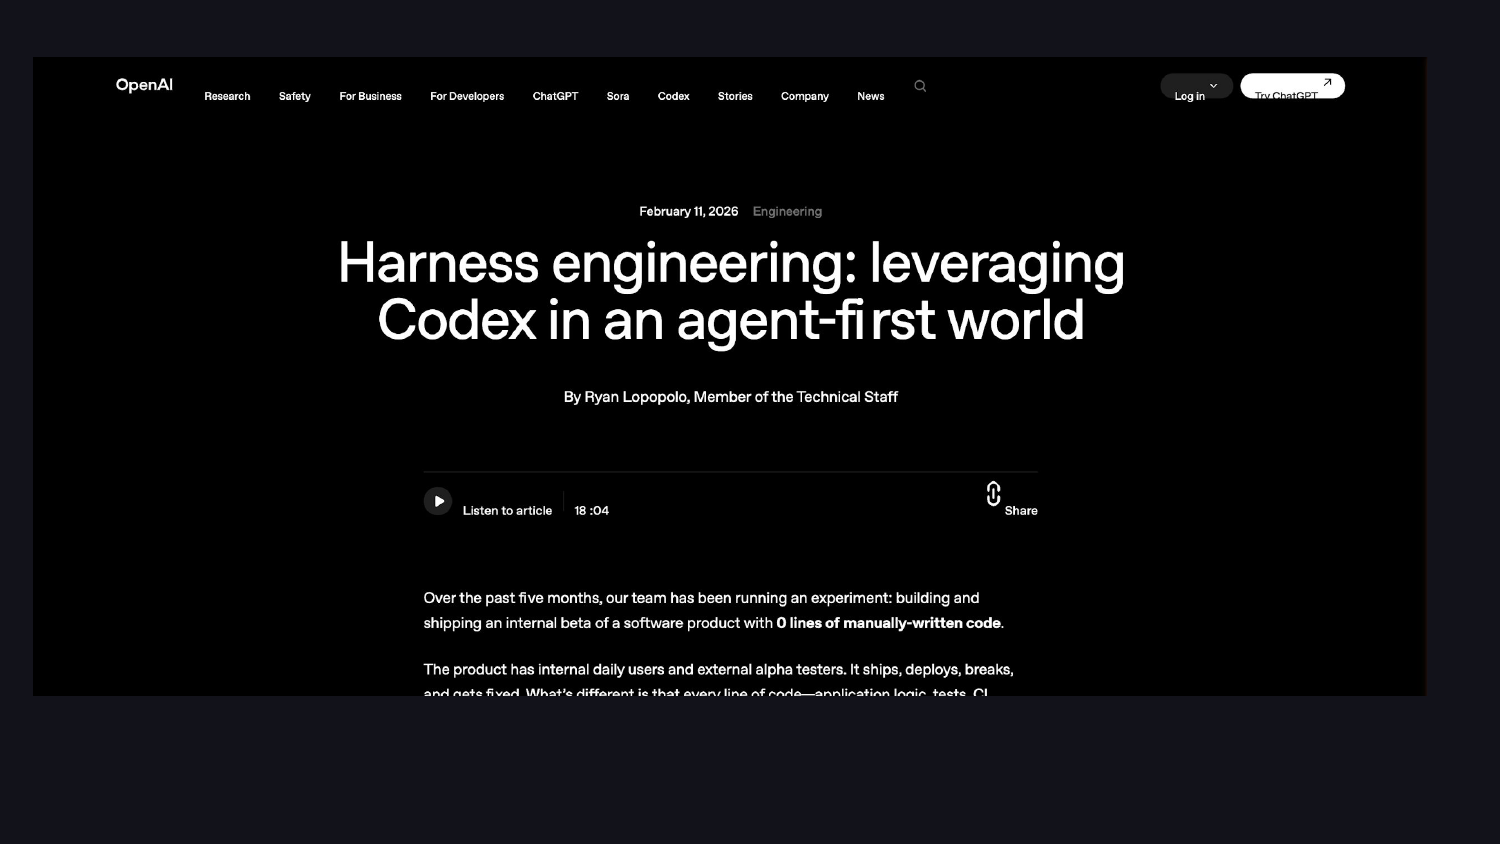
OpenAI は「ハルネスエンジニアリング」に関するブログ記事を公開しており、これは読むことをお勧めします。彼らは、Codex がソフトウェアプロジェクトにおいて数ヶ月にわたり自律的に動作し、テストと仕様によって制約されたコードをエージェントが開発する様子を説明しています。
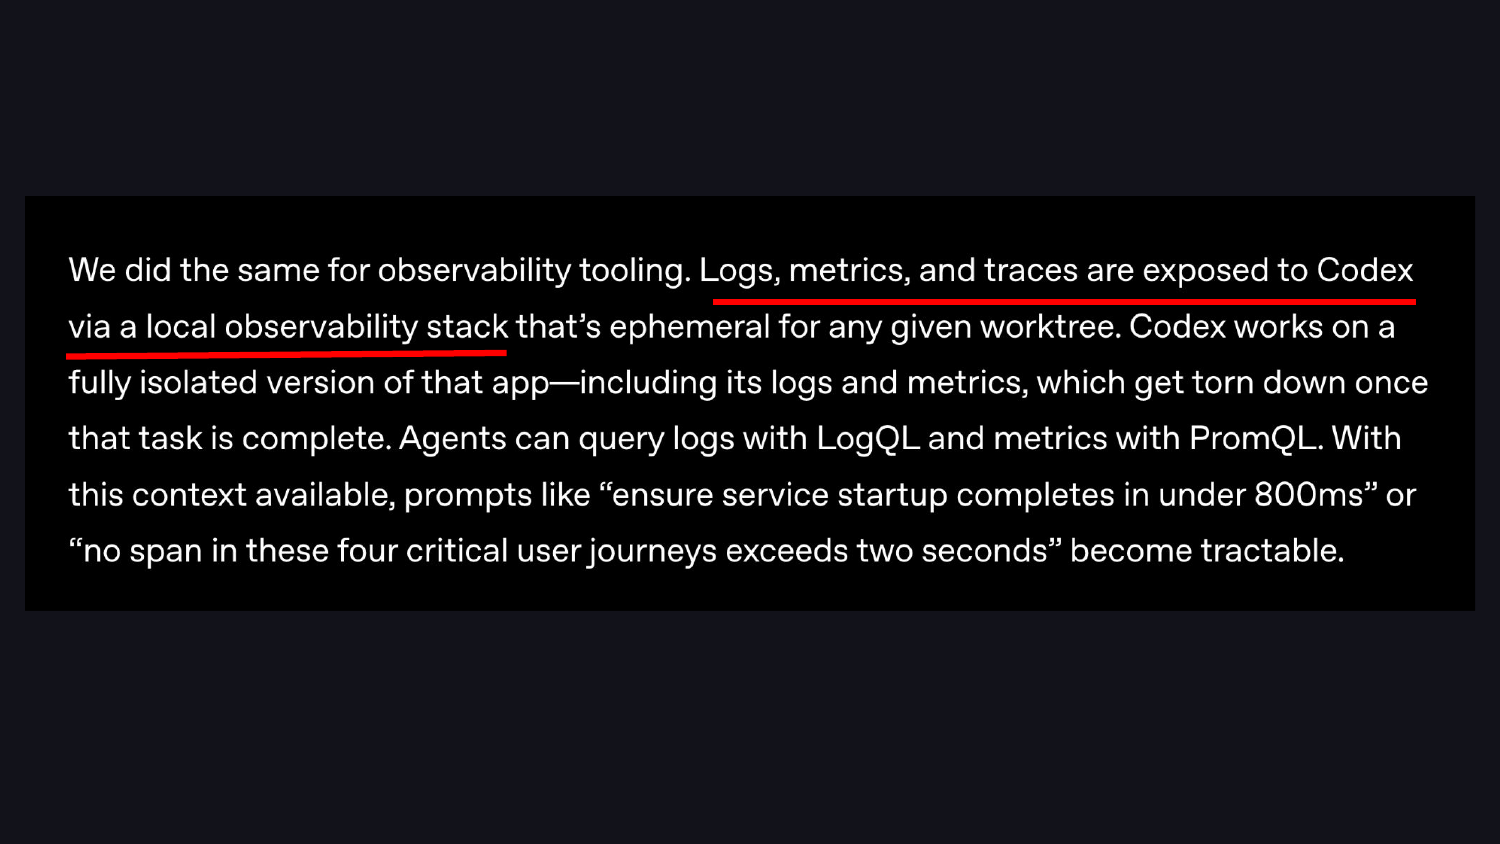
そのブログ記事には見落としがちな重要な詳細があります。ハルネスには観測スタック(observability stack)が含まれており、ログ、メトリクス、トレースがエージェントに公開されています。これにより、エージェントは自分が軌道から外れたことを認識できます。テストと仕様に加えて、メトリクスが存在します。これがシステムの重要な構成要素です。
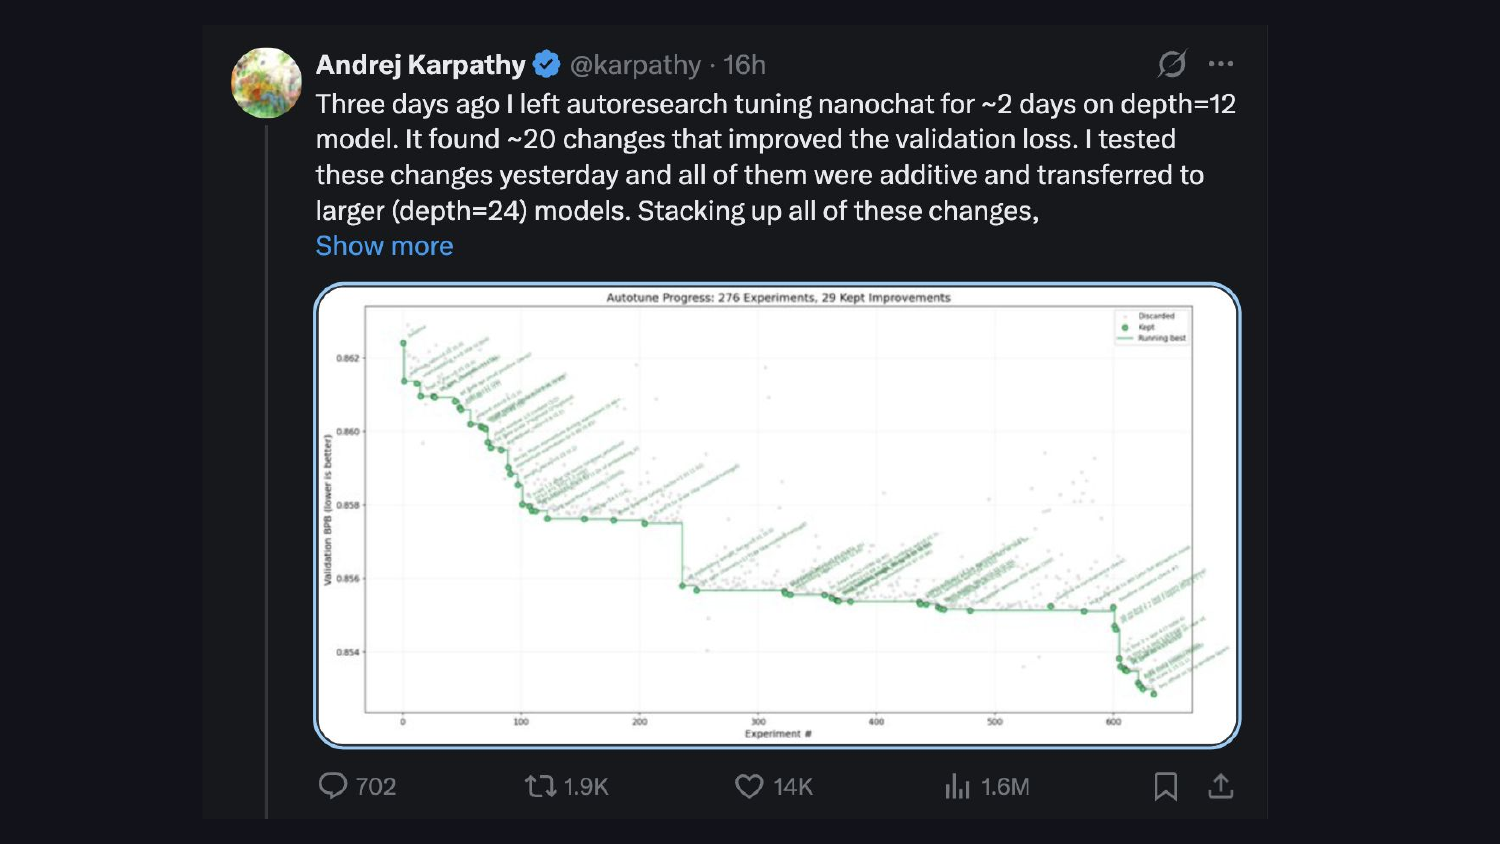
Andrej Karpathy の自動研究プロジェクトも同様のパターンを示しています:モデルは検証損失(validation loss)指標に対して反復的に最適化を行います。同じ考え方で、異なるハルネスが用いられています。
私が皆さんに納得していただきたいのは、ハルネスの大部分がデータサイエンスであるという点です。
一歩引いて、現在の状況を振り返ってみましょう。
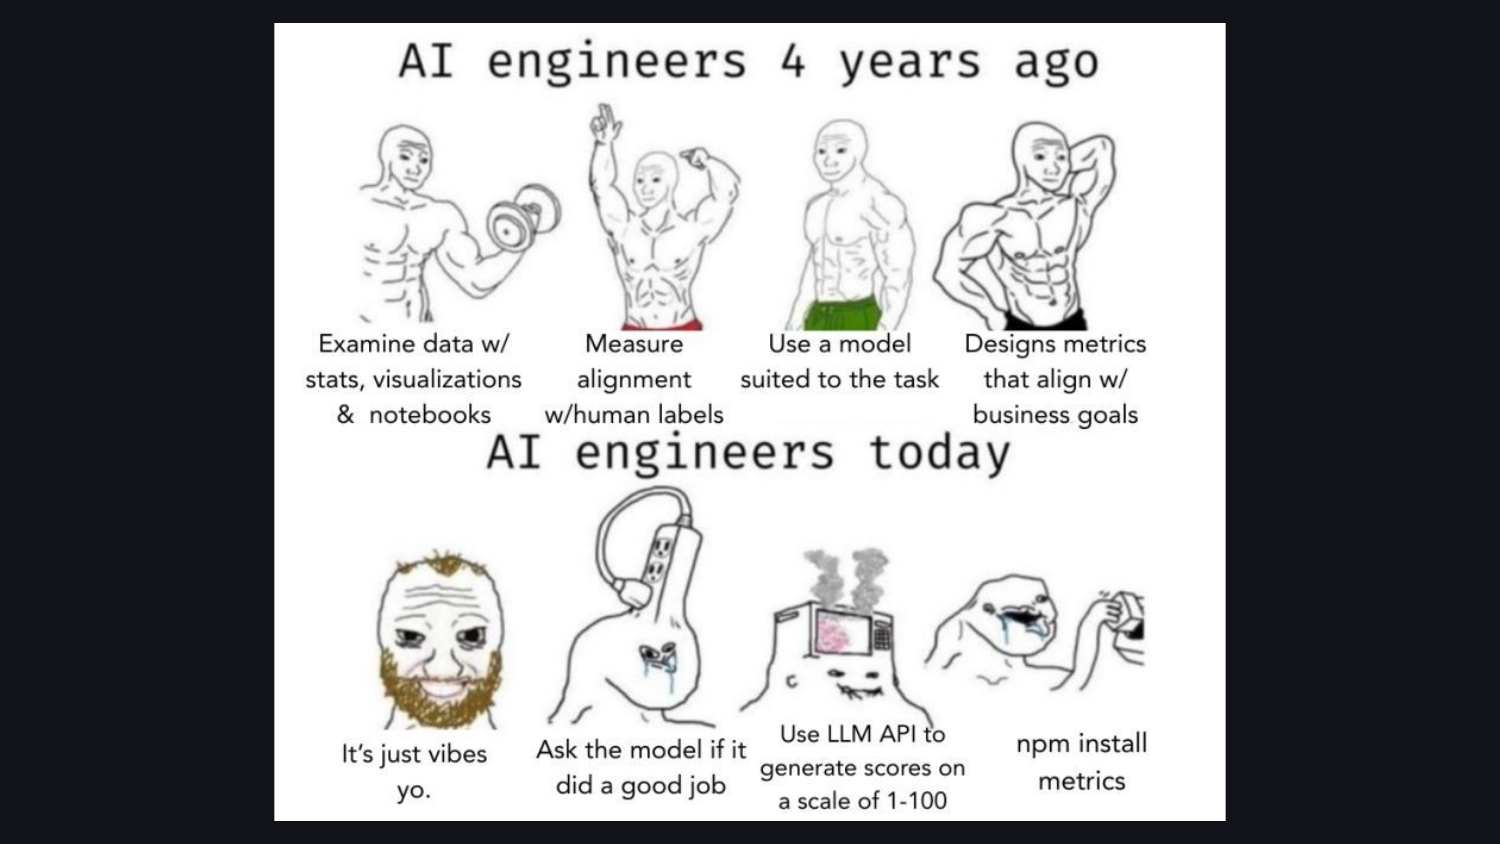
数年前は、実践者はデータを時間をかけて精査し、ラベルの整合性を確認し、指標を設計していました。しかし今日では、「雰囲気」に頼り、モデルがうまくできたかどうかを尋ね、データも確認せずに市販の評価用ライブラリを利用しています。
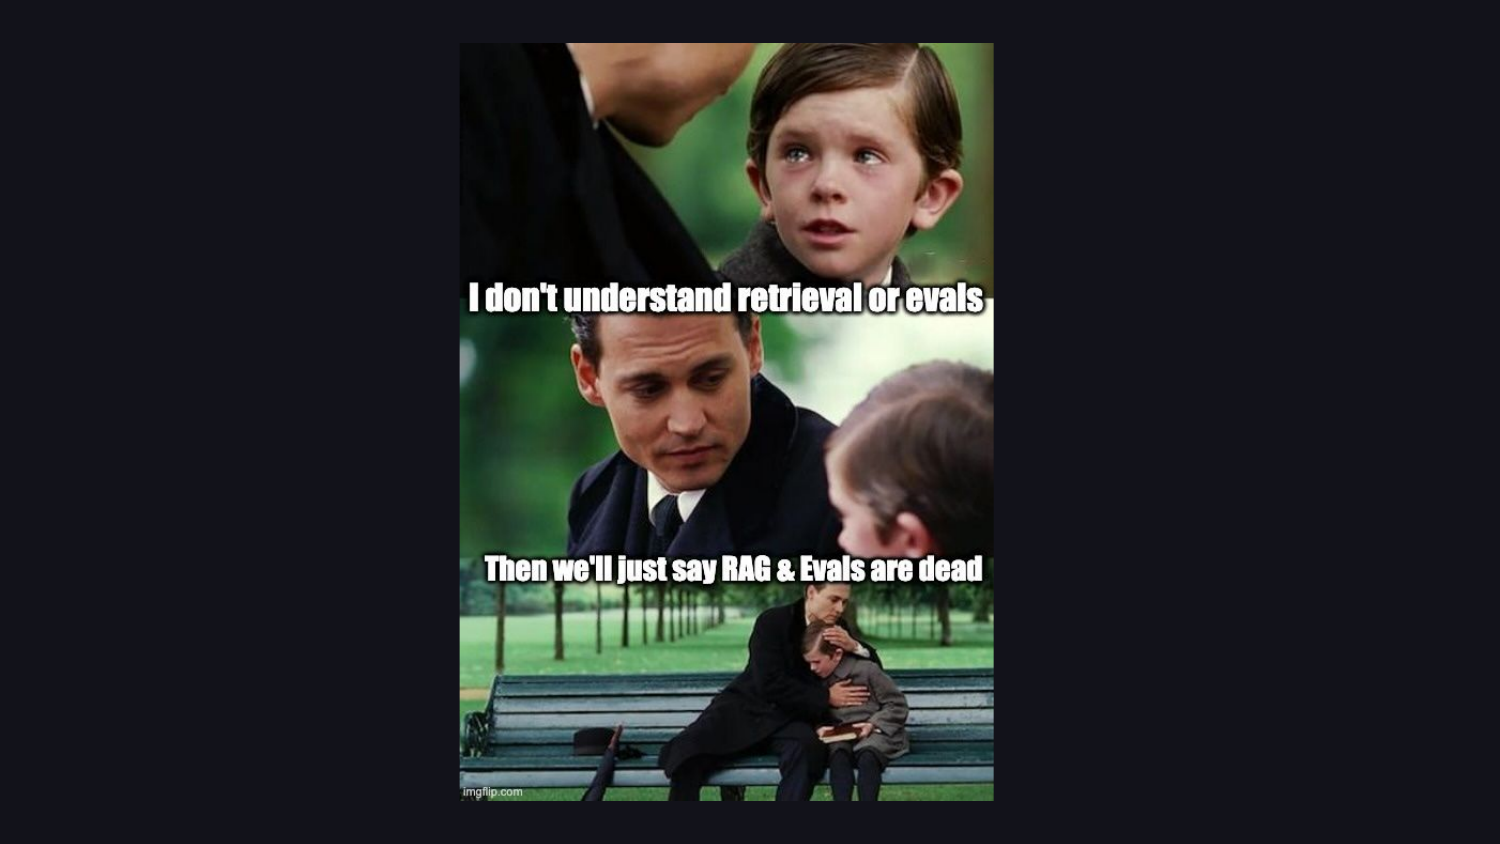
これは特に検索(retrieval)と評価(evals)の周辺で顕著に現れます。データに関する背景知識がないエンジニアは、理解できないものを恐れます。「RAG は死んだ」「評価は死んだ」と主張しながらも、実際にはそれらの概念に依存するシステムを構築しています。
この投稿の後半では、私が繰り返し目にする5つの評価(eval)の落とし穴と、データサイエンティストがそれぞれのケースでどのように異なるアプローチを取るのかについて解説します。
汎用的な指標
最初の落とし穴は、汎用的な指標です。
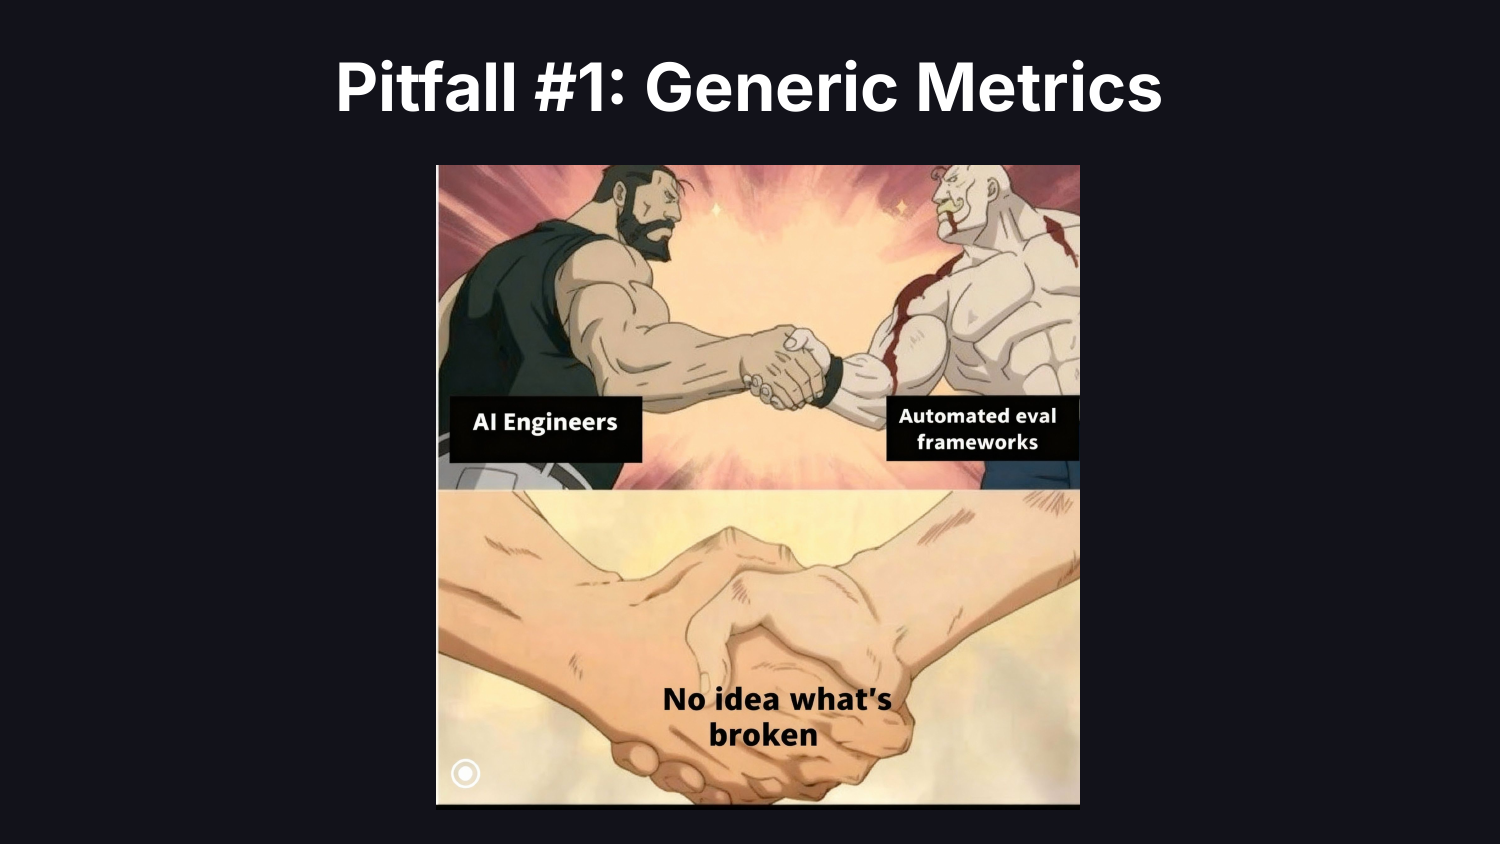
評価フレームワークに飛びつき、その指標をそのまま利用したくなるものです。しかし問題点は、実際に何が壊れているのか全くわからないことです。多くのチームが、有用性スコア、一貫性スコア、ハルシネーション(幻覚)スコアなどを含むダッシュボードを設置します。これらは理にかなって聞こえますが、アプリケーションの失敗を診断するには汎用すぎて役に立ちません。
データサイエンティストは、市販の指標をそのまま採用したりしません。彼らはデータを探索し、トレースを確認し、「ここで実際に何が壊れているのか?」と問いかけ、測定するべき最も価値の高いものを特定します。測定すべきことは無限にあります。仮説を立てて反復することが必要です。
この罠に対する最良の治療法は、データを見ることです。
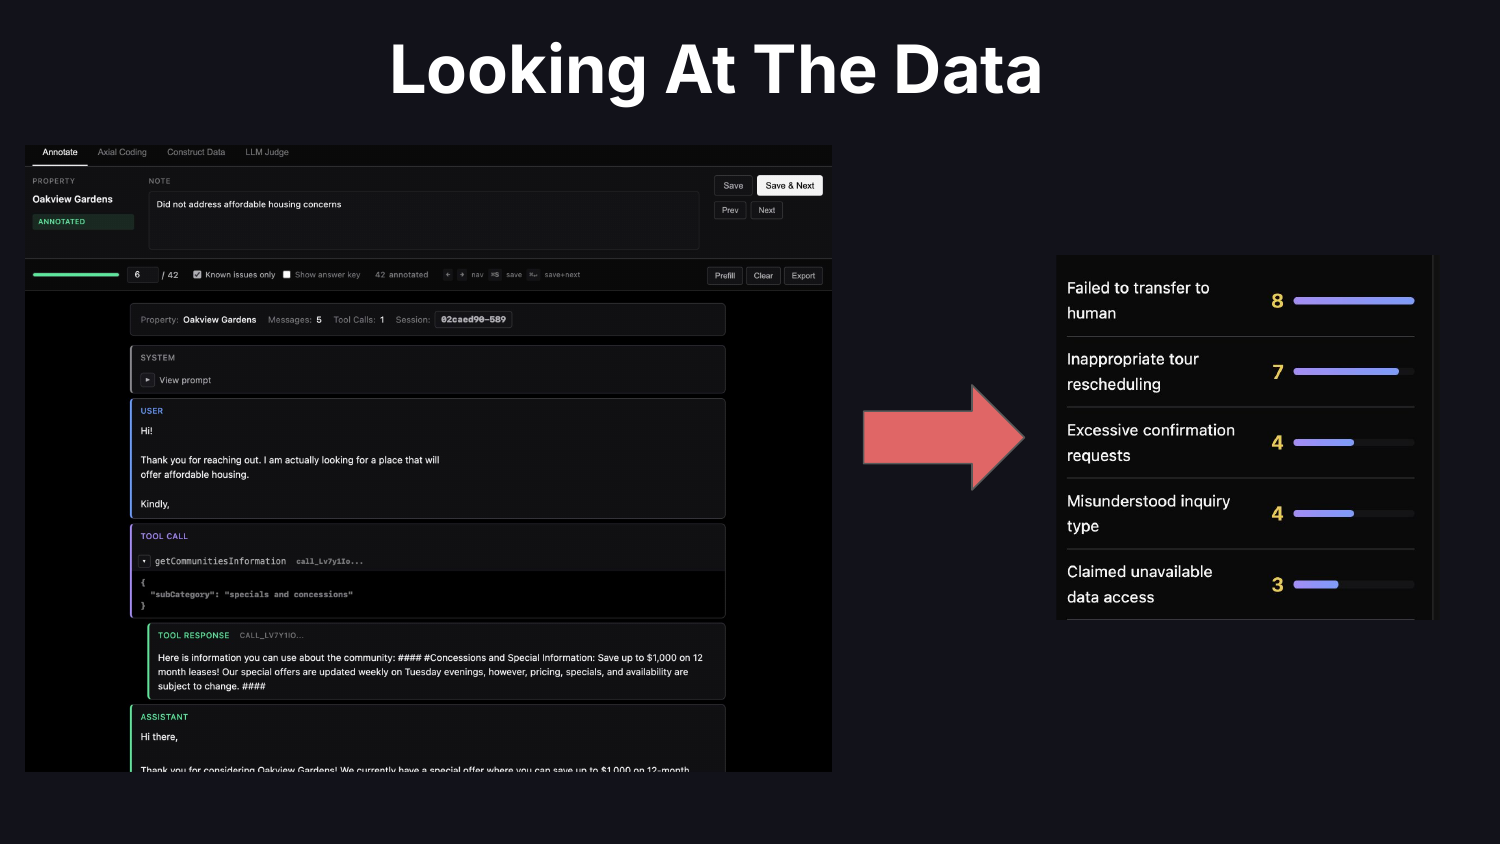
実際には「データを見る」とは何を意味するのでしょうか?それはトレースを読むことを意味します。ドメイン特有の癖に合わせて摩擦を取り除き、表示をカスタマイズできるよう、独自のトレーサービューアーをコードで実装してください。発見した問題についてはメモを取ってください。エラー分析を行い、失敗を分類し、何を優先すべきかを特定し、何に取り組むべきかを決断します。
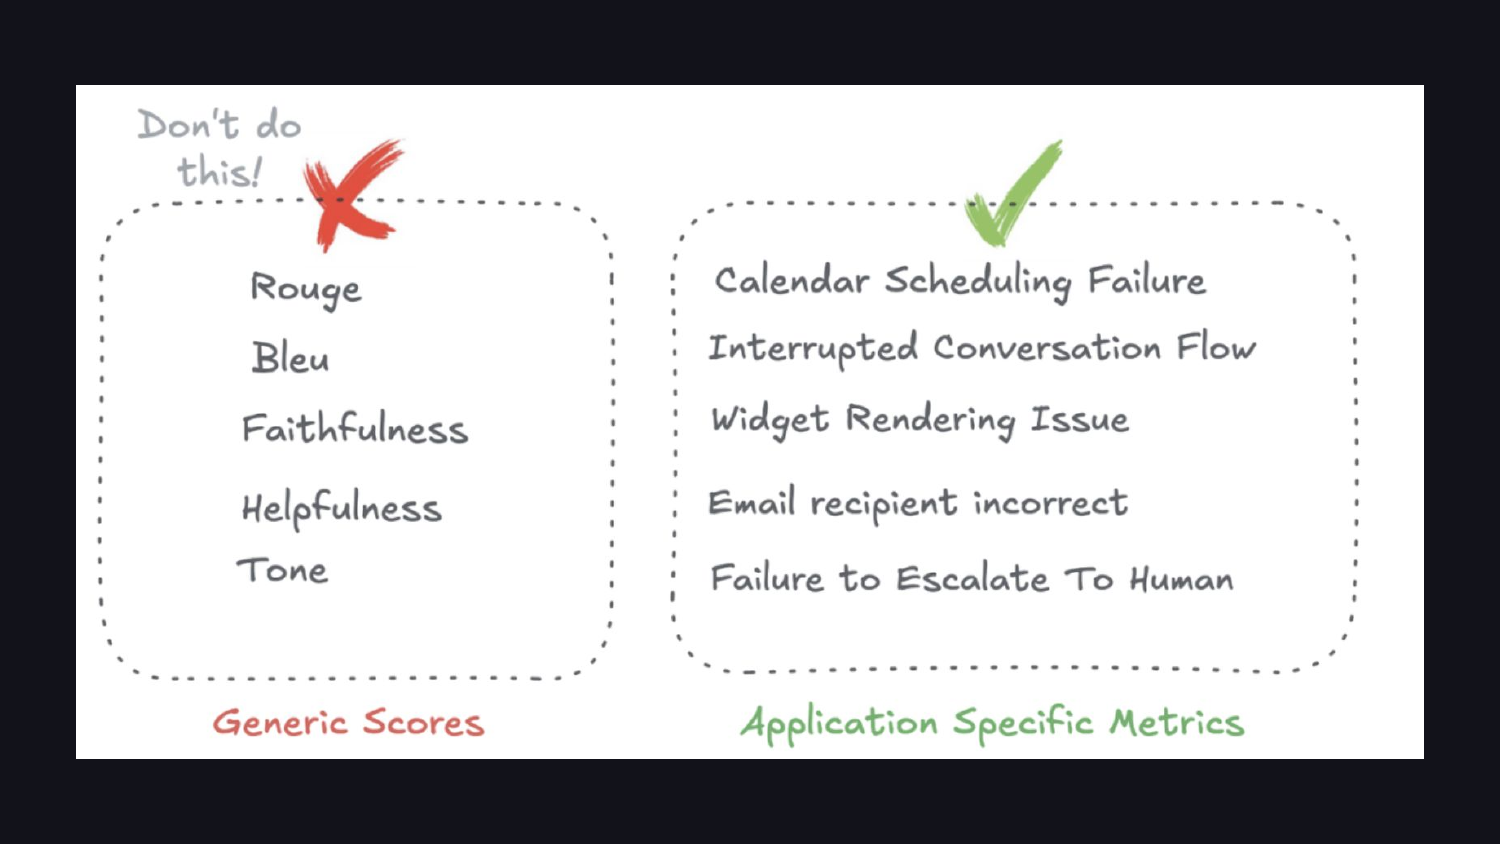
データを見ると、最終的にはアプリケーション固有の指標へと向かって進んでいきます。ROUGE や BLEU といった市販の類似度指標は、LLM(大規模言語モデル)の出力にはほとんど適合しません。重要となる指標とは、「カレンダースケジュール失敗」や「人間へのエスカレーション失敗」のようなものです。

この記事から一つだけ覚えておくべきことは、データを見ることです。どのように見るかは別の問題であり、練習が必要です。これはあなたが取り組める中で最も高い ROI(投資対効果)をもたらす活動ですが、しばしば省略されてしまいます。
検証されていない判事
2 つ目の落とし穴は、検証されていない審査員です。多くのチームは、AI が機能しているかどうかを判断するために LLM を審査員として使用しています。しかし、「どうやって審査員を信頼すればよいか」という問いに対して、誰も良い答えを持っていないことがほとんどです。
デフォルトの手法は、LLM に出力を評価尺度で評価させ、その数値を使用することです。データサイエンティストであれば、審査員を分類器(classifier)として扱います。ブラックボックスが予測結果を返してくる場合、どうやってそれを信頼すればよいでしょうか?人間によるラベル付けを行い、データを訓練用・検証用・テスト用に分割し、分類器が信頼できるかどうかを測定します。
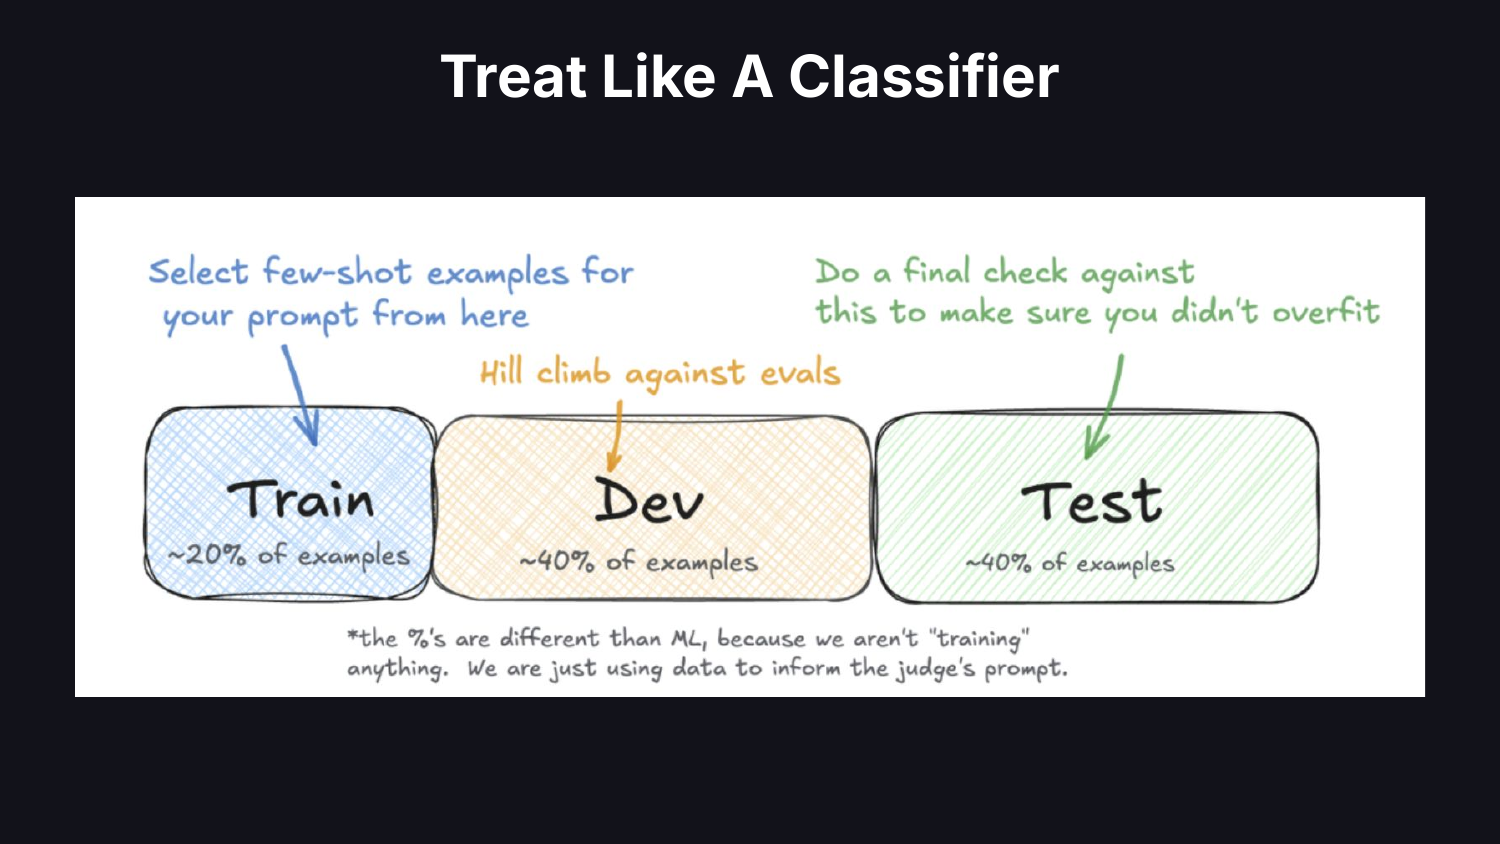
トレーニングセットから少数ショット(few-shot)の例を取得します。検証セットに対して審査員のプロンプトをヒルクライミング(hill-climbing)で最適化し、過学習していないことを確認するためにテストセットは別途確保しておきます。機械学習の経験があればこれは退屈な作業に思えるかもしれませんが、実際には誰もこれを行っていません。分類器の検証という手法は、現代の AI において失われつつある芸術となっています。
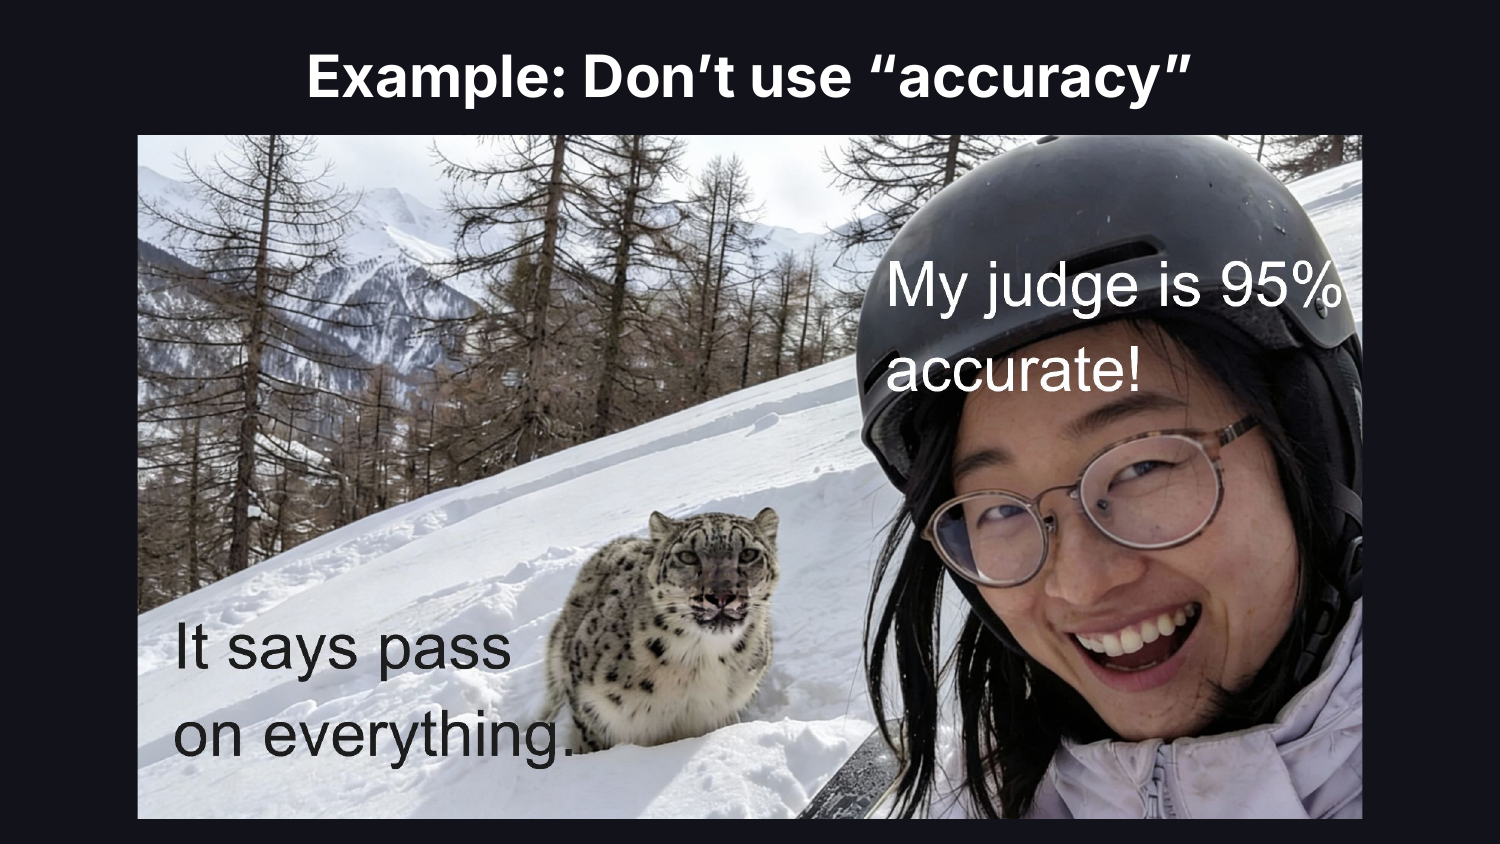
結果を報告する際も、審査員を分類器として扱うべきです。私が訪れるあらゆる場所で精度(accuracy)が報告されていますが、失敗モードが 5% の頻度で発生する場合、精度はシステムの真のパフォーマンスを隠してしまいます。適合率(precision)と再現率(recall)を使用すべきです。
悪い実験設計
3 つ目の落とし穴は実験設計です。これには多くの側面があります。その中で最も頻繁に現れる 2 つを紹介します。
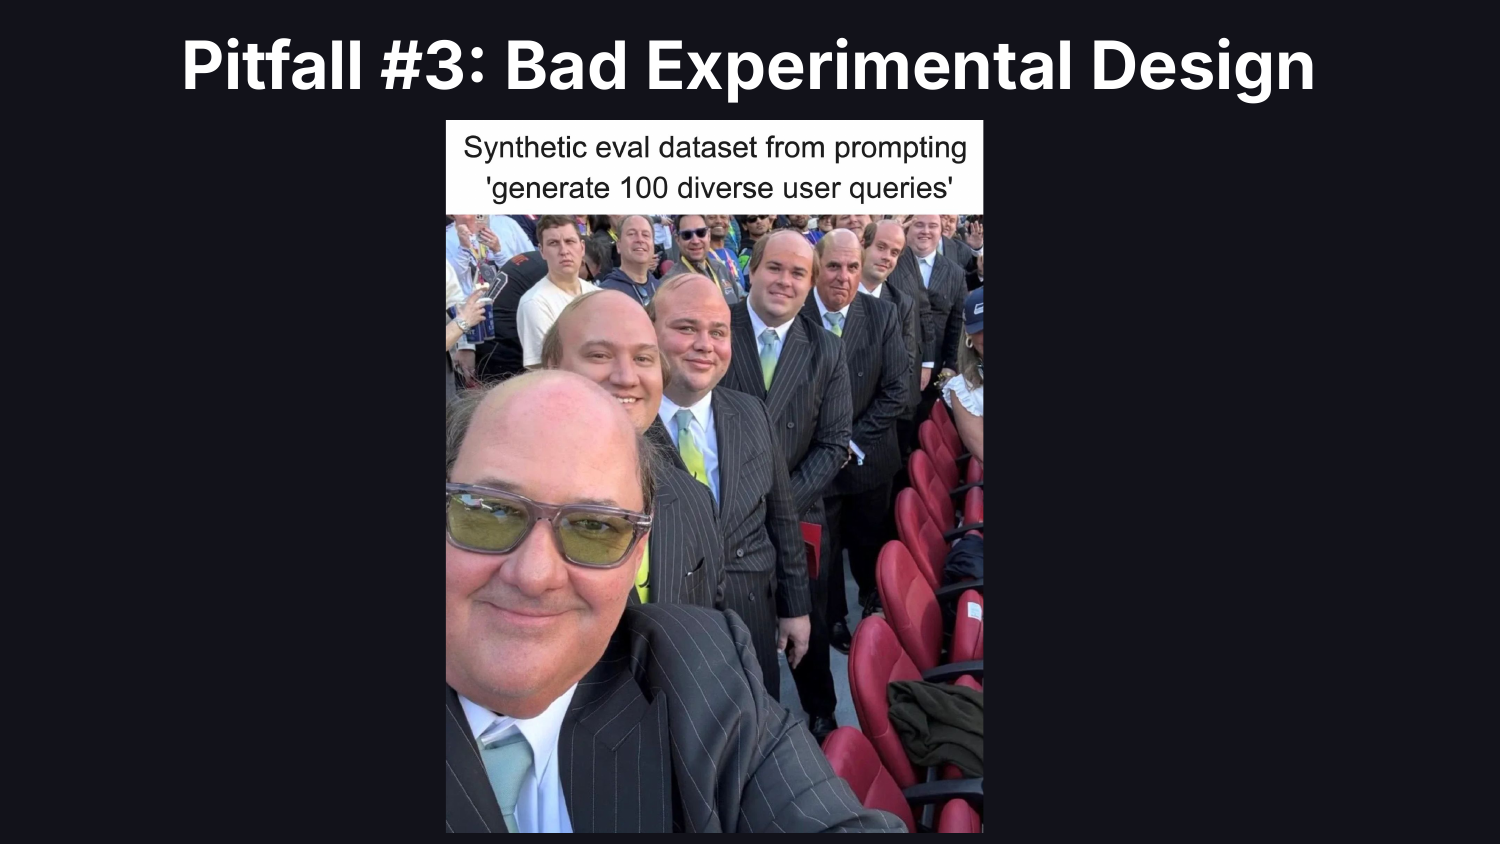
まず一つ目はテストセットの構築です。多くのチームは、LLM に「テストクエリを 50 個生成して」とプロンプトを入力することで合成データを生成しています。しかし得られるのは一般的で代表性に欠けるデータです。データサイエンティストであれば、まず実稼働中の実際のデータを分析し、仮説を立ててどの次元が重要かを特定した上で、その次元に沿って合成例を生成します。
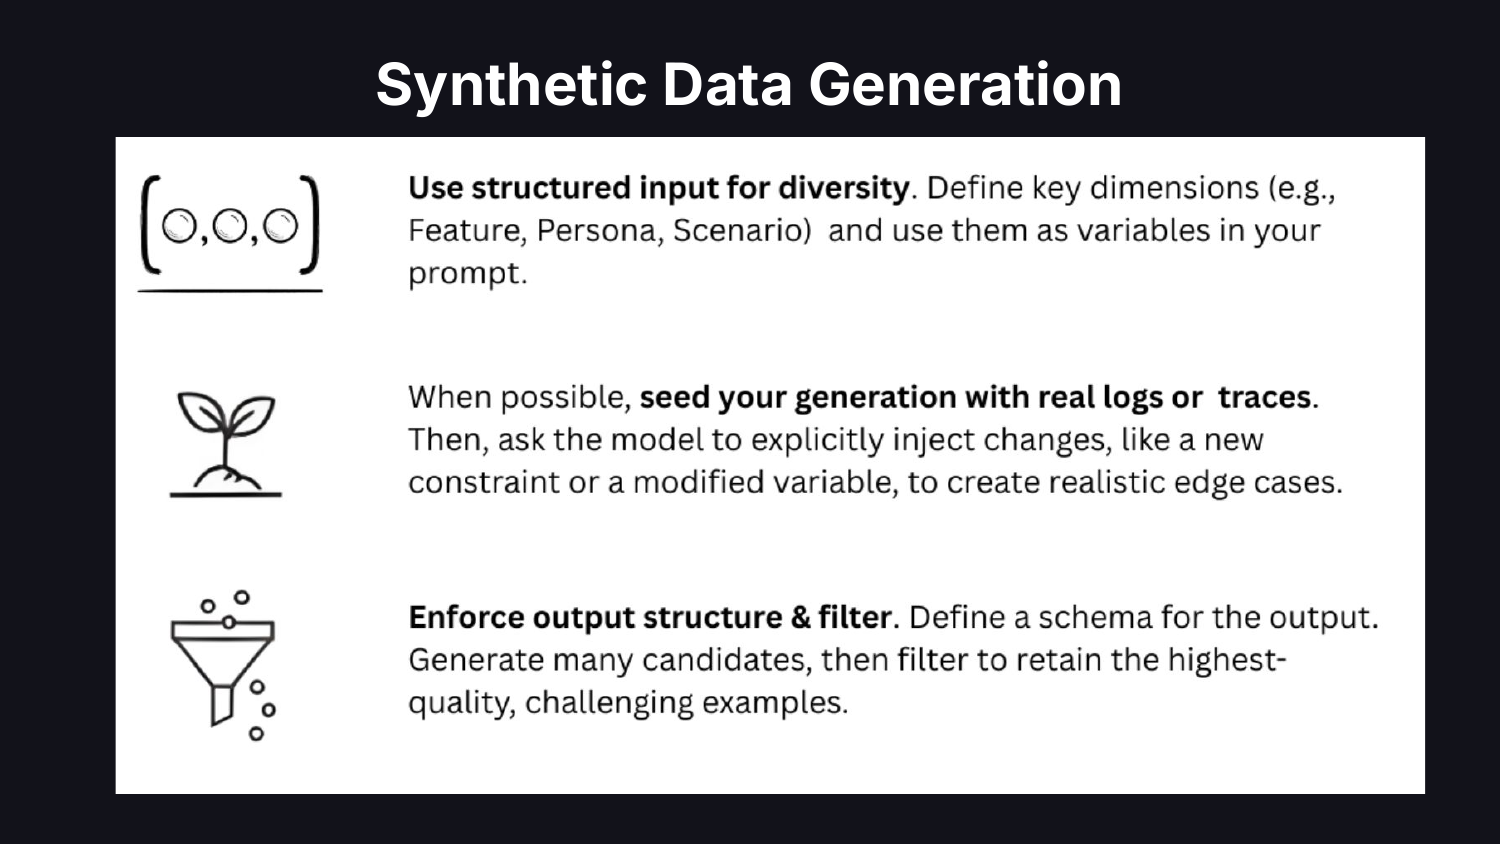
合成データは実際のログやトレースに基づいて作成すべきです。どの次元を変化させるべきかを見極め、エッジケース(境界条件)を注入し、合成データの基礎として実データを基盤とします。
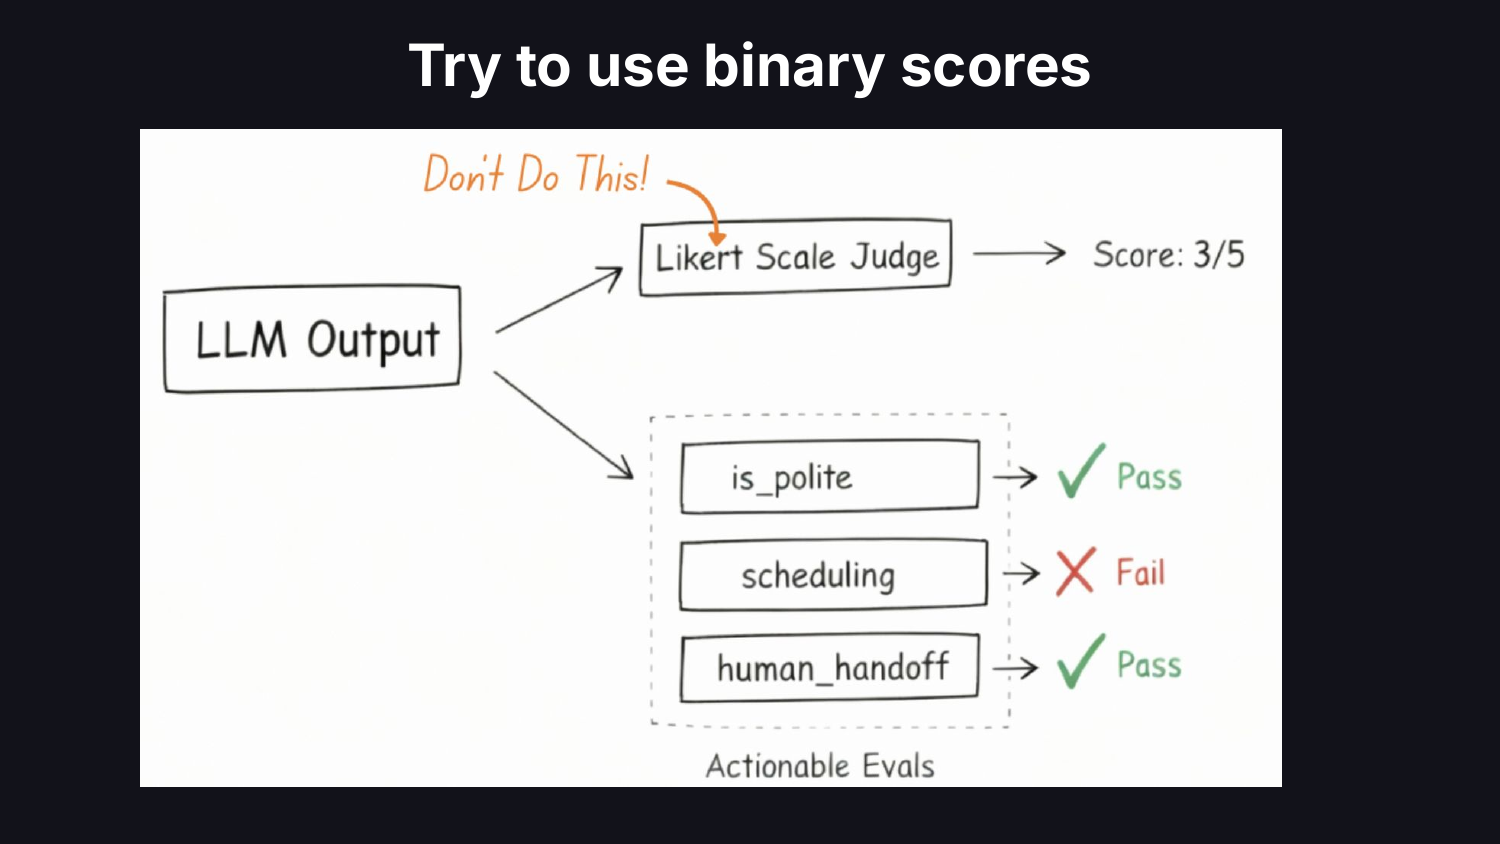
二つ目は指標設計です。チームは評価基準全体を一つの LLM 呼び出しにまとめ込み、デフォルトで 1 から 5 のリッカート尺度(Likert scale)を採用しがちです。データサイエンティストであれば複雑さを減らし、各指標を実行可能なものとし、ビジネス成果と結びつけます。主観的な尺度は、スコープ内の基準に基づくバイナリの合格/不合格に置き換えるべきです。リッカート尺度は曖昧さを隠蔽し、システムパフォーマンスに関する困難な意思決定を先送りする結果になります。
Bad Data and Labels(不正確なデータとラベル)
四つ目の落とし穴は、不正確なデータとラベルです。データサイエンティストはデータを信頼しません。ラベルも信頼しません。何もかもが疑わしく見えます。彼らは訓練によって懐疑的になるように鍛えられています。大規模な AI エンジニアリングの現場では、まだこのスキル(マッスル)が確立されていません。
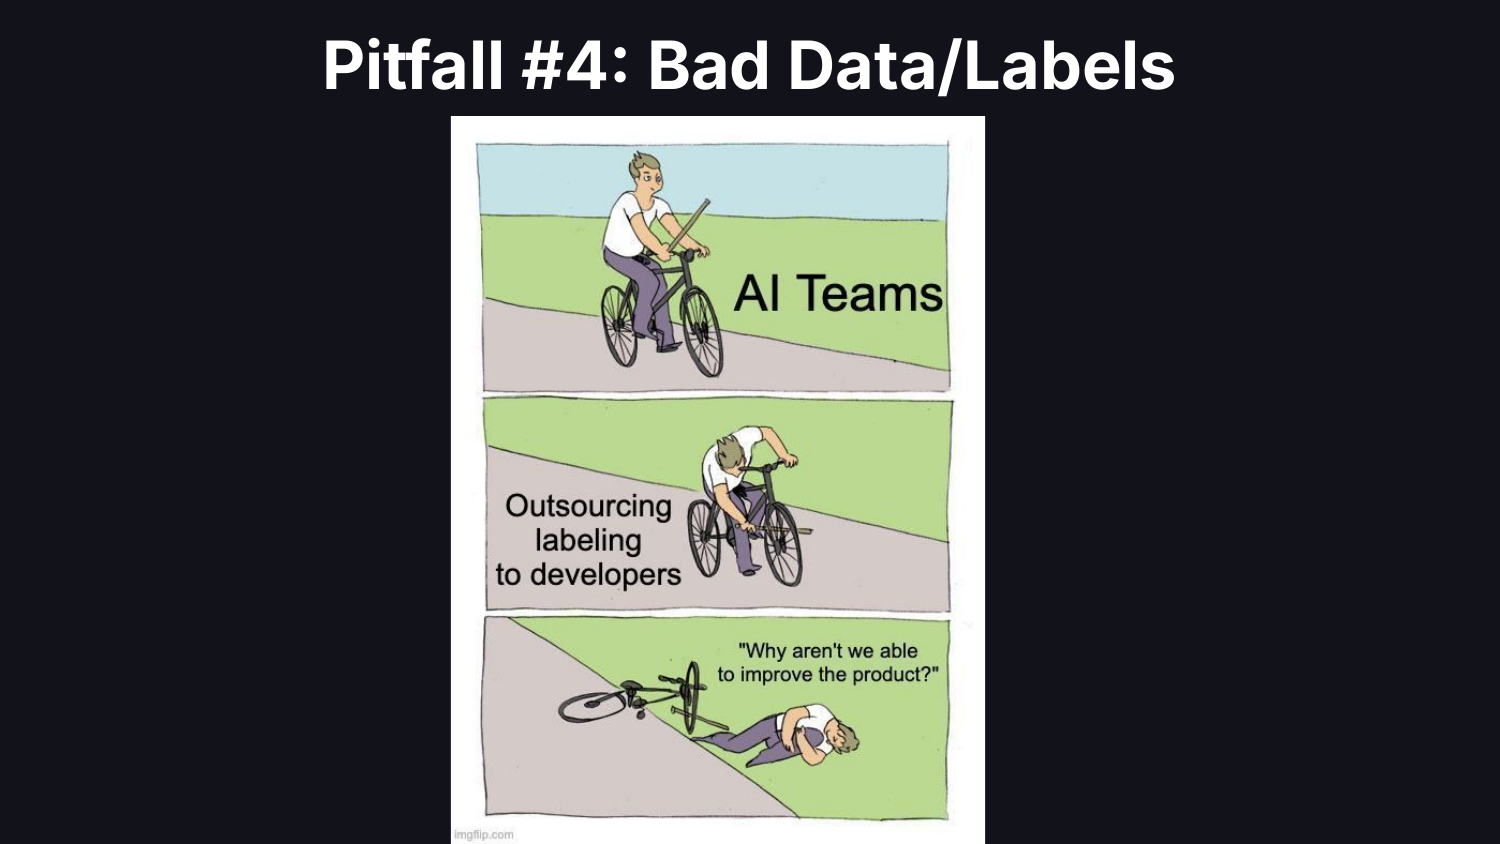
ラベリングに関しては、多くのチームがそれを他者の問題にしてしまいます。ラベリングは派手さがないため、開発チームに任せるか外部委託されてしまいがちです。しかしデータサイエンティストは、ドメインの専門家がデータをラベル付けし、ラベルに対して懐疑的であり続け、データそのものを見るべきだと主張します。
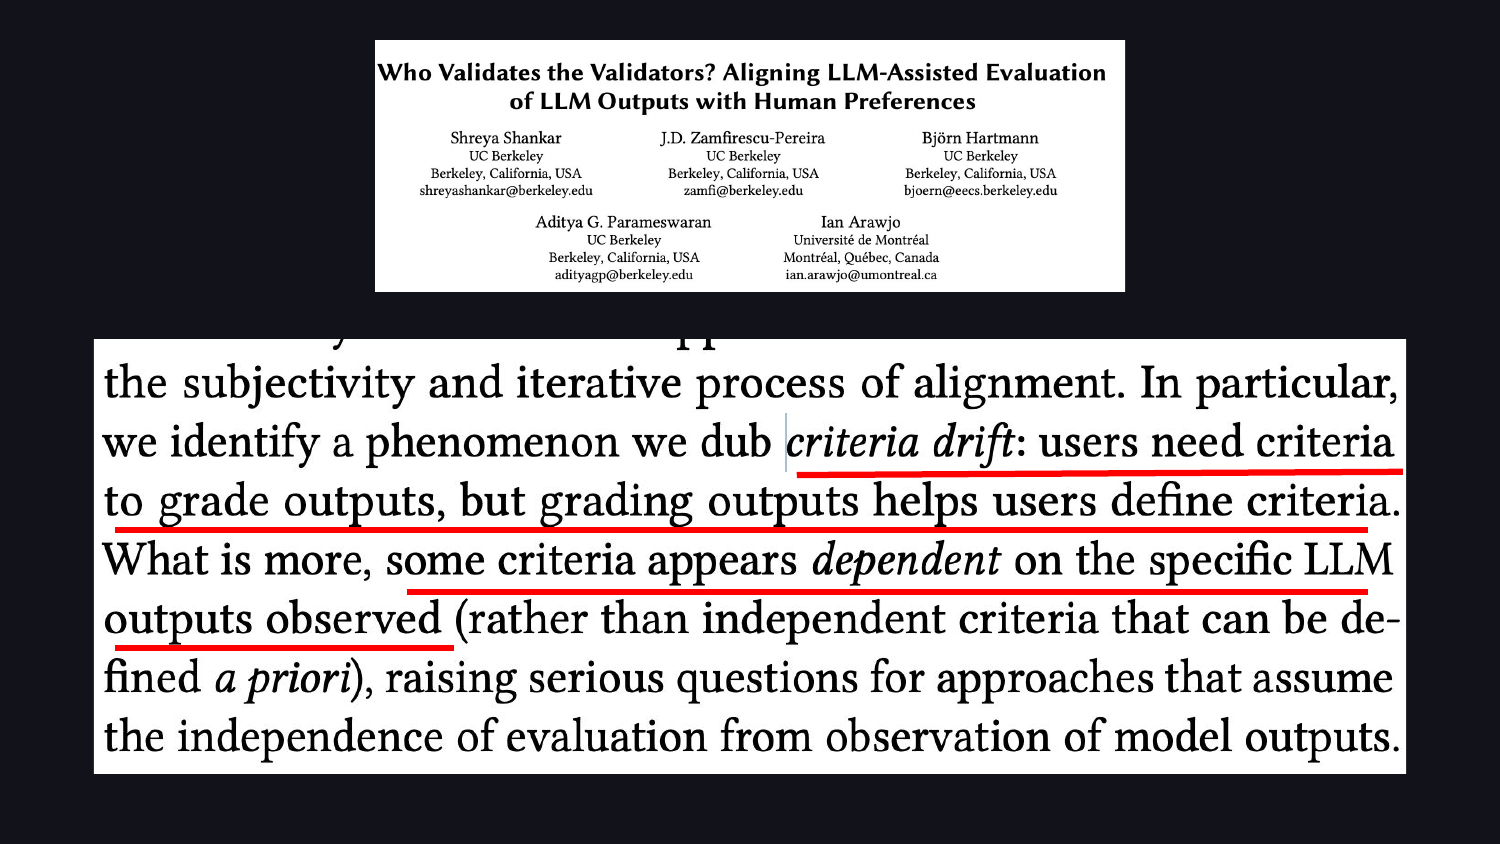
しかし、ラベリングが重要である理由は、単にラベルの品質だけではありません。データを見てみなければ、自分が何を求めているかを知ることは不可能です。「基準のドリフト(criteria drift)」という概念があり、Shreya Shankar 氏らによる論文で実証されています。ユーザーは出力を評価するための基準が必要ですが、逆に出力を評価するプロセスを通じて、ユーザー自身がその基準を定義していくのです。LLM の出力を見るまで、人々は自分が何を求めているかを知りません。ラベリングのプロセス自体が、何が重要かを浮き彫りにします。
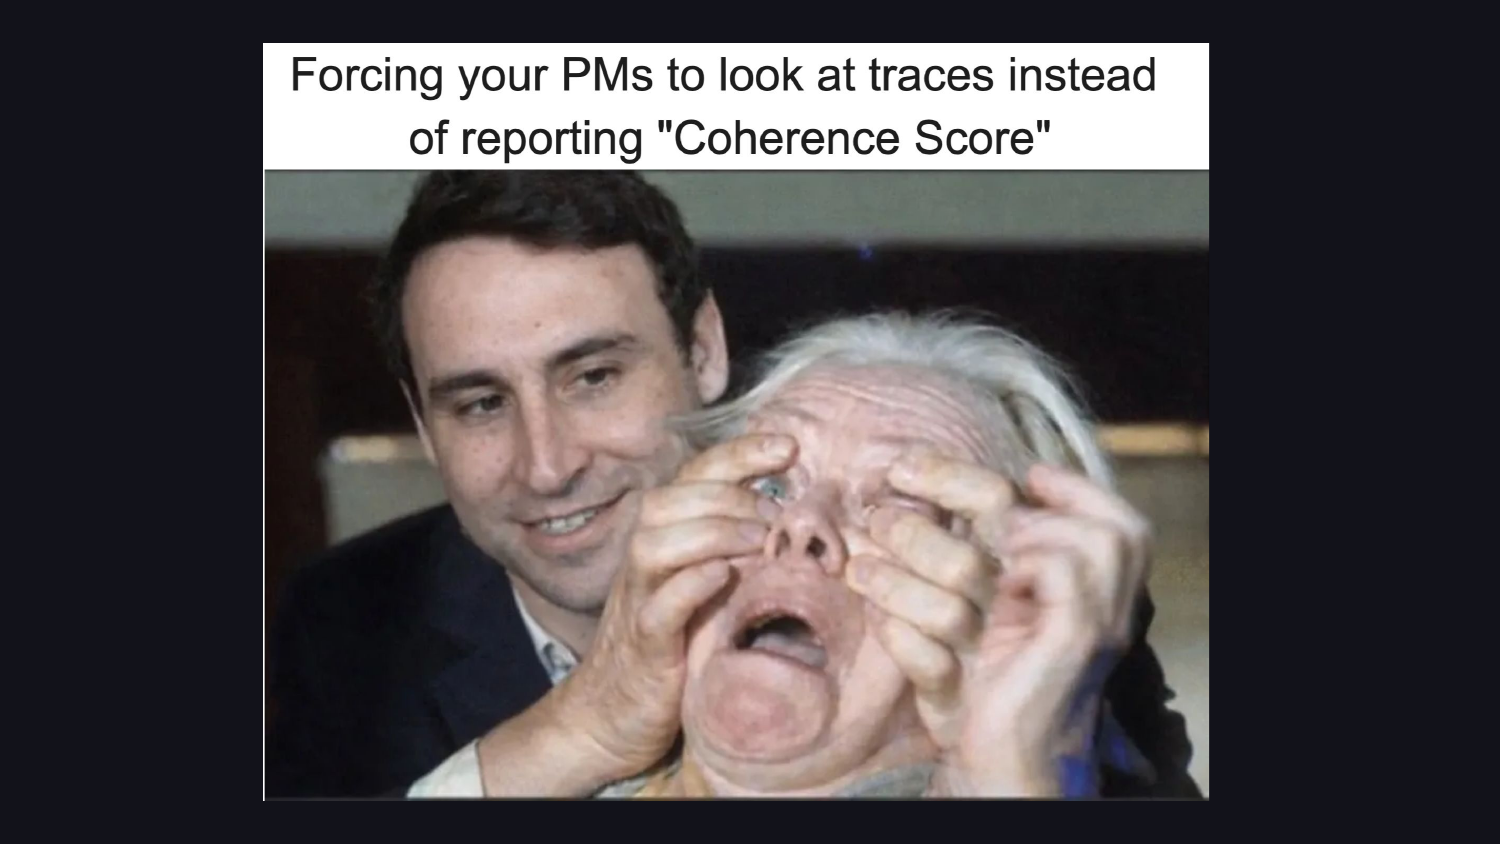
データサイエンティストはこの点を支持しています:要約スコアではなく、生データにドメインの専門家やプロダクトマネージャーを直接立ち会わせるべきです。
自動化しすぎること
5 つ目の落とし穴は、過度な自動化です。これらすべてが人手による作業であるにもかかわらず、それを自動化してしまおうとする誘惑に駆られます。
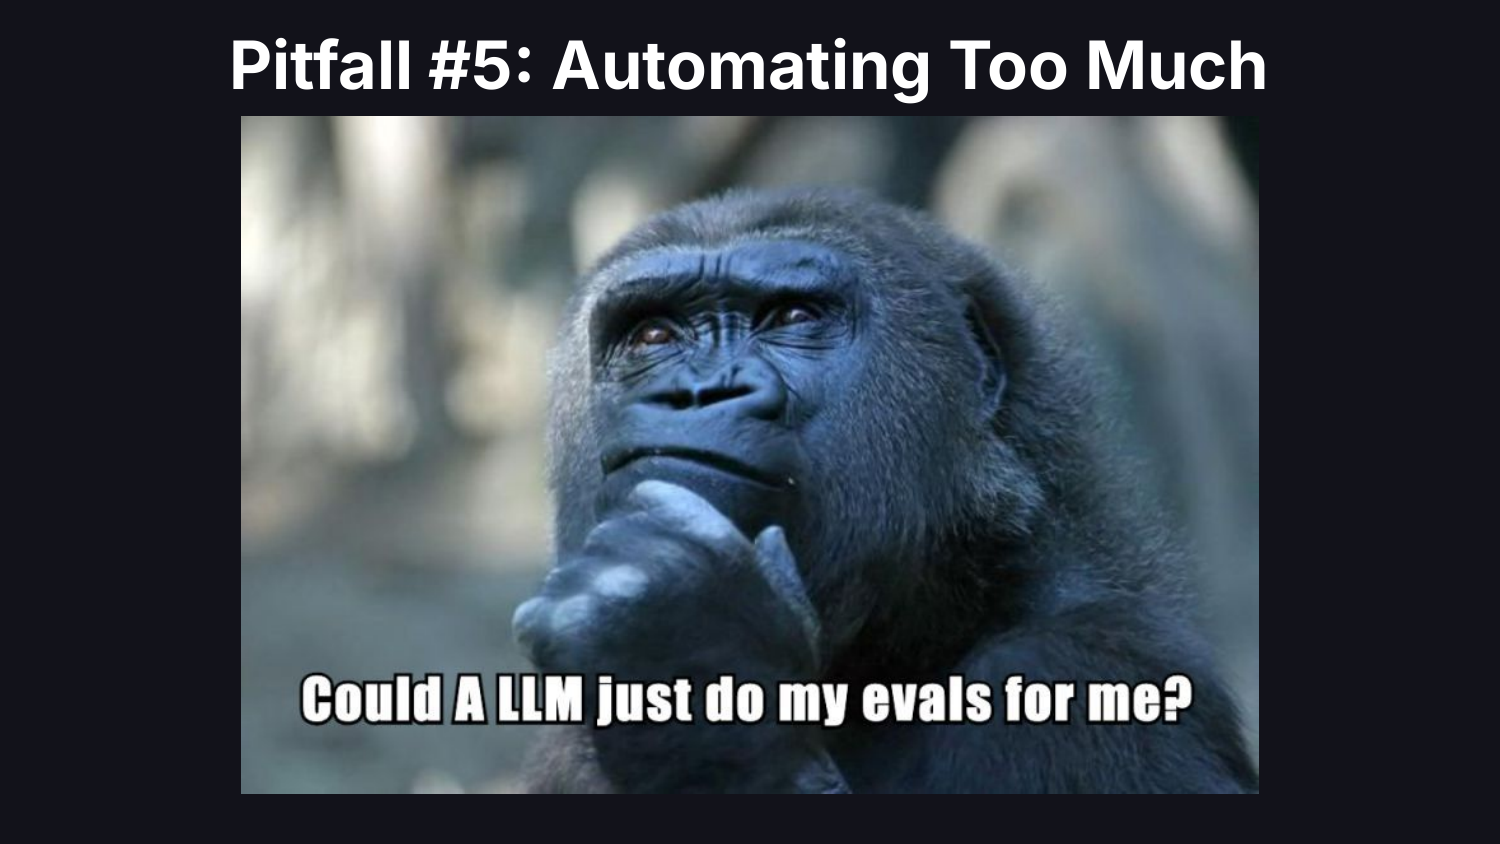
LLM はシステムを接続したり、配管(plumbing)となるコードを書いたり、評価用の定型文を生成したりするのに役立ちます。しかし、データを見てくれることはできません。先ほど議論したまさにその理由からです:出力を見るまで、自分が何を求めているか分からないのです。
その他の落とし穴
すべての落とし穴を網羅する時間はありませんでした。残りの部分については、スピードラン形式で解説します。
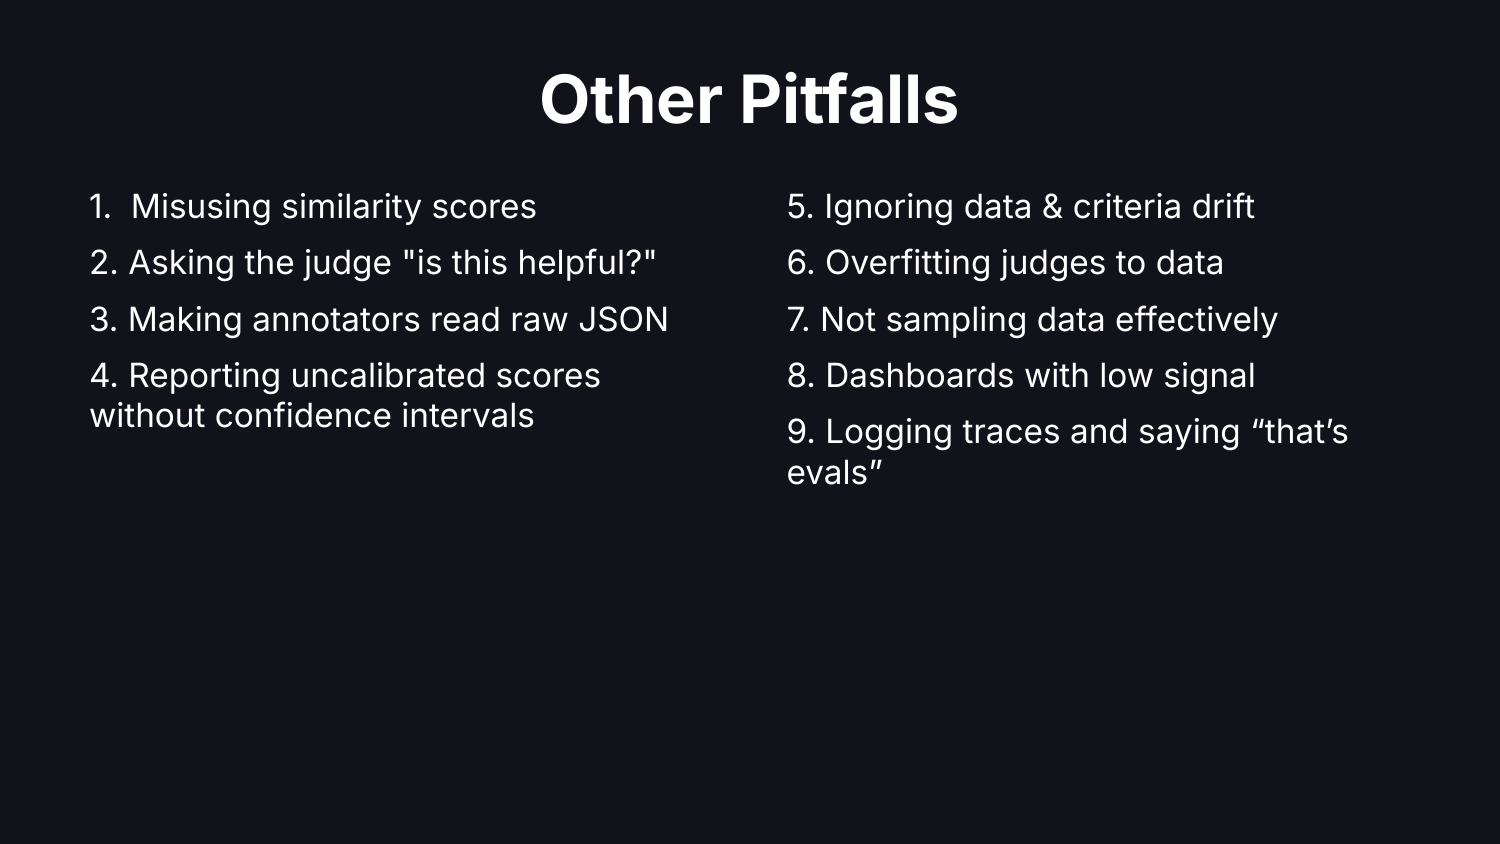
類似度スコアの誤用。「有益か?」といった曖昧な質問を評価者に投げかけること。生 JSON をアノテーターに読ませること。信頼区間なしでキャリブレーションされていないスコアを報告すること。データドリフト、過学習、不適切なサンプリング、意味をなさないダッシュボードなど。
マッピング
少し視点を変えて見ると、上記のすべての落とし穴には共通する根本原因があります。それはデータサイエンスの基礎が欠落していることです。
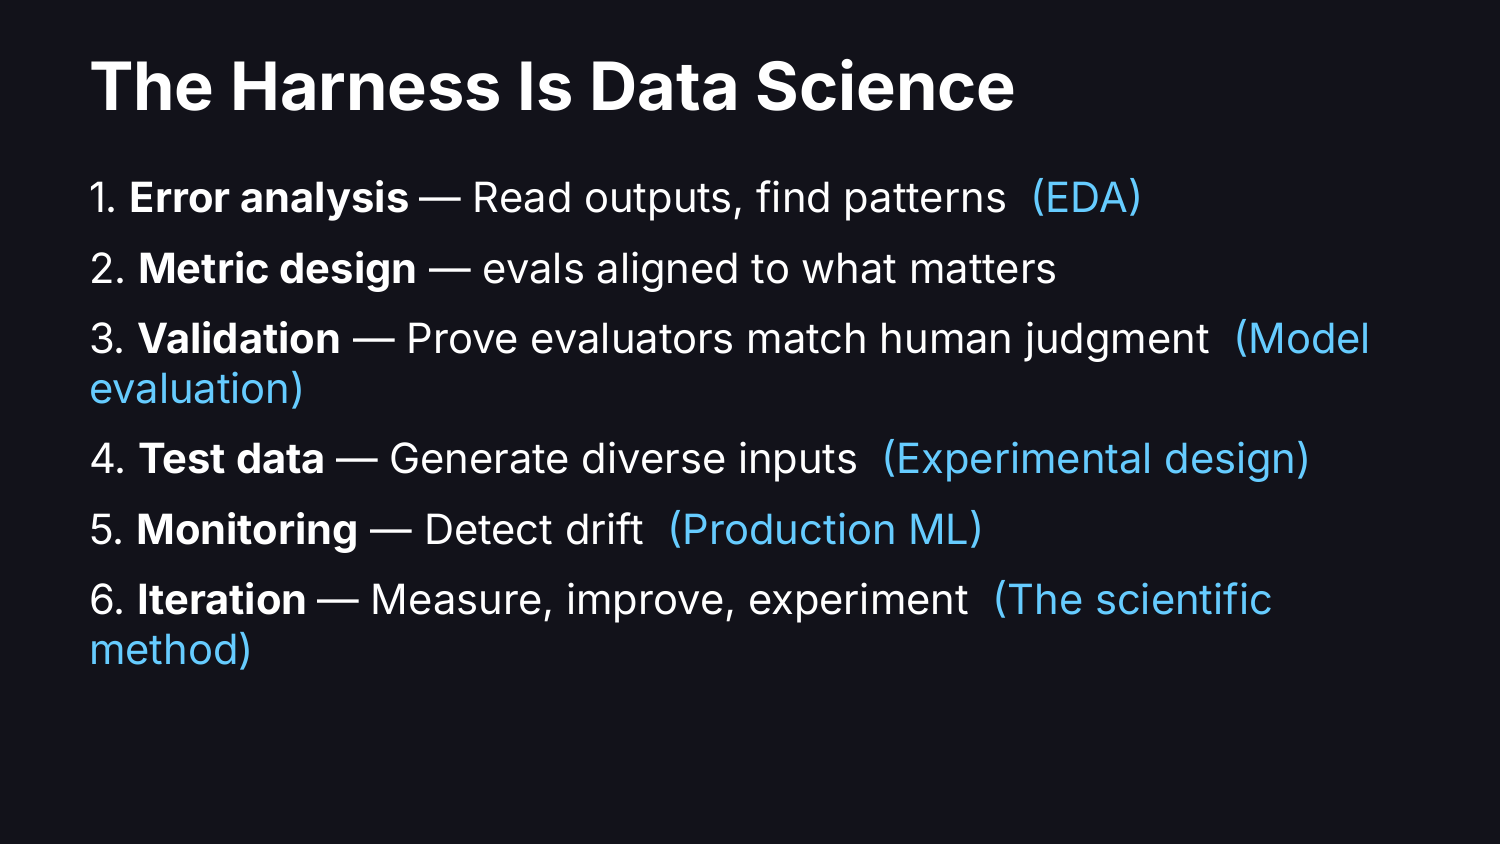
トレースを読み込み、失敗を分類することは探索的データ分析(Exploratory Data Analysis)です。LLM 評価者を人間のラベルに対して検証することはモデル評価(Model Evaluation)です。本番環境のデータから代表的なテストセットを構築することは実験計画(Experimental Design)です。ドメインエキスパートに出力をラベル付けさせることはデータ収集(Data Collection)です。製品が本番環境で機能しているかを監視することはプロダクション ML です。これらすべては新しいことではありません。名前が変わっただけで、仕事の内容自体は変わっていません。
これは Python 会議ですので:Python は依然としてデータを閲覧し、データに対処するための最良のツールセットです。
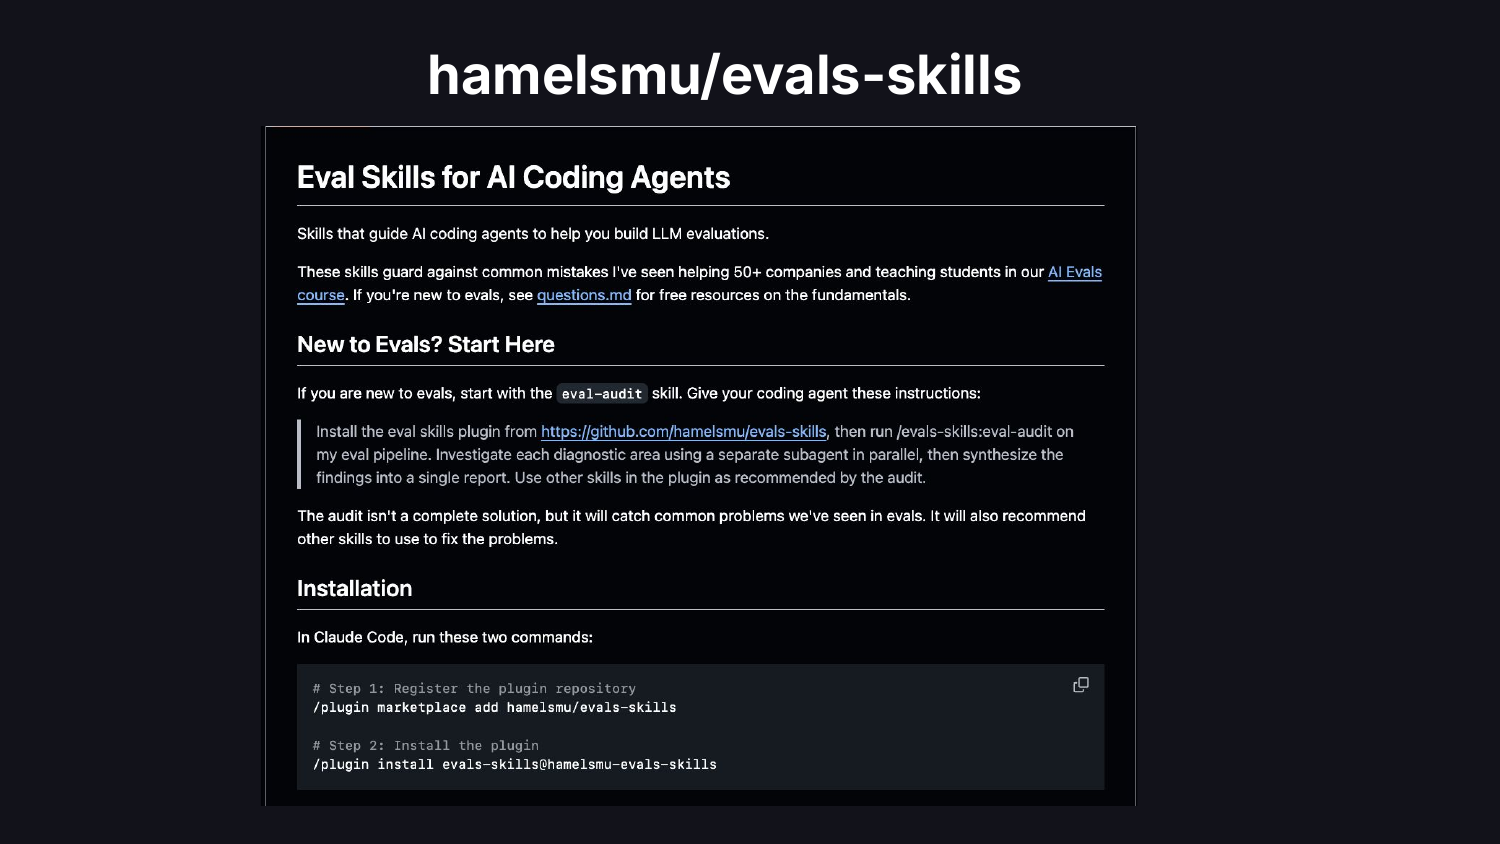
より詳細な解説を行うオープンソースプラグインを作成しました。これを評価パイプラインに指し示せば、何が間違っているか(あるいはできる限りそれを)教えてくれます。
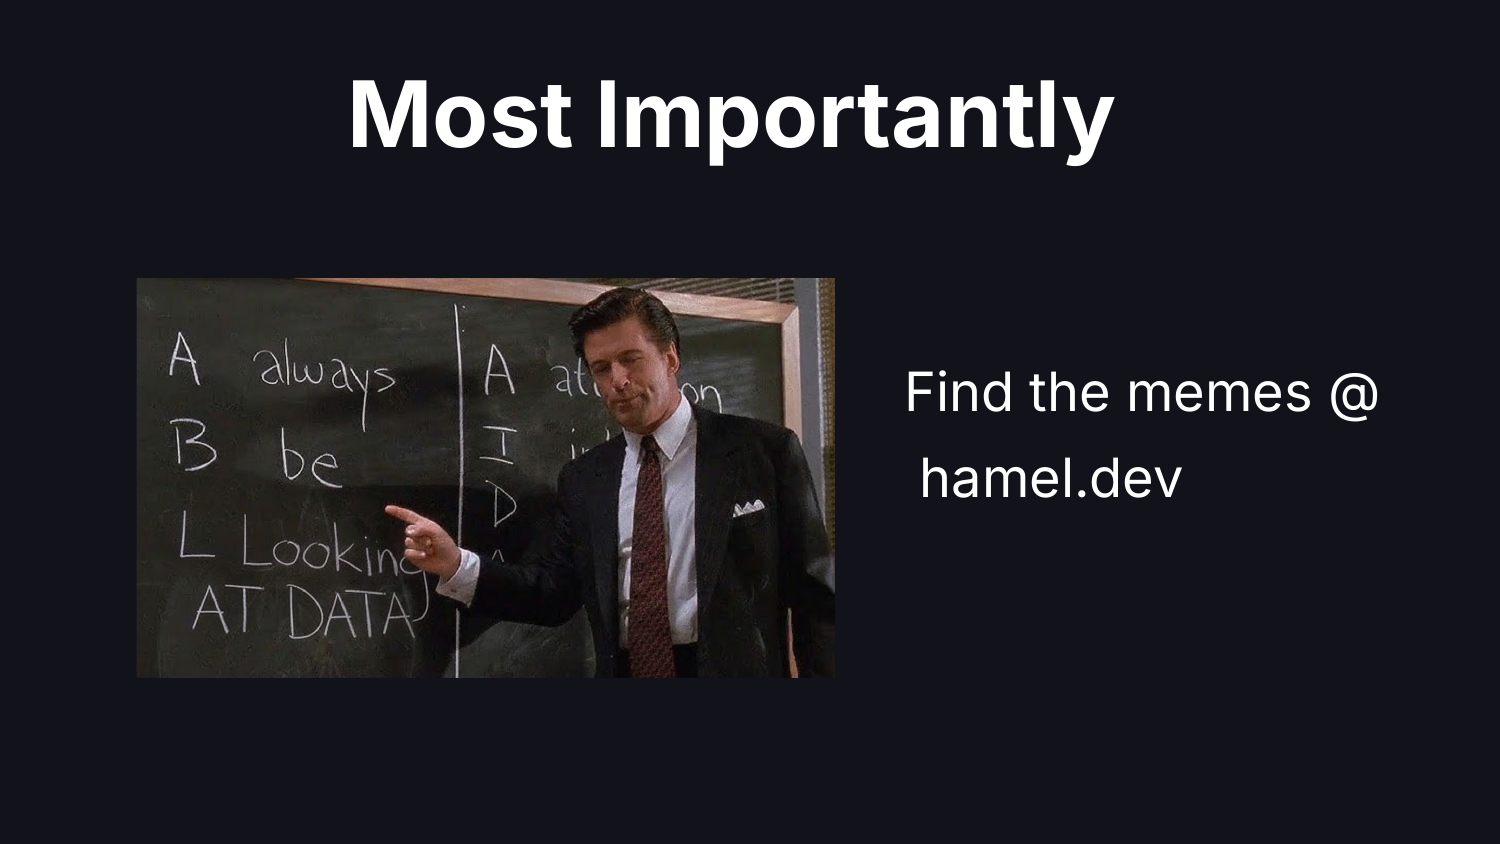
常にデータを注視してください。
この講演のミームを楽しんでいただけたなら、私のウェブサイトにはさらに多くのミームがあります。
これらのトピックについてより深く学びたい場合は、スライドと動画は以下にあります。
本講演の構成に多大な貢献をされた Shreya Shankar 氏および Bryan Bischof 氏に感謝いたします。
動画とスライド
スライドへのリンク
脚注
https://hbr.org/2012/10/data-scientist-the-sexiest-job-of-the-21st-century↩︎
https://www.forbes.com/sites/louiscolumbus/2018/01/29/data-scientist-is-the-best-job-in-america-according-glassdoors-2018-rankings/↩︎
https://www.mckinsey.com/about-us/new-at-mckinsey-blog/ai-reinvents-tech-talent-opportunities↩︎
原文を表示
img.img-fluid {
border: 1px solid rgba(255, 255, 255, 0.25);
border-radius: 4px;
}
Is the heyday of the data scientist over? The Harvard Business Review once called it “The Sexiest Job of the 21st Century.”1 In tech, data scientist roles were often among the best paid.2 The job also demanded an unusual mix of skills:
Data Scientist (n.): Person who is better at statistics than any software engineer and better at software engineering than any statistician.
— JosH100 (@josh_wills) May 3, 2012
In addition to creating a high-barrier to entry, these skills enabled data scientists to build predicitive models, measure casuality and find patterns in data. Of these, predicitive modeling paid best. Companies later peeled that work off into a new title: Machine Learning Engineer (“MLE”).3
For years, shipping AI meant keeping data scientists and MLEs on the critical path. With LLMs, this stopped being the default. Foundation-model APIs now allow teams to integrate AI independently.
Getting cut out of the loop rattled data scientists and MLEs I know. If the company no longer needs you to ship AI, it is fair to wonder whether the job still has the same upside. The harsher story people tell themselves: unless you are pretraining at a foundation-model lab, you are not where the action is.
I read it the other way. Training models was never most of the job. The bulk of the work is setting up experiments to test how well the AI generalizes to unseen data, debugging stochastic systems, and designing good metrics. Calling an LLM over an API does not make this work go away.
I recently gave a talk titled “The Revenge of the Data Scientist” at PyAI Conf to make that case with examples rather than assertion alone. Below is an annotated version of that presentation.
The Harness Is Data Science
OpenAI published a blog post on harness engineering that I recommend reading. They describe how Codex worked on a software project for months, autonomously, with agents developing code bounded by a harness of tests and specifications.
One detail in that blog post is easy to miss. The harness includes an observability stack: logs, metrics, and traces exposed to the agent so it can tell when it is going off track. In addition to tests and specifications, there are metrics. That is a key component of the system.
Andrej Karpathy’s auto-research project shows the same pattern: models iteratively optimize against a validation loss metric. Same idea, different harness.
What I want to convince you of is that a large portion of the harness is data science.
Let’s take a step back and take stock of where we are.
Years ago, practitioners spent hours examining data, checking label alignment, and designing metrics. Today, we build on “vibes,” ask the model if it did a good job, and grab off-the-shelf metric libraries without looking at the data.
This shows up most around retrieval and evals. Without a data background, engineers fear what they don’t understand. They claim “RAG is dead” or “evals are dead,” yet build systems that depend on those concepts.
The rest of this post walks through five eval pitfalls I see repeatedly, and what a data scientist would do differently in each case.
Generic Metrics
The first pitfall is generic metrics.
It is tempting to reach for an eval framework and use its metrics off the shelf. The problem: you have no idea what is actually broken. Most teams put up a dashboard with helpfulness scores, coherence scores, hallucination scores. These sound reasonable. They are also generic enough to be useless for diagnosing your application’s failures.
A data scientist would not adopt metrics off the shelf. They would explore the data, explore the traces, ask “what is actually breaking here?”, and figure out the highest-value thing to start measuring. There are infinite things to measure. You have to form hypotheses and iterate.
The best medicine for this pitfall is looking at the data.
What does “looking at the data” mean in practice? It means reading traces. Code your own custom trace viewer so you can remove friction and customize the display for your domain’s quirks. Take notes on problems you find. Do error analysis: categorize failures, figure out what to prioritize, decide what to work on.
When you look at your data, you end up driving toward application-specific metrics. Off-the-shelf similarity metrics like ROUGE or BLEU rarely fit LLM outputs. The metrics that matter look like “Calendar Scheduling Failure” or “Failure to Escalate To Human.”
If there is one thing to take away from this post: look at the data. How to look at it is a separate question and takes practice. This is the higest ROI activity you can engage in and is often skipped.
Unverified Judges
The second pitfall is unverified judges. A lot of teams use an LLM as a judge to figure out whether their AI is working. Most of the time, nobody has a good answer to “how do you trust the judge?”
The default: ask an LLM to rate outputs on a scale and use the numbers. A data scientist would treat the judge like a classifier. You have a black box giving you a prediction. How do you trust it? Get human labels, partition the data into train/dev/test, and measure whether the classifier is trustworthy.
Source few-shot examples from your training set. Hill-climb your judge’s prompt against a dev set. Keep a test set aside to confirm you haven’t overfit. If you have done machine learning before, this is boring. But people are not doing it. Verifying classifiers has become a lost art in modern AI.
Treat your judge like a classifier in how you report results, too. Everywhere I go I see accuracy reported. If a failure mode occurs 5% of the time, accuracy hides the system’s true performance. Use precision and recall.
Bad Experimental Design
The third pitfall is experimental design. There are many dimensions to this. Here are two that come up most.
The first is constructing test sets. Most teams generate synthetic data by prompting an LLM: “Give me 50 test queries.” They get generic, unrepresentative data. A data scientist would look at real production data first, use hypotheses to determine which dimensions matter, then generate synthetic examples along those dimensions.
Ground synthetic data in real logs or traces. Figure out what dimensions to vary. Inject edge cases. Base the synthetic data off real data.
The second is metric design. Teams bundle entire rubrics into a single LLM call and default to 1-5 Likert scales. A data scientist would reduce complexity, make each metric actionable, and tie it to a business outcome. Replace subjective scales with binary pass/fail on scoped criteria. Likert scales hide ambiguity and kick the can down the road on hard decisions about system performance.
Bad Data and Labels
The fourth pitfall is bad data and labels. Data scientists don’t trust the data. They don’t trust the labels. They don’t trust anything. They are skeptical by training. AI engineers at large have not built this muscle yet.
When it comes to labeling, most teams make it someone else’s problem. Labeling seems unglamorous, so it gets delegated to the dev team or outsourced. A data scientist would insist that domain experts label the data, stay skeptical of the labels, and look at the data.
But labeling matters for a deeper reason than label quality. It is impossible to know what you want unless you look at the data. There is a concept called “criteria drift,” validated in a paper by Shreya Shankar and colleagues: users need criteria to grade outputs, but grading outputs helps users define their criteria. People don’t know what they want until they see the LLM’s outputs. The labeling process itself surfaces what matters.
Data scientists champion this: get domain experts and product managers in front of raw data, not summary scores.
Automating Too Much
The fifth pitfall is automating too much. All of this is human work. The temptation is to automate it away.
LLMs can help wire things up, write the plumbing, generate boilerplate for evaluations. They cannot look at the data for you, for the exact reason we just discussed: you don’t know what you want until you see the outputs.
Other Pitfalls
We did not have time to cover every pitfall. Here is a speed run through the rest.
Misusing similarity scores. Asking the judge vague questions like “is it helpful?” Making annotators read raw JSON. Reporting uncalibrated scores without confidence intervals. Data drift, overfitting, not sampling correctly, dashboards that don’t make sense.
The Mapping
If you zoom out, every pitfall above has the same root cause: missing a data science fundamental.
Reading traces and categorizing failures is Exploratory Data Analysis. Validating an LLM judge against human labels is Model Evaluation. Building representative test sets from production data is Experimental Design. Getting domain experts to label outputs is Data Collection. Monitoring whether your product works in production is Production ML. None of this is new. The names changed, the work did not.
This is a Python conference, so: Python remains the best toolset for looking at your data and dealing with data.
I built an open-source plugin that goes into more depth. Point it at your eval pipeline and it will tell you what you are doing wrong, or try its best to.
Always look at the data.
If you enjoyed the memes in this talk, there are many more on my website.
If you want to go deeper on any of these topics, the slides and video are below.
Thanks to Shreya Shankar and Bryan Bischof for many conversations that shaped this talk.
Video & Slides
Link to the slides
Footnotes
https://hbr.org/2012/10/data-scientist-the-sexiest-job-of-the-21st-century↩︎
https://www.forbes.com/sites/louiscolumbus/2018/01/29/data-scientist-is-the-best-job-in-america-according-glassdoors-2018-rankings/↩︎
https://www.mckinsey.com/about-us/new-at-mckinsey-blog/ai-reinvents-tech-talent-opportunities↩︎
関連記事
Google の技術を採用した Siri AI が登場、しかし世界の多くは利用不可
Apple は WWDC 2026 で、ゼロから再構築された新 Siri AI を発表し、Google の技術を組み込んで多段階対話を実現したが、多くの地域ではまだ利用できない。
マクドナルド、Google 支援の AI ドライブスルー注文システムをテスト中
マクドナルドは、Google が支援する「ArchIQ」と呼ばれるAIシステムを米国の5店舗で試験運用しており、このシステムがドライブスルーでの注文受付や店舗運営をサポートしている。
Anthropic、Claude Fable 5 と Claude Mythos 5 を発表:基盤モデルは同一だが安全策が異なり、新「Mythos クラス」 tiers 登場
Anthropic は 2026 年 6 月 9 日、能力が Opus クラスを上回る新 tiers「Mythos クラス」に属する Claude Fable 5 と Claude Mythos 5 を発表した。Fable 5 は一般利用向けに安全策を強化し、Mythos 5 は一部制限を解除した限定版として提供される。
今日のまとめ
AI日報で今日の重要ニュースをまとめ読み