Amazon Bedrock におけるモデル使用量制限リクエストと運用課題の自動処理機能
AWS は Amazon Bedrock の運用成熟度を高めるため、クォータリクエストの自動化やインシデント分類を特徴とする「Bedrock Ops Alert」を発表した。
キーポイント
多層モニタリングと予測機能
利用パターンの追跡により、クォータ増加の必要性を事前に検知し、運用上の問題解決を加速するプロアクティブな監視機能を搭載。
文脈対応型サポートケース自動化
AWS サポートエンジニアが即座に判断できるよう必要な情報を付与した自動ケース作成により、平均解決時間(MTTR)を短縮する。
重複ケース防止メカニズム
同じアラームカテゴリで未解決のケースが存在する場合、新しいケース作成を抑止し、調査への集中力を維持する機能を導入。
AI SRE 向けの通知最適化
文脈を付与した通知により、SRE チームが迅速に対応行動を開始できる環境を整備し、手動運用負荷を軽減する。
影響分析・編集コメントを表示
影響分析
この記事は、生成 AI の実装規模拡大に伴う運用課題(特にリソース制限とインシデント対応の遅延)に対する具体的な解決策を示しており、AWS ユーザーが Bedrock をより安定して大規模に運用するための重要なステップとなる。手動プロセスの自動化により、エンジニアがイノベーションに集中できる環境を提供し、業界全体の生成 AI 運用標準を高める影響がある。
編集コメント
生成 AI の導入が初期段階から本番運用へ移行する組織にとって、リソース管理とインシデント対応の自動化は不可欠な要素です。AWS が提供するこのネイティブ機能により、サードパーティ製ダッシュボードへの依存を減らし、より統合された運用体制を構築できる点は評価できます。
Amazon Bedrock は、世界中の 10 万を超える組織——スタートアップから業界を問わずグローバル企業まで——に生成 AI を提供しています。大胆なイノベーションを推進し、実際のビジネスインパクトをもたらす AI を実現するために必要な柔軟性、エンタープライズセキュリティ、実証済みのスケーラビリティを備え、本番環境で動作するアプリケーションやエージェントを自信を持って構築するための、実績のあるインフラストラクチャと包括的な機能を提供します。Amazon Bedrock によって駆動される生成 AI アプリケーションを複数の基盤モデルおよび本番ワークロードにスケールさせる組織にとって、イノベーションの速度を維持するためには、積極的な運用管理が鍵となります。
生成 AI の採用が各チームに広がっていく中で、組織は目的別に構築された運用監視ソリューションの恩恵を受けることができます。このソリューションは以下の機能を提供します:1) 採用拡大に伴うクォータ増分の必要性を予測するプロアクティブな多層監視(利用パターンの追跡を通じて)、および Amazon Bedrock を活用した生成 AI ワークロードにおける運用課題のトリアージ加速;2) AWS サポートエンジニアに必要な情報を提供し、平均解決時間(MTTR)の短縮に寄与する文脈を考慮したサポートケース自動化;3) 同一アラームカテゴリで未解決のケースが既に存在する場合に新規ケース作成を抑止し、進行中の調査への支障を防ぐ重複ケース防止機能;4) AI SRE チームが迅速に対応できるよう支援する文脈付き通知;5) 手動による運用負荷を軽減することでイノベーションへの継続的な集中を可能にする機能です。
本稿では、Amazon Bedrock Ops Alert をご紹介します。これは、運用課題をプロアクティブに検出し、アラーム閾値を動的に調整し、カテゴリ別にアラームを分類し、文脈を考慮したサポートケースを自動的に作成し、同一カテゴリの未解決ケースが既にアクティブな場合に重複ケースの発生を防ぎ、AI SRE チームへ文脈付き通知を提供する 3 レイヤー構成の自動化監視ソリューションです。本稿では、このソリューションのアーキテクチャと、ご自身の環境でどのようにデプロイできるかについて詳しく解説します。
ジェネレーティブ AI ワークロードにおける運用成熟度のスケーリング
Amazon Bedrock は、顧客間でのリソース割り当てを管理するために、1 分あたりのリクエスト数 (RPM) および 1 分あたりのトークン数 (TPM) に関するサービスクォータを提供しています。これらのクォータは、ワークロードが拡大するにつれて AWS サポートケースを通じて増加させることができます。一般的な初期のアプローチとしては、Amazon CloudWatch メトリクスを基盤とするサードパーティ製のダッシュボードソリューションと、クォータの消費状況や必要な場合のリクエスト増額を監視するための手動プロセスを組み合わせた方法があります。このアプローチは、採用初期段階においてチームに有効な役割を果たします。
採用が進むにつれ、組織は多くの場合、ワークロードの最適化がクォータの増加よりも容量要件に対してより効果的に対処できることに気づきます。クロスリージョン推論 は、異なる AWS リージョン間でコンピューティングリソースを活用することで、組織が予期せぬトラフィックの急増を管理するのを支援します。特定の地理領域に紐付けられた推論プロファイルを使用する場合、Amazon Bedrock はその地理領域内で最適な商用 AWS リージョンを自動的に選択し、推論リクエストを処理します。グローバルクロスリージョン推論 は、この機能を地理的な境界を超えて拡張し、世界中の商用 AWS リージョンに対して推論リクエストをルーティングすることで、利用可能なリソースを最適化し、より高いモデルスループットを提供します。グローバル推論プロファイルを使用すると、ワークロードは個々のリージョンの容量に制約されなくなり、地理的なクロスリージョン推論と比較してはるかに大きなリソースプールへのアクセスが可能となり、コストを約 10% 削減できます。
ポスト「Anthropic の Claude Sonnet 4.5 を使用した Amazon Bedrock 上の新しいグローバルクロスリージョン推論によるグローバル AI 推論のスケーラビリティの解放」(https://aws.amazon.com/blogs/machine-learning/unlock-global-ai-inference-scalability-using-new-global-cross-region-inference-on-amazon-bedrock-with-anthropics-claude-sonnet-4-5/) では、グローバル推論プロファイルが AWS のグローバルインフラストラクチャ全体にリクエストを動的にルーティングし、本来はクォータの増加が必要となるような需要を吸収する方法について詳しく解説しています。
Prompt caching は、推論応答のレイテンシと入力トークンコストを削減するためのオプション機能です。コンテキストの一部をキャッシュに追加することで、モデルは入力の再計算をスキップし、Amazon Bedrock が計算リソースの節約を共有して応答遅延を低減できます。Prompt caching は、複数のクエリで頻繁に再利用される長く反復的なコンテキストを持つワークロードにおいて効果的で、コストを最大 90%、レイテンシを最大 85% 削減し、直接トークン毎分の消費量を低下させます。Effectively use prompt caching on Amazon Bedrock の記事では、複数の API 呼び出し全体でキャッシュヒットを最大化するためのプロンプトの構成方法について解説しています。バッチ推論や Intelligent Prompt Routing などの追加技術により、各呼び出しに対して最もコスト効率の高いモデルを動的に選択することで、リクエストごとのオーバーヘッドがさらに削減されます。
max_tokens パラメータを最適化することで、割り当てられたクォータ容量を効率的に活用できます。max_tokens の値は、各リクエストの開始時にクォータから差し引かれます。処理中は、生成された実際の出力トークン数に応じて消費されるクォータが定期的に調整され、リクエスト終了時には未使用のトークンがクォータに戻されます。後続の投稿「Amazon Bedrock における推論ワークロードの運用可視性を向上させるため、TTFT と推定クォータ消費量に関する新しい CloudWatch メトリクスを導入する」(https://aws.amazon.com/blogs/machine-learning/improve-operational-visibility-for-inference-workloads-on-amazon-bedrock-with-new-cloudwatch-metrics-for-ttft-and-estimated-quota-consumption/) では、リクエストタイプごとに max_tokens の決定を導くために、InputTokenCount および OutputTokenCount という CloudWatch メトリクスをどのように監視するかについて詳しく解説しています。
組織がこれらの最適化戦略を採用し、複数の基盤モデルや本番ワークロードに展開するにつれ、AI SRE チームはイノベーションの速度を維持し、平均修復時間 (MTTR) を短縮するために、自動化された運用モニタリングでこれらを補完しようとしています。具体的には、チームは一般的に改善が必要な 4 つの領域を特定しています。
- リアクティブな運用:AI SRE チームは、ビジネスユーザーから影響の報告があった場合にのみ運用上の問題に気づくことが多く、これがチームを反応的な運用に追い込み、影響が拡大する前に調査や対応を行う時間が限られてしまいます。
- ケース文脈の強化の機会:クォータに関する問題が発生した際、サポートケースにはより豊富な文脈を提供することで、単純なクォータ増量リクエストと、より深い調査を要する事案を区別し、サポートエンジニアがケースを迅速に解決できるよう支援できます。
- 運用負荷の増大:組織が多様なユースケース向けに新しいファウンデーションモデルを採用するにつれ、各新モデルには独自の監視設定とクォータ増量リクエストが必要となります。この区別のない重労働は、モデルポートフォリオの拡大に伴い線形的に増加します。
- アラーム閾値の移動目標:承認された各クォータ増量は、AI SRE チームが手動で CloudWatch のアラーム閾値を再計算・更新することを要求し、運用オーバーヘッドと設定のドリフトリスクを生み出します。
ソリューション概要
Amazon Bedrock Ops Alert は、AWS CloudFormation ベースのソリューションであり、3 つの補完的な検出レイヤーを通じて包括的な生成 AI 観測性を実装しています。各レイヤーは、即座の運用問題の検出から予測的な異常の特定に至るまで、生成 AI ワークロードに対する異なる可視性を提供します。
本ソリューションは、Amazon CloudWatch アラーム、AWS Lambda 関数、Amazon Simple Notification Service (Amazon SNS)、Service Quotas API、および AWS Support API を活用しています。
以下の図は、本ソリューションのアーキテクチャを示しています。
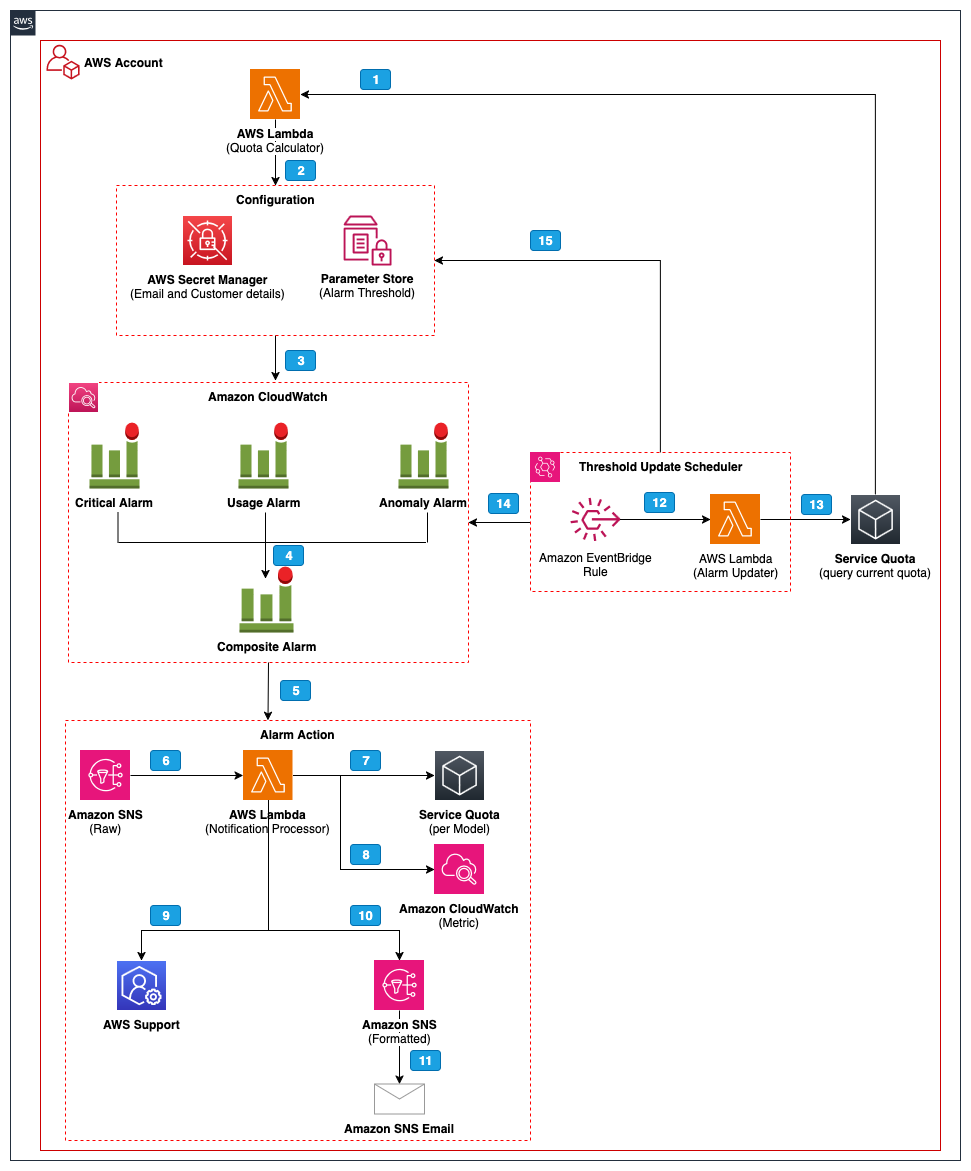
ワークフローの手順は以下の通りです。
- デプロイ中に、Lambda 関数(Quota Calculator)は Service Quotas API をクエリして現在の RPM および TPM クォータ値を取得し、設定されたパーセンテージを適用することでアラーム閾値を計算します。
- 計算された閾値は AWS Systems Manager Parameter Store に保存され、AI SRE チームのメール連絡先は AWS Secrets Manager に保存されます。
- Amazon Bedrock は、ランタイムメトリクス(呼び出し回数、トークン数、エラー、スロットリング、レイテンシ)を CloudWatch に公開します。これらのメトリクスは 3 つの独立した監視層によって評価されます:
レイヤー 1(クリティカルエラー検出)は、即時アラートのためにスロットリング、クライアントエラー、およびサーバーエラーを監視します。
- レイヤー 2(使用率モニタリング)は、RPM、TPM、およびレイテンシを動的に計算された閾値と比較します。
- レイヤー 3(異常検出)は、CloudWatch の機械学習を使用してメトリクス全体で異常なパターンを特定します。
- 子アラームがトリガーされると、複合アラームがその状態を集約します。
- 複合アラームは SNS トピック(Raw Alarm Topic)に公開されます。
- この SNS トピックは、Lambda 通知プロセッサ関数を呼び出し、この関数は複合アラームをポーリングしてどの子アラームがトリガーされたかを特定し、アラームの重大度(クリティカルまたは警告)を決定します。
- 通知プロセッサは Service Quotas API をクエリして現在の RPM および TPM クォータ値を取得します。
- 通知プロセッサは CloudWatch をクエリして現在の使用率メトリクスを取得し、過去 14 日間の定常状態およびピークの RPM/TPM、および 1 回あたりの平均トークン数を含みます。また、Parameter Store に保存されたアラーム閾値を読み取り、ピーク使用量を閾値と比較してサポートケースのシナリオを決定します。
- 自動化されたサポートケース作成が有効になっている場合、この関数はアラームをクォータ関連または非クォータに分類し、カテゴリ認識型の重複検出(設定可能なルックバックウィンドウ、デフォルトは 60 日)を使用して未解決の既存ケースがあるかを確認します。そして、既存のケースに通信を追加するか、新しい AWS Support ケースを作成します。クォータ関連のアラームの場合、ケースには使用量が検証されたコンテンツを含む事前入力済みのクォータデータが含まれます。非クォータアラーム(永続的なエラーやレイテンシ異常など)の場合、根本原因分析を支援するためのコンテキストを提供します。
- サポートケース処理が完了した後、関数は 2 つ目の SNS トピック(Formatted Notification Topic)を通じて、通知設定(すべて、クリティカル、または警告)でフィルタリングされたステークホルダーにフォーマットされたメール通知を送信します。サポートケースが作成された場合、メールにはケース ID と AWS Support コンソールへの直接リンクが含まれます。
- フォーマットされた通知は、購読しているステークホルダーに対してメールとして配信されます。
- 設定可能なスケジュールで、Amazon EventBridge ルールが Lambda 関数(Alarm Updater)をトリガーします。
- Alarm Updater は Service Quotas API をクエリして現在の RPM および TPM クォータ値を取得します。
- Alarm Updater は設定されたパーセンテージを適用してアラーム閾値を再計算し、新しい閾値で CloudWatch アラームを更新します。
- 更新された閾値は、履歴を追跡するためのタイムスタンプと共に Parameter Store に保存されます。
3 層モニタリングアーキテクチャ
本ソリューションは、異なる段階で運用上の問題を検出するために独立して動作する CloudWatch アラームを使用して、3 つのモニタリング層を実装しています。
レイヤー 1: 重大エラーの検出
最初のレイヤーは、運用上の問題を示すエラーメトリクスを監視します:
- ClientErrors アラーム:InvocationClientErrors メトリクスを監視し、クォータ制限の超過、バリデーションエラー、または無効なパラメータなどのクライアント側の問題により拒否されたリクエストを特定します。
- ServerErrors アラーム:Investigation が必要なサービス側のエラーを特定するために InvocationServerErrors メトリクスを監視します。
- Throttles アラーム:レート制限に達した際に明示的にスロットリングされるリクエストを特定するために InvocationThrottles メトリクスを監視します。
これらのアラームは、設定可能なしきい値と評価期間を使用しています。エラーしきい値を 0 に設定して評価期間を 1 とすることで、エラー発生時に即座にアラートがトリガーされますが、より高い値を設定することで一時的な問題に対する許容度を高めることができます。
レイヤー 2: 使用率モニタリング
2 つ目のレイヤーは、動的に計算されたしきい値に対して使用量メトリクスを監視し、クォータ制限に達する前に予防的なアラートを提供します:
- HighInvocationRate アラーム:Invocations メトリクスを監視し、API 要求レートが設定された RPM(リクエスト毎分)閾値の割合を超えた場合にトリガーされます。
- HighTPMQuotaUsage アラーム:EstimatedTPMQuotaUsage メトリクスを監視し、推定される 1 分あたりのトークン使用量が設定された TPM(トータル・ミニッツ・パーミッション)閾値の割合を超えた場合にトリガーされます(キャッシュ書き込みトークンおよび出力バーンドウン乗数を含みます)。
- HighLatency アラーム:InvocationLatency メトリクスを監視し、応答時間が設定されたレイテンシ閾値を超えた場合にトリガーされます。
本ソリューションは、Service Quotas API をクエリしてアラーム閾値を自動的に計算し、設定可能なパーセンテージを適用します。例えば、80% の閾値と 100 RPM のクォータの場合、RPM アラームは 1 分あたり 80 リクエストでトリガーされます。TPM の場合も同様に、1,000,000 TPM のクォータに対して 80% の閾値を適用すると、有効なトークン閾値は 800,000 トークンとなります。TPM アラームは、キャッシュ書き込みトークンおよび出力バーンドウン乗数を含む推定 TPM クォータ使用量を追跡する EstimatedTPMQuotaUsage メトリクスを使用します。
レイヤー 3:異常検知
第 3 レイヤーでは、CloudWatch の異常検知を閾値タイプとして使用し、メトリクス全体にわたる異常なパターンを識別します:
- InvocationAnomaly アラーム:異常検出を使用して Invocations メトリクスを監視し、予期せぬリクエスト量の増減を検出します。
- InputTokenAnomaly アラーム:異常検出を使用して InputTokenCount メトリクスを監視し、入力トークンの使用における異常を検出します。
- OutputTokenAnomaly アラーム:異常検出を使用して OutputTokenCount メトリクスを監視し、出力トークンの使用における異常を検出します。
- LatencyAnomaly アラーム:異常検出を使用して InvocationLatency メトリクスを監視し、パフォーマンスの低下傾向を検出します。
CloudWatch の機械学習は、履歴データを分析して正常な動作の基準値を確立し、現在のメトリクスが期待される範囲の上限閾値を超えた場合にアラートを発令します。本ソリューションは上昇方向への逸脱のみを監視しており、使用量の減少は介入を要しないポジティブなシグナルとみなされます。このアプローチにより、静的な閾値では見逃されがちな問題、例えば段階的なクォータ消費の増加や予期せぬ使用量の急増などを検出することが可能です。
自動閾値管理
本ソリューションは、自動閾値再計算を通じてクォータの変更に対して動的に適応します:
- 初期計算:デプロイ時に Lambda 関数が Service Quotas API を照会し、現在のクォータと設定されたパーセンテージに基づいてアラーム閾値を計算します。
- 定期更新:EventBridge ルールが構成可能なスケジュール(デフォルト:1 日ごと)で閾値の再計算トリガーとなります。
- アラーム自動更新:承認されたクォータ増加分によりクォータ値が変更されると、本ソリューションは CloudWatch アラームを新しい閾値で更新します。
- 閾値履歴:計算された閾値は、AWS Systems Manager の機能である Parameter Store にタイムスタンプと共に保存されます。
この自動化により、追加のクォータ増分リクエストが承認された際の手動による閾値メンテナンスを軽減できます。AI SRE チームはもはやクォータ変更を追跡してアラーム設定を手動で更新する必要がなく、システムが自己修正します。
以下の表は、Service Quotas の値からどのようにアラーム閾値が導出されるかを説明しています。
| Threshold | Formula | Example |
|---|---|---|
| RPM threshold | RPM quota × (RequestsPerMinuteThresholdPercent / 100) | 10,000 RPM quota × 80% = 8,000 |
| TPM threshold | TPM quota × (TokensPerMinuteThresholdPercent / 100) | 6,250,000 TPM quota × 80% = 5,000,000 |
TPM 閾値パーセンテージは TPM クォータに直接適用されます。サポートケースのシナリオを決定する際、使用状況検証ではこの閾値に対して過去 14 日間のピーク TPM が比較されます。
オートメーション化されたサポートケースの作成
本ソリューションは、運用上の問題が検出された際に AWS サポートケースを自動的に作成する機能をオプションで提供します。この機能を利用するには、Support API へのアクセス権限を持つ AWS ビジネスまたはエンタープライズサポートプランへの加入が必要です。
ワークフローは以下の通りです:
- コンポジットアラーム(複合アラート)が子アラームのいずれかが ALARM 状態になった際にトリガーされます。
- Lambda 関数がコンポジットアラームの状態をポーリングし、対象となる子アラームを確認します。
- 関数は Parameter Store に保存されたアラーム閾値を読み取り、過去 14 日間のピーク使用量と閾値を比較して、サポートケースのシナリオを特定します。
- 関数はアラームがクォータ関連か非クォータ関連かを分類し、カテゴリ認識型の重複検出(設定可能なルックバックウィンドウ、デフォルトは 60 日)を使用して、Support API で未解決の既存ケースが存在するか確認します。
同じカテゴリの未解決ケースが存在する場合、システムはその既存ケースに完全なアラーム詳細、更新されたメトリクス、および緊急性の文脈を含む通信を追加します。重複するケースが存在しない場合、システムは新しいサポートケースを作成し、sce
原文を表示
Amazon Bedrock powers generative AI for more than 100,000 organizations worldwide—from startups to global enterprises across every industry. It provides the proven infrastructure and comprehensive capabilities to confidently build applications and agents that work in production with the flexibility, enterprise security, and proven scalability you need to innovate boldly and deliver AI that drives real business impact. As organizations scale their generative AI applications powered by Amazon Bedrock across multiple foundation models and production workloads, proactive operational management becomes key to sustaining innovation velocity.
As generative AI adoption grows across teams, organizations can benefit from a purpose-built operational monitoring solution that delivers: 1) proactive, multi-layer monitoring that anticipates quota increase needs as adoption grows by tracking usage patterns and accelerates operational issue triage for generative AI workloads powered by Amazon Bedrock; 2) context-aware support case automation that accelerates mean time to resolution by equipping AWS support engineers with the information they need; 3) duplicate case prevention that suppresses new case creation when an unresolved case of the same alarm category already exists, avoiding distraction from active investigations; 4) contextualized notifications that empower AI SRE teams to act quickly; and 5) continued focus on innovation by reducing manual operational overhead.
In this post, we introduce Amazon Bedrock Ops Alert, a three-layer automated monitoring solution that proactively detects operational issues, dynamically adjusts alarm thresholds, classifies alarms by category, automatically creates context-aware support cases, helps prevent duplicate cases when an unresolved case of the same alarm category is already active, and delivers contextualized notifications to AI SRE teams. We walk through the solution architecture and how you can deploy it in your own environment.
Scaling operational maturity for generative AI workloads
Amazon Bedrock provides service quotas for requests per minute (RPM) and tokens per minute (TPM) to help manage resource allocation across customers. These quotas can be increased through AWS Support cases as workloads grow. A common initial approach uses third-party dashboarding solutions backed by Amazon CloudWatch metrics, combined with manual processes to monitor quota consumption and request increases when needed. This approach serves teams well during early adoption.
As adoption grows, organizations often discover that workload optimization addresses capacity needs more effectively than quota increases. Cross-region inference helps organizations manage unplanned traffic bursts by using compute across different AWS Regions. When using an inference profile tied to a specific geography, Amazon Bedrock automatically selects the optimal commercial AWS Region within that geography to process the inference request. Global cross-region inference extends this beyond geographic boundaries by routing inference requests to support commercial AWS Regions worldwide, optimizing available resources and providing higher model throughput. With global inference profiles, workloads are no longer constrained by individual Regional capacity, providing access to a much larger pool of resources and approximately 10% cost savings compared to geographic cross-region inference. In the post Unlock global AI inference scalability using new global cross-Region inference on Amazon Bedrock with Anthropic’s Claude Sonnet 4.5, we detail how global inference profiles dynamically route requests across the AWS global infrastructure to absorb demand that would otherwise require quota increases.
Prompt caching is an optional feature that reduces inference response latency and input token costs. By adding portions of the context to a cache, the model skips recomputation of inputs, allowing Amazon Bedrock to share in the compute savings and lower response latencies. Prompt caching helps when workloads have long and repeated contexts that are frequently reused for multiple queries, reducing costs by up to 90% and latency by up to 85%, which directly lowers tokens-per-minute consumption. In the post Effectively use prompt caching on Amazon Bedrock, we walk through how to structure prompts to maximize cache hits across multiple API calls. Additional techniques such as batch inference and Intelligent Prompt Routing further reduce per-request overhead by dynamically selecting the most cost-effective model for each call.
By optimizing the max_tokens parameter, you can efficiently use your allocated quota capacity. The max_tokens value is deducted from your quota at the beginning of each request. During processing, the quota consumed is periodically adjusted to account for the actual number of output tokens generated, and at the end of the request any unused tokens are replenished to your quota. In the post Improve operational visibility for inference workloads on Amazon Bedrock with new CloudWatch metrics for TTFT and Estimated Quota Consumption, we detail how to monitor InputTokenCount and OutputTokenCount CloudWatch metrics to guide max_tokens decisions per request type.
As organizations adopt these optimization strategies and expand across multiple foundation models and production workloads, AI SRE teams look to complement them with automated operational monitoring to sustain innovation velocity and reduce mean time to resolution. Specifically, teams commonly identify four areas for improvement:
- Reactive operations: AI SRE teams often learn of operational issues only when business users report impact. This forces the team to operate reactively, with limited time to investigate and respond before the impact escalates.
- Opportunity for case context enrichment: When quota issues arise, support cases can benefit from richer context, distinguishing straightforward quota increases from issues requiring deeper investigation, to help support engineers resolve cases faster.
- Multiplying operational effort: As organizations adopt new foundation models for different use cases, each new model requires its own monitoring setup and quota increase requests. This undifferentiated heavy lifting grows linearly with the model portfolio.
- Moving target for alarm thresholds: Each approved quota increase requires the AI SRE team to manually recalculate and update CloudWatch alarm thresholds, creating operational overhead and the risk of configuration drift.
Solution overview
Amazon Bedrock Ops Alert is an AWS CloudFormation-based solution that implements comprehensive generative AI observability through three complementary detection layers. Each layer provides different visibility into generative AI workloads, from immediate operational issue detection to predictive anomaly identification.
The solution uses Amazon CloudWatch alarms, AWS Lambda functions, Amazon Simple Notification Service (Amazon SNS), the Service Quotas API, and AWS Support API.
The following diagram illustrates the solution architecture.
The workflow steps are as follows:
- During deployment, a Lambda function (Quota Calculator) queries the Service Quotas API for current RPM and TPM quota values and calculates alarm thresholds by applying configured percentages.
- The calculated thresholds are stored in AWS Systems Manager Parameter Store, and AI SRE team email contacts are stored in AWS Secrets Manager.
- Amazon Bedrock publishes runtime metrics (invocations, token counts, errors, throttles, and latency) to CloudWatch. Three independent monitoring layers evaluate these metrics:
Layer 1 (Critical Error Detection) monitors throttles, client errors, and server errors for immediate alerting.
- Layer 2 (Usage Rate Monitoring) compares RPM, TPM, and latency against the dynamically calculated thresholds.
- Layer 3 (Anomaly Detection) uses CloudWatch machine learning to identify unusual patterns across metrics.
- When a child alarm triggers, a composite alarm aggregates the state.
- The composite alarm publishes to an SNS topic (Raw Alarm Topic).
- The SNS topic invokes a Lambda notification processor function, which polls the composite alarm to identify which child alarms triggered and determines alarm severity (critical or warning).
- The notification processor queries the Service Quotas API for current RPM and TPM quota values.
- The notification processor queries CloudWatch for current usage metrics, including steady-state and peak RPM/TPM over the past 14 days and average tokens per request. It also reads stored alarm thresholds from Parameter Store and compares peak usage against thresholds to determine the support case scenario.
- If automated support case creation is enabled, the function classifies the alarm as quota-related or non-quota, checks for existing unresolved cases using category-aware duplicate detection (configurable lookback window, default 60 days), and either appends a communication to the existing case or creates a new AWS Support case. For quota-related alarms, the case includes pre-filled quota data with usage-validated content. For non-quota alarm (such as persistent errors or latency anomalies), providing context to assist with root cause analysis.
- After support case processing completes, the function sends formatted email notifications to stakeholders through a second SNS topic (Formatted Notification Topic), filtered by notification preference (all, critical, or warning). If a support case was created, the email includes the case ID and a direct link to the AWS Support console.
- The formatted notification is delivered as email to subscribed stakeholders.
- On a configurable schedule, an Amazon EventBridge rule triggers a Lambda function (Alarm Updater).
- The Alarm Updater queries the Service Quotas API for current RPM and TPM quota values.
- The Alarm Updater recalculates alarm thresholds by applying configured percentages, and updates CloudWatch alarms with new thresholds.
- The updated thresholds are stored in Parameter Store with timestamps for tracking history.
Three-layer monitoring architecture
The solution implements three monitoring layers using CloudWatch alarms that work independently to detect operational issues at different stages.
Layer 1: Critical error detection
The first layer monitors error metrics that indicate operational issues:
- ClientErrors alarm: Monitors the InvocationClientErrors metric to identify requests rejected due to client-side issues such as exceeded quota limits, validation errors, or invalid parameters.
- ServerErrors alarm: Monitors the InvocationServerErrors metric to identify service-side errors that may require investigation.
- Throttles alarm: Monitors the InvocationThrottles metric to identify requests explicitly throttled when the rate limit is reached.
These alarms use configurable thresholds and evaluation periods. Setting the error threshold to 0 with a single evaluation period triggers immediate alerts when an error occurs, while higher values provide tolerance for transient issues.
Layer 2: Usage rate monitoring
The second layer monitors usage metrics against dynamically calculated thresholds, providing proactive alerts before reaching your quota limit:
- HighInvocationRate alarm: Monitors the Invocations metric and triggers when the API request rate breaches the configured RPM threshold percentage of your quota.
- HighTPMQuotaUsage alarm: Monitors the EstimatedTPMQuotaUsage metric and triggers when estimated tokens per minute quota consumption breaches the configured TPM threshold percentage of your quota (includes cache write tokens and output burndown multipliers).
- HighLatency alarm: Monitors the InvocationLatency metric and triggers when response time breaches the configured latency threshold.
The solution automatically calculates alarm thresholds by querying the Service Quotas API and applying configurable percentages. For example, with an 80% threshold and a 100 RPM quota, the RPM alarm triggers at 80 requests per minute. For TPM, the same 80% threshold on a 1,000,000 TPM quota gives an 800,000 effective tokens threshold. The TPM alarm uses the EstimatedTPMQuotaUsage metric that tracks estimated TPM quota consumption, including cache write tokens and output burndown multipliers.
Layer 3: Anomaly detection
The third layer uses CloudWatch anomaly detection as the threshold type to identify unusual patterns across metrics:
- InvocationAnomaly alarm: Monitors the Invocations metric using anomaly detection to identify unusual request volume changes.
- InputTokenAnomaly alarm: Monitors the InputTokenCount metric using anomaly detection to identify abnormal input token usage.
- OutputTokenAnomaly alarm: Monitors the OutputTokenCount metric using anomaly detection to identify abnormal output token usage.
- LatencyAnomaly alarm: Monitors the InvocationLatency metric using anomaly detection to identify performance degradation trends.
CloudWatch machine learning analyzes historical data to establish normal behavior baselines, then alerts when current metrics exceed the upper threshold of the expected range. The solution monitors only upward deviations: usage drops are positive signals that don’t require intervention. This approach detects issues that static thresholds miss, such as gradual quota consumption increases or unexpected usage surges.
Automated threshold management
The solution dynamically adapts to quota changes through automated threshold recalculation:
- Initial calculation: During deployment, a Lambda function queries the Service Quotas API and calculates alarm thresholds based on current quotas and configured percentages.
- Scheduled updates: An EventBridge rule triggers threshold recalculation on a configurable schedule (default: every 1 day).
- Automatic alarm updates: When approved quota increases change the quota values, the solution updates CloudWatch alarms with new thresholds.
- Threshold history: Calculated thresholds are stored in Parameter Store, a capability of AWS Systems Manager, with timestamps.
This automation alleviates manual threshold maintenance when further quota increase requests are approved. AI SRE teams no longer need to track quota changes and manually update alarm configurations: the system self-corrects.
The following table describes how alarm thresholds are derived from Service Quotas values.
Threshold
Formula
Example
RPM threshold
RPM quota × (RequestsPerMinuteThresholdPercent / 100)
10,000 RPM quota × 80% = 8,000
TPM threshold
TPM quota × (TokensPerMinuteThresholdPercent / 100)
6,250,000 TPM quota × 80% = 5,000,000
The TPM threshold percentage is applied directly to the TPM quota. The usage validation compares 14-day peak TPM against this threshold when determining the support case scenario.
Automated support case creation
The solution optionally automates AWS Support case creation when operational issues are detected. This feature requires an AWS Business or Enterprise Support plan for Support API access.
The workflow operates as follows:
- The composite alarm triggers when a child alarm enters ALARM state.
- A Lambda function polls the composite alarm status, checking for eligible child alarms.
- The function reads stored alarm thresholds from Parameter Store and compares 14-day peak usage against thresholds to determine the support case scenario.
- The function classifies the alarm as quota-related or non-quota and checks the Support API for existing unresolved cases using category-aware duplicate detection (configurable lookback window, default 60 days).
If an unresolved case of the same category exists, the system appends a communication to the existing case with full alarm details, updated metrics, and urgency context. If no duplicate exists, the system creates a new support case with sce
関連記事
Amazon Bedrock で大規模な自律型 AI オペレーションを構築する方法
AWS は、10 万社以上の組織で利用されている Amazon Bedrock を活用し、生産環境で動作するアプリケーションやエージェントを構築するための大規模な自律型 AI オペレーションの構築手法を発表した。
CloudWatch の SageMaker メトリクスとインサイトダッシュボードを用いた生成 AI 推論の監視・デバッグ
AWS は、大規模な生成 AI 推論エンドポイントの P99 レイテンシ急上昇などのトラブルを GPU メモリ圧力や KV キャッシュ飽和などから特定できるよう、CloudWatch に SageMaker の詳細メトリクスとインサイトダッシュボードを追加した。
Amazon Bedrock Guardrails の InvokeGuardrailChecks API でエージェント型 AI アプリケーションを保護
AWS は、Amazon Bedrock Guardrails に新 API「InvokeGuardrailChecks」を追加した。これにより、開発者は guardrail リソースを作成せずとも、エージェント型 AI アプリケーションの任意の時点で個別の安全チェック(ガードレール)を実行できるようになった。
今日のまとめ
AI日報で今日の重要ニュースをまとめ読み