エージェントの観測可能性:本番環境でのLLMエージェントの監視と評価方法
LangChain Blogは、LLMエージェントの生産環境における監視と評価において従来のツールでは不十分であることを指摘し、トレーサビリティ、評価、改善を可能にする新たな観測可能性(Observability)の枠組みとツールの必要性について解説している。
キーポイント
従来の監視手法の限界
LLMエージェントは非決定性が高く複雑な動作を行うため、従来のログ監視や単一メトリクスでは内部状態の可視化が困難である。
トレーサビリティと評価の統合
エージェントの意思決定プロセスを追跡し、出力品質を自動評価するための専用ツールチェーンの構築が重要である。
大規模なエージェント運用の課題
スケーラビリティを維持しながら、多数のエージェントの動作を一元的に監視し、パフォーマンスを最適化する手法が求められている。
影響分析・編集コメントを表示
影響分析
この記事は、LLMアプリケーション開発において「ビルド」から「運用・監視」への焦点移行を示唆しており、AIエンジニアリングの成熟度を高める上で重要な指針となる。LangChainエコシステムにおける観測可能性ツールの標準化は、企業レベルでのLLM導入障壁を下げる可能性がある。
編集コメント
LLMエージェントの普及に伴い、その「黒箱」状態を解明する観測可能性技術は、次なる業界標準となるでしょう。LangChainの提言は、実務レベルでのAI運用基盤整備に直結する重要な示唆を含んでいます。
本番環境にデプロイするまで、エージェントが何をするか分からない
主要なポイント
エージェントは従来のソフトウェアのように監視することはできません。入力は無限大であり、振る舞いは非確定的(non-deterministic)であり、品質は会話そのものの中にあります。この記事では、何を監視すべきか、評価をどのようにスケールさせるか、そして本番環境のトレース(trace)が継続的な改善の基盤となる方法を解説します。
従来のソフトウェアを本番環境にデプロイする場合、どのような結果が期待できるかについて概ね見当がつきます。ユーザーはボタンをクリックし、フォームに入力し、事前に定められたパスをナビゲートします。テストスイートはコードパスの80〜90%をカバーしている可能性が高く、監視ツールはエラーレート、応答時間、データベースクエリといった「よくある嫌疑者」を追跡します。何かが壊れた場合、スタックトレースやログを確認します。
エージェントは異なる方法で動作します。自然言語の入力を受け取り、可能なクエリの空間は無制限です。これらは大規模言語モデル(LLM)によって駆動されており、プロンプトの微妙な変化に敏感で、同じ入力に対しても異なる出力を生成する可能性があります。さらに、開発段階では完全に予測が困難な、マルチステップの推論チェーン、ツール呼び出し、および取得(retrieval)操作を通じて意思決定を行います。
これは、エージェントの運用環境におけるモニタリングには、従来の観測性(observability)とは異なる機能が必要であることを意味します。この投稿では、エージェントの観測性がなぜ固有の課題を抱えているのか、何をモニタリングすべきか、そして大規模なエージェント導入を行うチームから私たちが学んだ教訓について探っていきます。
エージェントが従来のソフトウェアと異なる理由
運用環境へのエージェント導入に取り組むチームとの協業を通じて、モニタリングのアプローチに影響を与える2つの重要な相違点を確認しました。
エージェントは無限の入力空間を持つ
従来のソフトウェアは、有限で制約された入力空間を持ちます。ユーザーはボタン、ドロップダウンメニュー、フォーム、特定の形式を持つAPI呼び出しを通じて対話します。チェックアウトフローを設計する場合、画面の正確なシーケンスとユーザーの取り得る行動が分かっています。失敗モードを列挙できるため、エラーハンドリングは包括的に行うことができます。
一方、エージェントは自然言語を主要な入力として受け付けます。自然言語には有効な入力の固定セットが存在しません。ユーザーは、同じリクエストを無数の方法で表現できます——曖昧または具体的、フォーマルまたはカジュアル、単一のメッセージ内で複数の意図を組み合わせたり、1つのリクエストを複数回のやり取りに分散したりします。
カスタマーサポートエージェントの例を考えてみましょう。従来のソフトウェアでは、ユーザーは「注文履歴」に移動し、特定の注文をクリックし、「返金リクエスト」をクリックし、最後に定義されたオプションを含むフォームに入力します。このパスは固定されており、テスト可能です。
エージェントの場合、ユーザーは以下のように話すかもしれません:
- 「注文をキャンセルしたい」
- 「先週購入した靴の返金をお願いできますか?」
- 「届いた商品が破損しています。どのような対応が可能ですか?」
- 「注文番号 #12345 の返金をお願いします」

これらはすべて、同じ根本的な意図(インテント)を表していますが、エージェントはこれらのバリエーションを理解し、関連情報を抽出し、適切なアクションを決定する必要があります。
**この無限の入力空間とは、実際のユーザーがインタラクションを開始するまで、エージェントの使用方法を完全に予測できないことを意味します。
LLM は小さな変化に対して堅牢ではない
2 番目の重要な違いは、大規模言語モデル(LLM: Large Language Model)がプロンプトの敏感性を持ち、非確定的な振る舞いを示すことです。入力のごくわずかな変化でも異なる出力が生じ、同じ入力であっても結果が異なる場合があります。
これにはいくつかの理由があります。LLM は生成過程で確率的サンプリング(probabilistic sampling)を使用するため、ばらつきが生じます。最も重要なのは、LLM が表現の微妙な違い、文脈、または指示の順序に対する応答が異なることです。
この非確定性(non-determinism)とは、開発段階で観察される振る舞いが、本番環境での実際の挙動と一致しない可能性があることを意味します。テストでは確実に機能するプロンプトでも、遭遇しなかったエッジケース(境界ケース)で失敗することがあります。評価時には正しくツールを使用していたエージェントでも、わずかに異なる表現のユーザークエリに対して、たまに間違ったツールを選択することがあります。
エージェントの運用監視は異なる
従来のアプリケーションパフォーマンスモニタリング(APM)ツールは、レイテンシ、トラフィック、エラー、飽和率といった指標に焦点を当てています。これらはHTTPリクエスト、データベースクエリ、システムリソースを追跡します。これらは、考えられるコードパスが既知の構造化された決定論的なシステム向けに設計されています。
エージェントの観測可能性(Observability)には、周囲のシステム指標だけでなく、入力と出力そのものを監視することが必要です。
自然言語インタラクションの監視
エージェントがユーザーと会話を交わす際、主要なシグナルは会話そのものの中にあります。以下をキャプチャする必要があります:
- 完全なプロンプトとレスポンスのペア:リクエストが発生したという事実だけでなく、ユーザーが何を尋ねたか、エージェントがどのように応答したか
- 複数ターンにわたるコンテキスト:エージェントはしばしば1つの会話の一部として複数のやり取りを通じて動作するため、関連するインタラクションをグループ化する必要があります
- エージェントの軌跡と中間ステップ:エージェントは最終的な出力に到達するために多段階のパスをたどり、ツールを呼び出し、選択肢について推論します。最終的な応答だけでなく、軌跡の各ステップへの可視性が必要です
これは従来のロギングとは質的に異なります。従来のWebリクエストは「POST /api/checkout 200 OK 342ms」と要約されることがあります。エージェントのインタラクションは、数十のステップを含む可能性のある自然言語の会話であり、その成否をステータスコードから判断することはできません。
大規模な人間判断の課題
自然言語での対話は、適切に評価するために人間の判断を必要とすることがよくあります。この回答は役に立ったか?エージェントはユーザーの意図を理解しただろうか?トーンは適切だったか?関連する情報を取得できただろうか?
開発段階では、これは管理可能です。トレースを手動で確認し、プロンプトを調整して反復します。しかし、本番環境では、何千、あるいは数百万もの対話を処理している可能性があります。人間のレビュアーは1時間あたり50〜100件のトレースを意味のある形で評価できますが、1日あたり1,000リクエストの場合、完全な手動レビューには毎日10〜20時間の専用人間の時間が必要です。これは重要な問いを提起します:手動レビューがスケーリングできない場合、どのようにして人間の知能を生データに持ち込むのか?
私たちは、2つの補完的なアプローチが効果的であることを発見しました。
構造化された人間レビューのための注釈キュー
注釈キューは、人間のレビューを可能な限り効率的に行うのを支援します。レビュアーが生ログの中から検索するよう求めるのではなく、注釈キューは事前定義された評価基準(ルーブリック)を用いた構造化形式で特定のランを表示します。
効果的な注釈キューシステムでは、以下が可能になります:
- 特定のトレースをレビュー用にルーティングする:すべてを確認するのではなく、特定のサブセット(否定的なフィードバックがあった実行、高コストのインタラクション、または特定の時間窓からのクエリなど)をキューに送信します。
- レビュー基準を定義する:レビュアーが評価すべき内容を正確に理解できるよう、ルーブリック(評価基準)を設定します(関連性、正しさ、トーン、安全性など)。
- チームコラボレーションを有効にする:複数のレビュアーが進捗状況の追跡と役割割り当てを行いながらキューを処理できます。
- フィードバックループを作成する:レビューされたデータには修正注釈を付け、評価用データセットに追加できます。
アノテーションキューは、新しい失敗モードを理解しようとしている場合、評価者用のトレーニングデータを構築する場合、または専門的なクエリに対する専門家のドメインフィードバックを得ようとしている場合に特に価値があります。
検討すべきトレードオフ:アノテーションキューには専用のレビュアー時間が必要であり、改善サイクルにレイテンシ(遅延)をもたらす可能性があります。包括的なカバレッジを試みるのではなく、特定の高精度なトレースに焦点を当てる場合に最も効果的であることがわかっています。
人間判断のプロキシとしてのLLM
2つ目のアプローチは、LLM(大規模言語モデル)自体を使用して人間の判断をスケールさせることです。LLMは完璧な評価者ではありませんが、人間では不可能な規模で多くの品質次元を評価できます。
具体的には、オンライン評価器 を構成し、すべての実行またはサンプリングされたサブセットに対して、本番環境のトラフィックに対して自動的に評価を実行させることができます。これらの評価器は以下を確認できます:
- 参照なしの品質指標:正解(ground truth)を必要としない、一貫性やトーンなどの属性
- 安全性とコンプライアンス:回答に機密情報が含まれているか、ポリシーに違反しているか、有害な振る舞いを見せるかどうか
- フォーマット検証:出力が期待される構造に従っているか、必要な要素を含んでいるかどうか
- トピック分類:ユーザーが行っているリクエストのカテゴリ
LLM は、人間のレビューを超えた規模で自然言語を評価できます。人間が数十件のトレースを確認するのに対し、LLM 評価器は数千件を評価し、潜在的な問題をフラグ付けして集計指標を提供します。
ただし、LLM ベースの評価には独自の費用と制約も生じます:
- レイテンシ:評価者は各トレースに数秒のレイテンシを追加する可能性があり、これは非同期バッチ評価では許容できる場合でも、同期ユーザーフィードバックには適さない場合があります。
- コスト:すべてのトレースを評価すると推論コストが増加するため、通常はトラフィックの10〜20%をサンプリングすることをお勧めします。
- 精度:市販の評価ツールは、特定のアプリケーションにおける「良い」の基準を反映していない可能性があります。ユースケースに合わせたカスタムLLM-as-judge評価者がしばしば必要ですが、それらが人間の判断と一致することを確認することも困難です。私たちは、チームがカスタム評価者を大規模に信頼する前に、人間のラベルに対して適切に調整されていることを検証できるよう、「Align Evals」を開発しました。
- 評価のドリフト:本番環境でのトラフィックが変化すると、評価者の調整や置き換えが必要になる場合があります。
これらの理由から、LLM評価者のみに依存するのではなく、自動評価と定期的な人間のレビューを組み合わせることをお勧めします。
エージェントのための効果的な本番環境での観測可能性(Observability)を構築するには、汎用モニタリングツールが提供するように設計されていない特定の機能セットが必要です。私たちは数十の本番環境デプロイメントで観察したパターンに基づき、以下の機能をLangSmithに組み込みました。
Insights Agent:使用状況とエラーパターンの発見
本番環境におけるより困難な側面の1つは、ユーザーがあなたのエージェントをどのように使用しているかを理解することです。
プロダクション環境でのトレースをチームがどのように活用しているかを分析した際、事前に何を検索するかを指定せずにパターンを自動的に発見する方法が必要であることがわかりました。この洞察から、Insights Agent を構築する動機となりました。このエージェントは、類似したトレースをグループ化する自動クラスタリングシステムを使用し、以下の事項の特定を行います:
- 使用パターン:ユーザーが最も一般的に行っているリクエストの種類は何ですか?彼らはどのような機能や能力を使用しようとしていますか?
- エラーモード:エージェントはどこで誤りを犯していますか?不適切なツールの選択、検索失敗、またはユーザーの意図の誤解など、共通する失敗パターンが存在しますか?
- エッジケース:あなたが想定していなかった予期せぬクエリを、ユーザーはどのようなものを送信していますか?

Insights Agent は、使用パターン、エラーモード、またはドメイン固有のカスタム属性に基づいてトレースをグループ化するよう構成できます。また、特定のサブセット(時間ウィンドウ、ユーザーコホート、機能領域)に分析を絞り込み、繰り返し分析のために設定を保存することも可能です。
例えば、埋め込みコパイロットを搭載した企業のプロダクトマネージャーは、「ユーザーは私たちの製品のどの部分を最も頻繁にコパイロットで使用しようとしているのか?」と質問するかもしれません。Insights Agent は数千のトレースを分析し、意図別にグループ化して、主要な使用カテゴリを浮き彫りにします。
品質問題のデバッグを行っているエンジニアは、「自分のエージェントはどこで間違ったツールを選択しているのか?」と問いかけるかもしれません。Insights Agent は、ツール選択の失敗における一般的なパターンを特定し、代表的な例を提供できます。
この自動的なパターン発見により、本番環境のトレース(trace)の量がより管理可能かつ実行可能なものになります。
オンライン評価:継続的な品質モニタリング
以前、人間の判断をスケールさせる方法として オンライン評価 について言及しました。ここでは、実際にどのように機能するかを見ていきましょう。
オンライン評価では、本番環境のトレースに対して自動的に実行される評価器(evaluator)を設定します。以下を構成できます:
- どのトレースを評価するか:すべてのトレース、サンプリングされた割合(通常は10〜20%)、または特定のフィルタリングされたサブセット
- 何を評価するか:品質指標、セキュリティチェック、形式の検証、またはカスタム基準
- アラートを出すタイミング:指標が低下した際に通知をトリガーする閾値
オンライン評価は、従来の「テスト」以上の複数の目的を果たします:
- 品質モニタリング:エージェントが時間とともにどれだけ有用で、関連性があり、正確な回答を生成しているかを追跡できます。これにより、モデルの更新、データドリフト、または新しいユーザーパターンによって品質が低下した時期を検出できます。
- トピックタグ付け:本番環境のクエリを自動的にカテゴリに分類し、製品分析に活用できます。これにより、ユーザーが実際に達成しようとしていることを把握できます。
- 軌跡評価:複数のツールや推論ステップを使用するエージェントの場合、回答に至るまでの適切な経路をたどったかどうかを評価できます。正しいツールを合理的な順序で呼び出したか、関連する情報を取得したかを確認します。
- セキュリティと安全性:出力に含まれる機密情報、ポリシー違反、またはその他の安全上の懸念をリアルタイムで確認できます。

本番トラフィックに対して評価を継続的に実行する能力により、特定の失敗したトレース(trace)に深く入り込み、それらを人間のレビュー用の注釈キュー(annotation queue)に追加し、評価データセットに取り込み、再デプロイする前に修正を検証できる開発ワークフローが可能になります。
ダッシュボードとアラート:重要なモニタリング
最後に、本番環境での観測可能性(observability)には、特定のユースケースに関連する指標に基づくダッシュボードとアラート設定が必要です。効果的な観測可能性プラットフォームは以下の機能を提供します:
- ドメイン固有のインサイト用のカスタムダッシュボードにより、異なるワークフローにおける成功指標(タスク完了率やユーザー満足度スコアなど)を追跡できます。また、モデルバージョン間のパフォーマンス比較や、機能領域ごとのコストとレイテンシの監視も可能です。
- 指標が閾値を超えた場合、WebhookやPagerDutyを通じて柔軟なアラート通知を行います。
- 集計された指標から特定のトレースへのドリルダウン機能

本番環境での観測可能性(Observability)には、エージェントが実際にどのように振る舞うかに関連する特定の指標を追跡することが必要です。標準的なレイテンシやエラーレートを超えて、これはツール呼び出しの失敗率やツールごとの実行回数といった指標を監視することを意味します。これらのシグナルは、システムが単に稼働しているかどうかではなく、エージェントが意図した通りに機能しているかどうかを示します。
重要なのは、技術的な指標だけでなく、ビジネス上重要な指標を監視することです。もちろんレイテンシやエラーレートも重要ですが、ユーザー満足度やエージェントが意図された用途で使用されているかどうかといった指標にも関心があります。
汎用ツールの限界
ここで疑問を持つかもしれません。「DatadogやNew Relicのような従来の観測可能性ツールを使ってこれを作れないのか? なぜ専用プラットフォームが必要なのか?」
多くのチームは、まず従来のAPM(Application Performance Monitoring)ツールを使用してエージェントの監視を試みます。私たちは、これが基本的なメトリクス(レイテンシやエラーレート)には機能することを確認していますが、エージェント固有の要件に対しては限界があることに気づきました。そのギャップは、ペイロード、接続性、ユーザーの3つの領域で顕著になります。
ペイロード:自然言語データ
従来のAPMツールは、構造化されたログや数値メトリクスに最適化されています。マルチターンコンテキストを含む完全な会話スレッドを保存、検索、分析する必要がある場合、異なる要件が発生します:
- ストレージスケール:本番環境の規模での完全なプロンプトとレスポンスのペアを保存するには、大きなストレージ容量が必要です。キーワードマッチングだけでなく、プロンプトに対するセマンティック検索(意味論的検索)機能が必要です。また、システムメッセージやフューショット例(few-shot examples:数例提示による学習手法)を含む完全なコンテキストを保持する必要があります。
- データモデル:会話スレッドと状態を維持するには、従来のトレース(trace:処理の流れを追跡するログ)とは異なるデータ構造が必要です。
私たちは、チームがAPMツールの上にこれを構築しているのを見てきましたが、それには大幅なカスタム開発が必要です。
接続性:開発ループとの統合
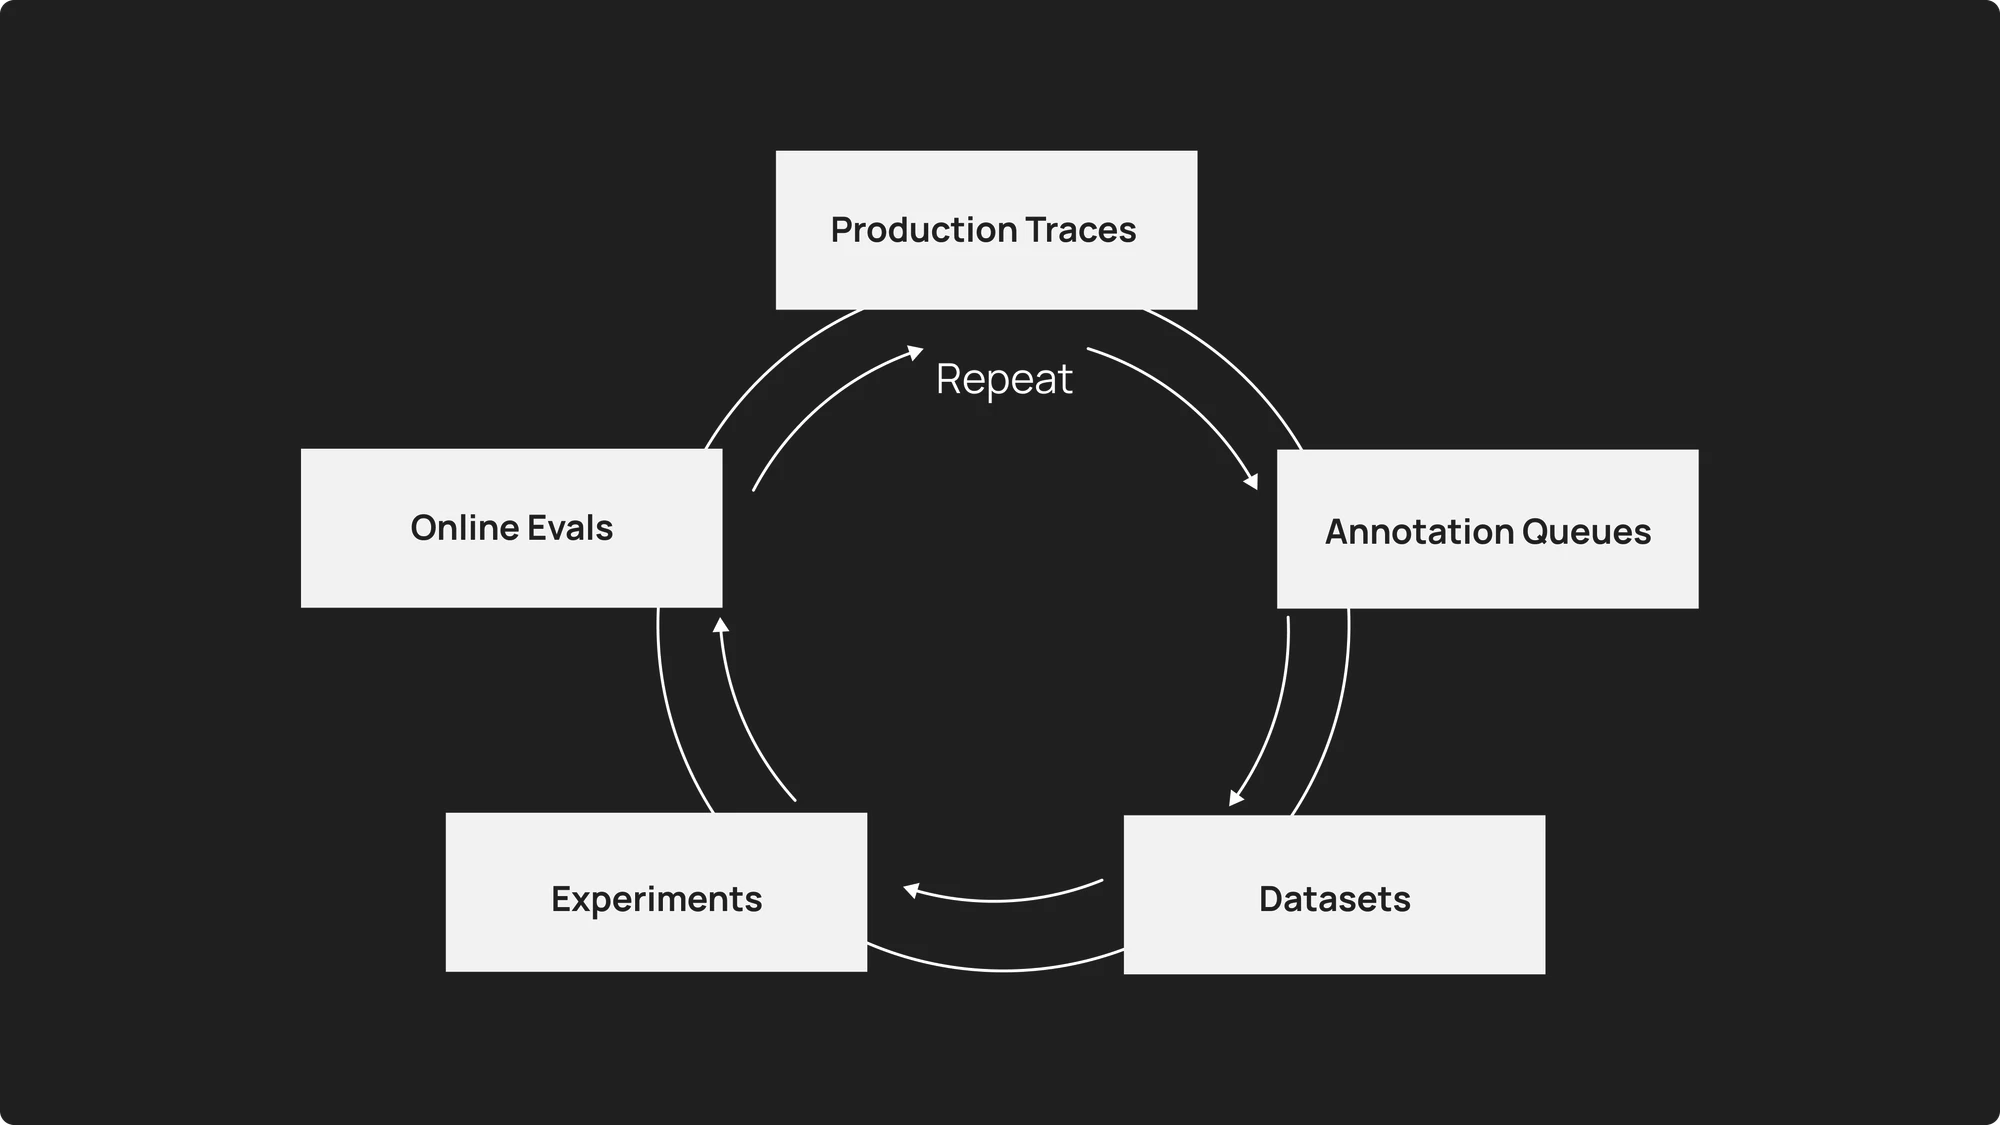
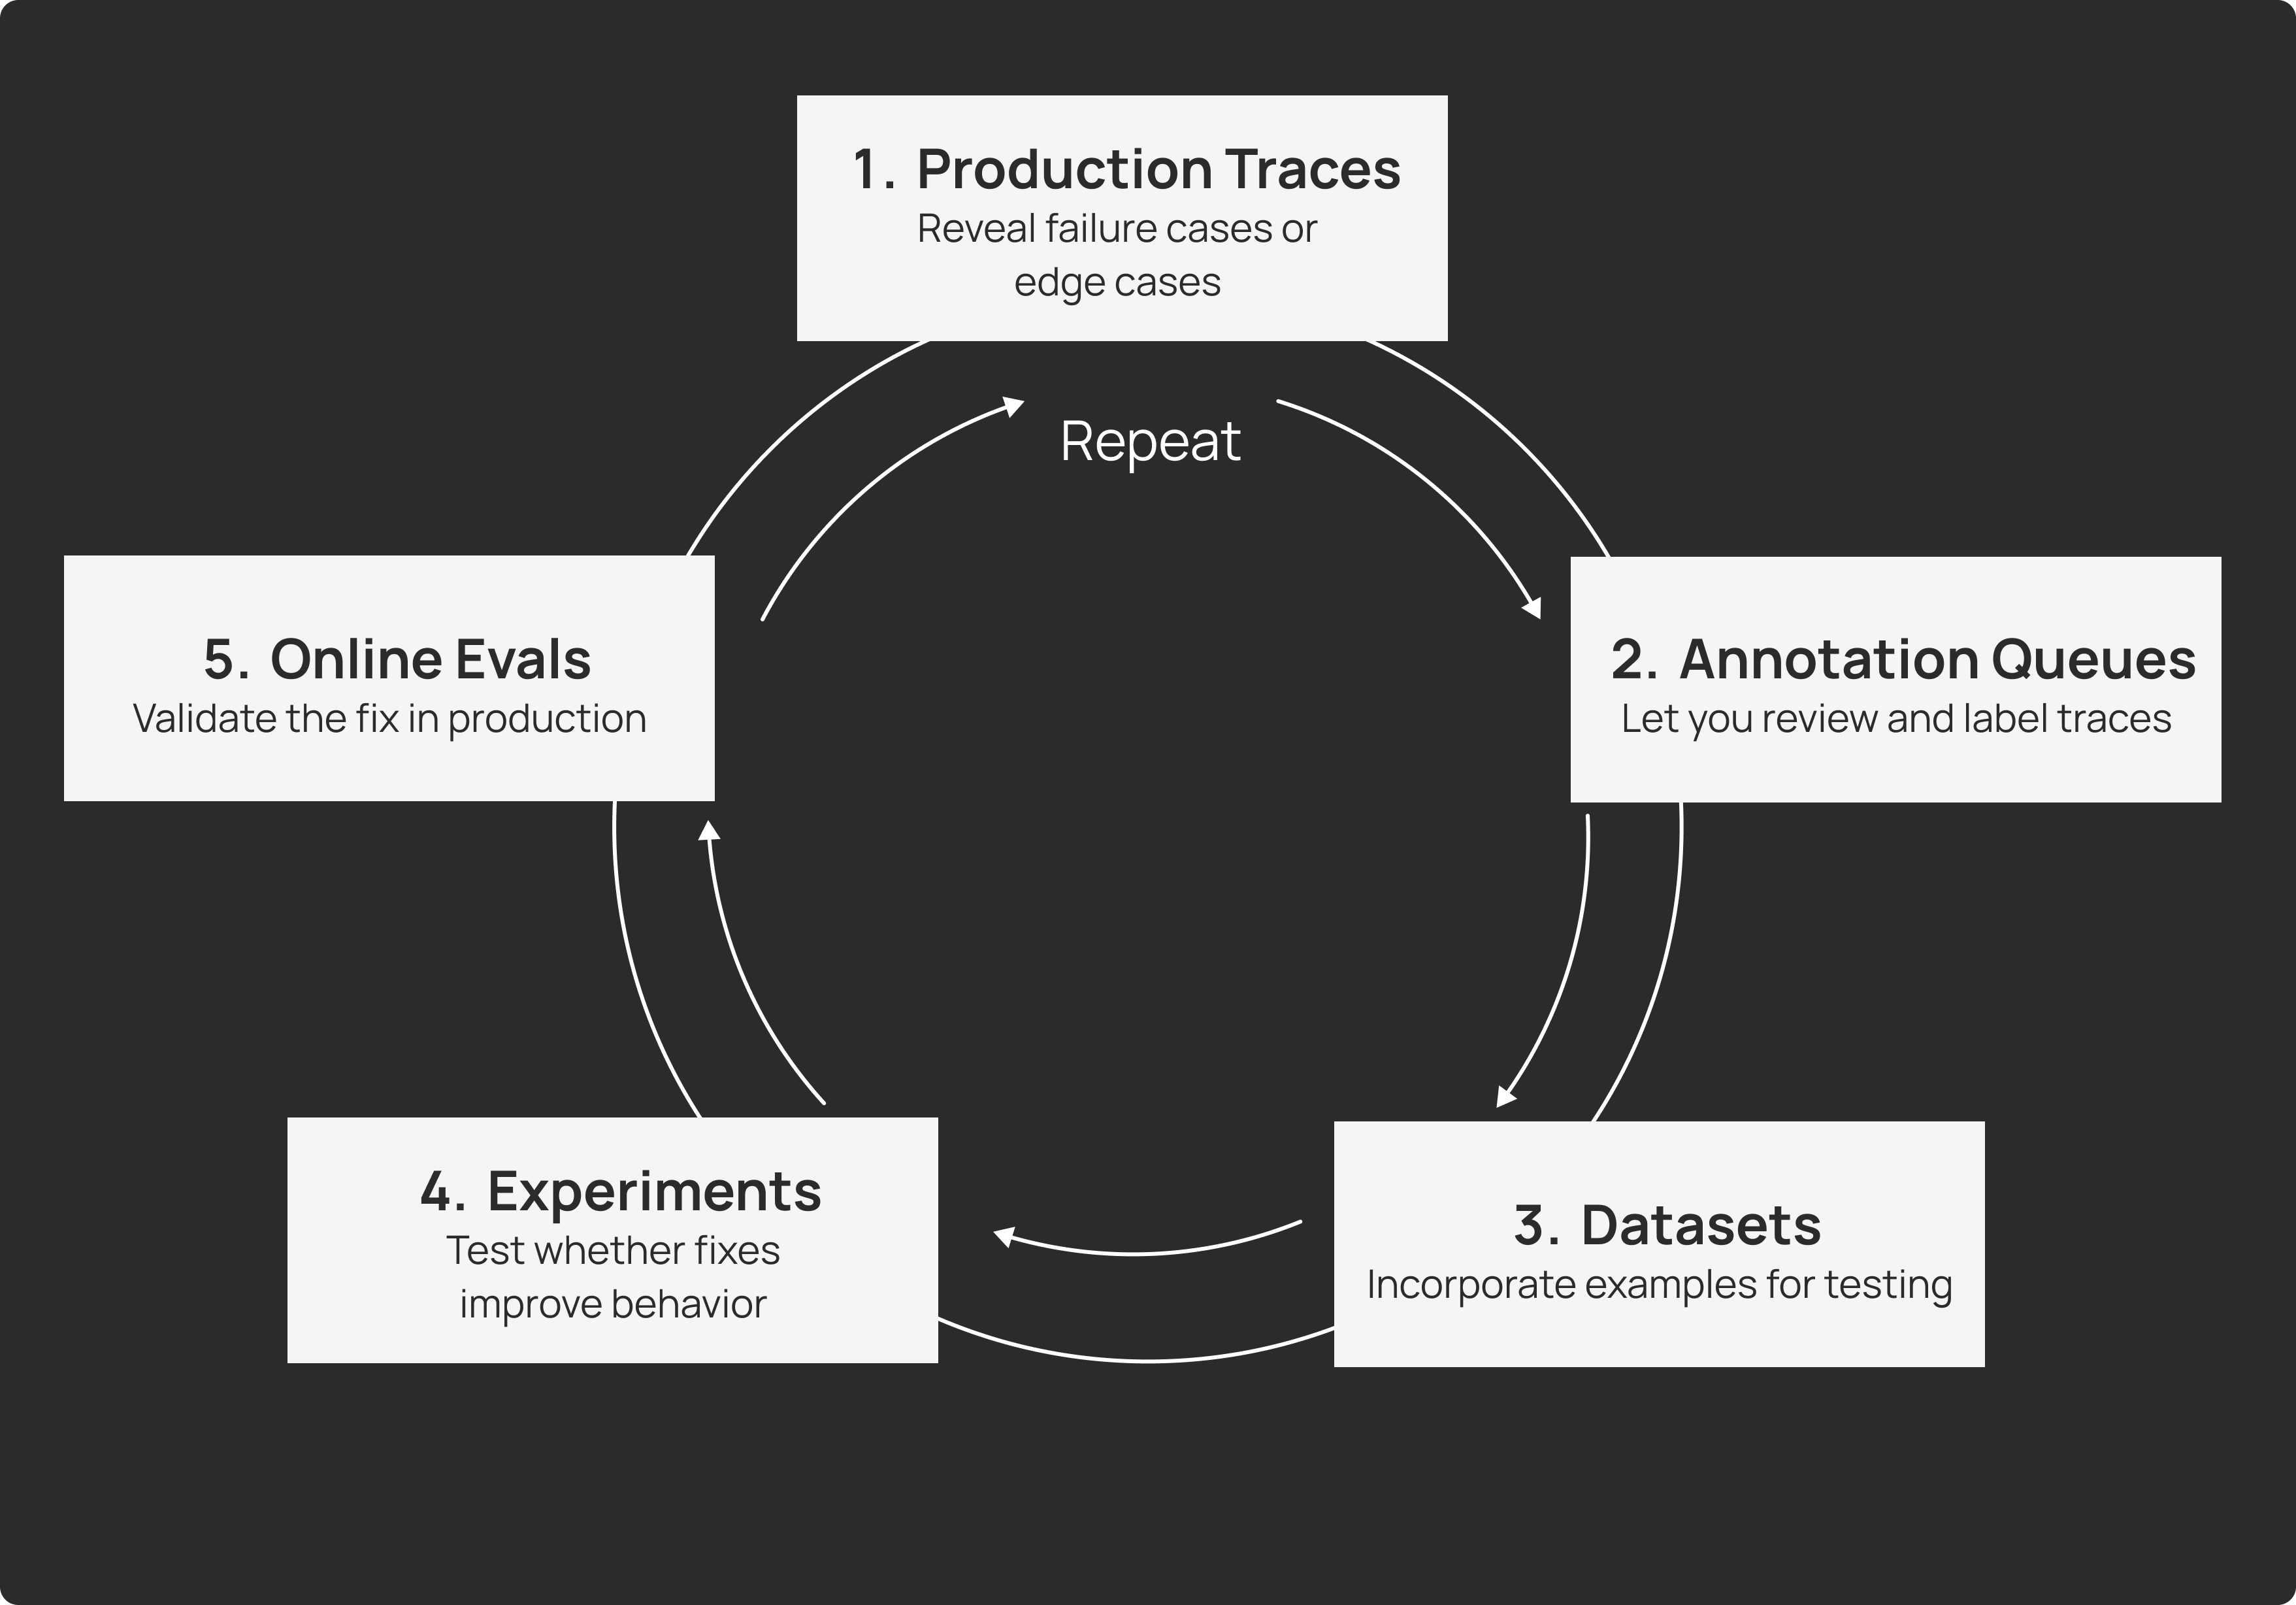
エージェントの観測可能性(observability)は、エージェントの開発ワークフローと深く結びついており、ここでは本番環境の監視、評価データセット、実験、再デプロイの間でデータを継続的に移動させる必要があります。このループは以下のようになります:
- 本番環境のトレースは、失敗ケースやエッジケースを明らかにします
- アノテーションキューにより、それらのレビューとラベル付けが可能になります
- データセットにはテスト用にこれらの例が組み込まれます
- 実験により、修正が動作の改善につながるかどうかを検証します
- オンライン評価は、本番環境での修正の有効性を検証します
これには、観測プラットフォーム、評価フレームワーク、開発ツールの間の密接な統合が必要です。従来の観測ツールとは異なり、LangSmith はこの接続性を提供します。失敗した本番環境のトレースをクリックして、すぐにデータセットに追加し、プレイグラウンド環境でプロンプトを修正し、新旧バージョンを比較する実験を実行し、自信を持って再デプロイすることができます。
ユーザー:クロスファンクショナルチーム
最後に、エージェントの観測にアクセスする必要がある人々は、通常 APM ツールを使用する人々とは異なります。従来の観測は、システムの健全性、パフォーマンスの劣化、インフラストラクチャの問題の改善に焦点を当てた SRE および DevOps チームによって主に使用されます。
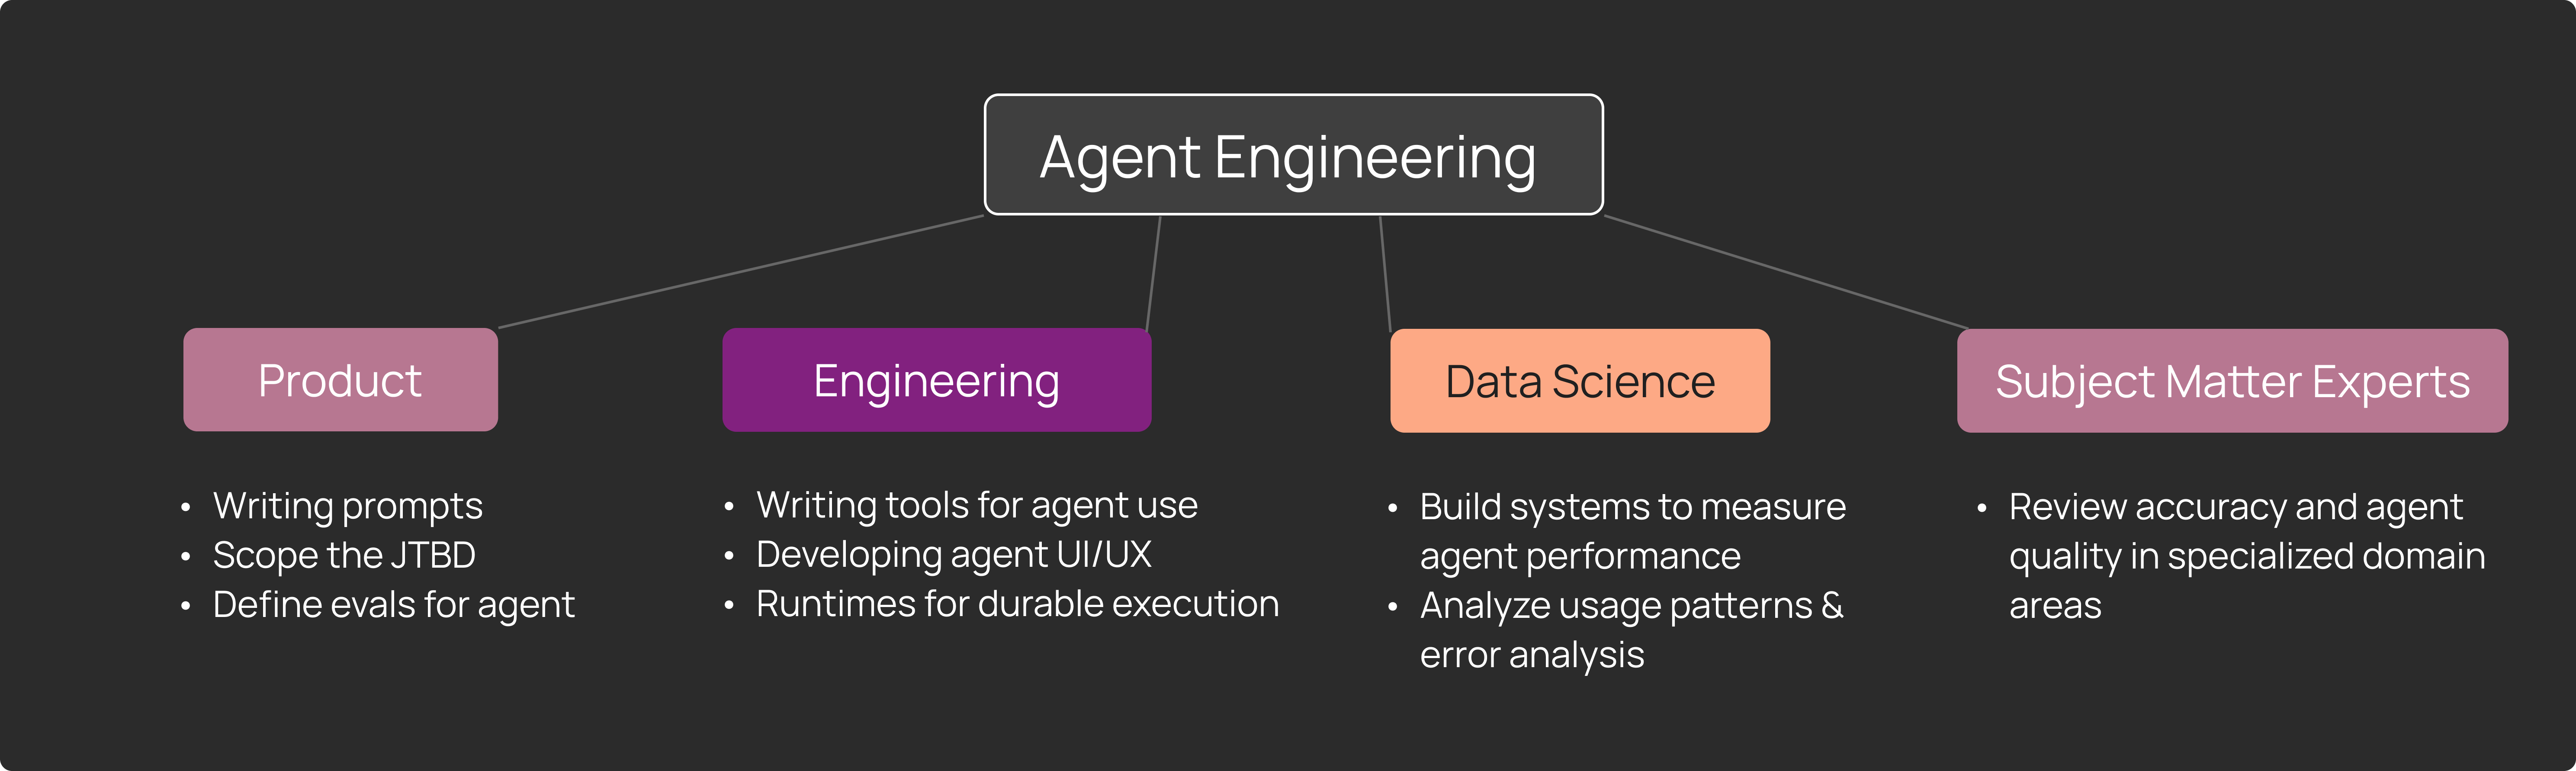
エージェントの観測は、以下を含むクロスファンクショナルチーム向けです:
- プロンプトの問題やモデルの動作をデバッグする AI/ML エンジニア
- 使用パターンや機能リクエストを理解するプロダクトマネージャー
- 専門分野における正確性と品質を検証するドメインエキスパート(SMEs)
- パターンを分析し、評価基準を構築するデータサイエンティスト
私たちは、エージェントの観測可能性(Agent Observability)が、これらのチームがユーザー体験を向上させるためにどのように連携するかの中核となることを観察してきました。彼らは定期的に本番環境のトレース(traces)に関するデータレビューを行い、パターンについて議論し、観察結果に基づいて優先順位に関する意思決定を行っています。
これには、インフラストラクチャエンジニアだけでなく、これらのペルソナ間でのコラボレーションを目的として設計されたインターフェースとワークフローが必要です。
開かれた課題
私たちが記述したアプローチは、大規模にエージェントを展開するチームにとって効果的であることが証明されていますが、依然として重大な課題が残っています。
- 評価者の精度と信頼性:LLM(大規模言語モデル)による評価は、モデルの進化に伴って改善され続けていますが、完璧ではありません。自動化された評価を信頼すべき場合と人間のレビューが必須となる場合を見極めることは、文脈に依存します。
- スケーリング時のコスト:高ボリュームの生産環境における包括的なモニタリングは高額になる可能性があります。サンプリング、自動化された評価、人間のレビューの適切なバランスを見つけることは、継続的な最適化の課題です。
- プライバシーとコンプライアンス:プライバシー制約を尊重し、機密データを適切に処理しながら完全なプロンプトとレスポンスのペアを取得することは、観測可能性(オブザビリティ)インフラストラクチャに複雑さを加えます。
結論
エージェントは従来のソフトウェアとは異なる動作をします。自然言語の入力を受け取り、非確定的な振る舞いを示し、複雑な推論チェーンを通じて意思決定を行います。これらの特徴により、生産環境でのモニタリングの焦点はシステム指標から、実際の入力と出力そのものへとシフトします。
私たちが記述したアプローチ(構造化注釈キュー、自動化されたパターン発見、継続的評価)は、エージェントを展開するチームとの連携で観察したパターンに基づき、LangSmith を構築してこれらの要件に対処しました。これらは、大規模なスケールで生産環境におけるエージェントの動作を観測可能かつ改善可能にするための、現在の私たちの考え方を表しています。
エージェントの観測性(Observability)に取り組んでいる場合、効果的なアプローチについてぜひお聞かせください。LangSmith Observability について詳しく学ぶか、ドキュメントをお読みください。
追加資料
以下の方法について学びましょう:
- Monday はオンライン評価を活用して、顧客向けエージェントの監視を行っています。
- Appfolio は LangSmith を活用し、本番環境での問題監視と特定を行っています。
- Podium はユーザーフィードバックを収集し、オンライン評価を実行して応答品質の向上を図っています。
- Jimdo は、品質スコアやツール出力品質など、エージェントのメトリクスを監視しています。
関連コンテンツ
概念ガイド
ディープエージェント(Deep Agents)
本番環境におけるディープエージェントのランタイム


S. Runkle,
V. Trivedy
2026年4月20日
24分
Harrison's In the Loop
あなたのハネス、あなたのメモリ

ハリスン・チェイス(Harrison Chase)
2026年4月11日
7分
ハリスンの『イン・ザ・ループ』(In the Loop)
AIエージェントのための継続的学習(Continual learning)
ハリスン・チェイス(Harrison Chase)
2026年4月5日
4分

エージェントの実際の動作を可視化する
LangSmithは、当社のエージェントエンジニアリングプラットフォームであり、開発者がすべてのエージェントの意思決定をデバッグし、評価(eval)の変更を確認し、ワンクリックでデプロイできるように支援します。
原文を表示
You don’t know what your agent will do until it’s in production
Key Takeaways
You can't monitor agents like traditional software. Inputs are infinite, behavior is non-deterministic, and quality lives in the conversations themselves. This article explains what to monitor, how to scale evaluation, and how production traces become the foundation for continuous improvement.
When you ship traditional software to production, you have a good sense of what to expect. Users click buttons, fill out forms, navigate through predetermined paths. Your test suite might cover 80-90% of code paths, and monitoring tools track the usual suspects: error rates, response times, database queries. When something breaks, you look at stack traces and logs.
Agents operate differently. They accept natural language input, where the space of possible queries is unbounded. They're powered by large language models that are sensitive to subtle variations in prompts and can produce different outputs for the same input. And they make decisions through multi-step reasoning chains, tool calls, and retrieval operations that are difficult to fully anticipate during development.
This means that production monitoring for agents requires different capabilities than traditional observability. In this post, we'll explore why agent observability has distinct challenges, what you need to monitor, and what we've learned from teams deploying agents at scale.
Why agents are different from traditional software
Working with teams deploying agents to production, we've observed two key distinctions that affect monitoring approaches.
Agent have an infinite input space
Traditional software has a finite, constrained input space. Users interact through buttons, dropdowns, forms, and API calls with specific formats. When you design a checkout flow, you know the exact sequence of screens and possible user actions. Your error handling can be comprehensive because you can enumerate the failure modes.
Agents, by contrast, accept natural language as their primary input. Natural language has no fixed set of valid inputs. Users can phrase the same request in countless ways — vague or specific, formal or casual, combining multiple intents in a single message or spreading a single request across multiple turns.
Consider a customer support agent. In traditional software, users would navigate to "Order History," click on an order, click "Request Refund," and finally fill out a form with predefined options. The path is fixed and testable.
With an agent, users might say:
- "I want to return my order"
- "Can you help me get my money back for the shoes I bought last week?"
- "The item I received is damaged, what are my options?"
- "order #12345 refund please"
Each represents the same underlying intent, but the agent needs to understand the variation, extract the relevant information, and determine the appropriate actions.
This infinite input space means you cannot fully predict how your agent will be used until real users start interacting with it.
LLMs are not robust to small changes
The second key difference is that LLMs exhibit prompt sensitivity and non-deterministic behavior. Even small variations in input can lead to different outputs, and the same input can sometimes produce different results.
This happens for several reasons. LLMs use probabilistic sampling during generation, which introduces variance. Most importantly, LLMs respond differently to subtle changes in phrasing, context, or instruction ordering.
This non-determinism means that the behavior you observe in development may not match what happens in production. A prompt that works reliably in testing might fail on edge cases you didn't encounter. An agent that correctly uses tools during evaluation might occasionally select the wrong tool for user queries with slightly different phrasing.
Production monitoring for agents is different
Traditional Application Performance Monitoring (APM) tools focus on metrics like latency, traffic, errors, and saturation. They track HTTP requests, database queries, and system resources. They're designed for structured, deterministic systems where you know the possible code paths.
Agent observability requires monitoring the inputs and outputs themselves, not just the system metrics around them.
Monitoring natural language interactions
When your agent is having conversations with users, the primary signal lives in the conversations themselves. You need to capture:
- Complete prompt-response pairs: Not just that a request happened, but what the user asked and what the agent responded
- Multi-turn context: Agents often operate across multiple exchanges as part of one conversation, so you need to group related interactions together
- Agent trajectory and intermediate steps: Agents can take multi-step paths to reach a final output, calling tools and reasoning through options. You need visibility into each step of the trajectory, not just the final response
This is qualitatively different from traditional logging. A traditional web request might be summarized as "POST /api/checkout 200 OK 342ms." An agent interaction is a natural language conversation with potentially dozens of steps — and the question of whether it went well isn't answerable from the status code.
The challenge of human judgment at scale
Natural language interactions often require human judgment to evaluate properly. Is this response helpful? Did the agent understand the user's intent? Was the tone appropriate? Did it retrieve relevant information?
During development, this is manageable — you review traces manually, tweak prompts, and iterate. But in production, you might be handling thousands or millions of interactions. Human reviewers can meaningfully assess 50-100 traces per hour, but at 1,000 requests per day, full manual review would require 10-20 hours of dedicated human time, daily. This raises an important question: how do you bring human intelligence to production data when manual review doesn't scale?
We've found two complementary approaches effective.
Annotation queues for structured human review
Annotation queues help make human review as efficient as possible. Rather than asking reviewers to hunt through production logs, an annotation queue presents specific runs in a structured format with a predefined rubric.
An effective annotation queue system lets you:
- Route specific traces for review: Instead of reviewing everything, send particular subsets to the queue (runs with negative feedback, high-cost interactions, or queries from a specific time window)
- Define review criteria: Set up rubrics so reviewers know exactly what to evaluate (relevance, correctness, tone, safety)
- Enable team collaboration: Multiple reviewers can work through queues with progress tracking and role assignments
- Create feedback loops: Reviewed data can be annotated with corrections and added to evaluation datasets

Annotation queues are especially valuable when you're trying to understand a new failure mode, build up training data for evaluators, or get expert domain feedback on specialized queries.
Trade-offs to consider: Annotation queues require dedicated reviewer time and can introduce latency into the improvement cycle. We've found they work best when focused on specific high-value traces rather than attempting comprehensive coverage.
LLM as a proxy for human judgment
The second approach is to use LLMs themselves to scale human judgment. While LLMs aren't perfect evaluators, they can assess many quality dimensions at a scale that humans cannot.
In particular, you can configure online evaluators to run automatically on production traffic, either on all runs or on a sampled subset. These evaluators can check:
- Reference-free quality metrics: Attributes like coherence and tone that don't require a ground truth answer
- Safety and compliance: Whether responses contain sensitive information, violate policies, or exhibit harmful behavior
- Format validation: Whether outputs follow expected structures or contain required elements
- Topic classification: What categories of requests users are making
LLMs can assess natural language at a scale beyond human review. While humans might review dozens of traces, an LLM evaluator can assess thousands, flagging potential issues and providing aggregate metrics.
However, LLM-based evaluations also introduce their own costs and constraints:
- Latency: Evaluators can add a few seconds of latency per trace, which may be acceptable for async batch evaluation but not for synchronous user feedback
- Cost: Evaluating all traces can add to your inference costs, which is why we typically recommend sampling 10-20% of traffic
- Accuracy: Off-the-shelf evaluators may not reflect what "good" means for your specific app. Custom LLM-as-judge evaluators aligned to your use case are often necessary, but ensuring they agree with human judgment can also be difficult. We built Align Evals to help teams validate their custom evaluators are calibrated against human labels before you trust them at scale.
- Evaluation drift: As production traffic shifts, evaluators may need retuning or replacement
For these reasons, we recommend combining automated evaluation with periodic human review rather than relying solely on LLM evaluators.
Building effective production observability for agents requires a specific set of capabilities, most of which general-purpose monitoring tools weren't designed to provide. Based on patterns we observed across dozens of production deployments, we built the following into LangSmith.
Insights Agent: Discovering usage and error patterns
One of the more challenging aspects in production is simply understanding what users are doing with your agent.
When we analyzed how teams were using production traces, we found they needed a way to automatically discover patterns without specifying what to look for upfront. This motivated us to build Insights Agent, which uses an automated clustering system that groups similar traces to identify:
- Usage patterns: What are the most common types of requests users make? Which features or capabilities are they trying to use?
- Error modes: Where is the agent making mistakes? Are there common failure patterns like incorrect tool selection, retrieval failures, or misunderstanding user intent?
- Edge cases: What unexpected queries are users sending that you didn't account for?
Insights Agent can be configured to group traces by usage patterns, failure modes, or custom attributes specific to your domain. You can also filter the analysis to specific subsets (time windows, user cohorts, feature areas) and save configurations for repeated analysis.
For example, a product manager at a company with an embedded copilot might ask: "What parts of our product are users trying to use the copilot for most often?" Insights Agent can analyze thousands of traces, group them by intent, and surface the top usage categories.
An engineer debugging quality issues might ask: "Where is my agent selecting the wrong tools?" Insights Agent can identify common patterns in tool selection failures and provide representative examples.
This automated pattern discovery helps make the volume of production traces more manageable and actionable.
Online Evaluations: Continuous quality monitoring
We mentioned online evaluations earlier as a way to scale human judgment. Let's look at how they work in practice.
With online evaluations, you set up evaluators that run automatically on production traces. You can configure:
- Which traces to evaluate: All traces, sampled percentages (typically 10-20%), or specific filtered subsets
- What to evaluate: Quality metrics, safety checks, format validation, or custom criteria
- When to alert: Thresholds that trigger notifications when metrics degrade
Online evaluations serve several purposes beyond traditional "testing":
- Quality monitoring: You can track how often the agent produces helpful, relevant, correct responses over time. This allows you to detect when quality degrades due to model updates, data drift, or new user patterns.
- Topic tagging: You can automatically classify production queries into categories for product analytics. This gives you visibility into what users are actually trying to accomplish.
- Trajectory evaluation: For agents that use multiple tools or reasoning steps, you can evaluate whether the agent took an appropriate path to the answer. Did it call the right tools in a sensible order? Did it retrieve relevant information?
- Security and safety: You can check for sensitive information in outputs, policy violations, or other safety concerns in real time.
The ability to run evaluations continuously on production traffic enables a development workflow where you can drill into specific failing traces, add them to annotation queues for human review, incorporate them into evaluation datasets, and test fixes before redeploying.
Dashboards and alerts: Monitoring what matters
Finally, production observability requires dashboards and alerting on metrics that matter to your specific use case. Effective observability platforms provide:
- Custom dashboards for domain-specific insights, allowing you to track success metrics (such as task completion rates or user satisfaction scores) for different workflows. You can also compare performance across model versions and monitor cost and latency by feature area
- Flexible alerting via webhooks or PagerDuty when metrics cross thresholds
- Drill-down capabilities from aggregate metrics into specific traces
Production observability requires tracking metrics specific to how agents actually behave. Beyond standard latency and error rates, this means monitoring metrics like tool call failure rates and run count by tool. These signals tell you whether the agent is actually working as intended, not just whether the system is running.
The key is monitoring business-critical metrics, not just technical ones. Yes, you care about latency and error rates. But you also care about metrics like user satisfaction, and whether the agent is being used for the intended purposes.
Why general-purpose tools fall short
At this point, you might wonder: couldn't I build this with traditional observability tools like Datadog or New Relic? Why do I need a specialized platform?
Many teams initially attempt to monitor agents using traditional APM tools. We've found this works for basic metrics (latency, error rates) but encounters limitations with agent-specific requirements. The gaps emerge in three areas: payloads, connectivity, and users.
Payloads: Natural language data
Traditional APM tools are optimized for structured logs and numeric metrics. When you need to store, search, and analyze full conversation threads with multi-turn context, you encounter different requirements:
- Storage scale: Full prompt-response pairs at production scale require significant storage. You need semantic search capabilities over prompts, not just keyword matching. And you need to preserve full context including system messages and few-shot examples.
- Data models: Maintaining conversation threads and state require different data structures than traditional traces.
We've seen teams build this on top of APM tools, but it requires significant custom development.
Connectivity: Integration with the development loop
Agent observability is deeply connected to the agent development workflow, where you should be continuously moving data between production monitoring, evaluation datasets, experimentation, and redeployment. The loop looks like:
- Production traces reveal failure cases or edge cases
- Annotation queues let you review and label them
- Datasets incorporate these examples for testing
- Experiments test whether fixes improve behavior
- Online evaluations validate the fix in production
This requires tight integration between your observability platform, your evaluation framework, and your development tools. Unlike traditional observability tools, LangSmith provides this connectivity. You can click a failing production trace and immediately add it to a dataset, modify your prompt in a playground environment, run an experiment comparing the old and new versions, and redeploy with confidence.
Users: Cross-functional teams
Finally, the people who need access to agent observability are different from those who typically use APM tools. Traditional observability is primarily for SRE and DevOps teams, who are focused on improving system health, performance regressions, and infrastructure issues.
Agent observability is for cross-functional teams, including:
- AI/ML engineers debugging prompt issues and model behavior
- Product managers understanding usage patterns and feature requests
- Subject matter experts (SMEs) reviewing accuracy and quality in specialized areas
- Data scientists analyzing patterns and building evaluations
We've observed that agent observability becomes central to how these teams work together to improve the user experience. They regularly do data reviews of production traces, discuss patterns, and make decisions about priorities based on what they observe.
This requires an interface and workflow designed for collaboration across these personas, not just for infrastructure engineers.
Open challenges
While the approaches we've described have proven effective for teams deploying agents at scale, significant challenges remain:
- Evaluator accuracy and reliability: LLM evaluators continue to improve as models get better, but they aren’t perfect. Understanding when to trust automated evaluation versus requiring human review remains context-dependent.
- Cost at scale: Comprehensive monitoring of high-volume production systems can be expensive. Finding the right balance of sampling, automated evaluation, and human review is an ongoing optimization.
- Privacy and compliance: Capturing full prompt-response pairs while respecting privacy constraints and handling sensitive data appropriately adds complexity to observability infrastructure.
Conclusion
Agents operate differently from traditional software. They accept natural language inputs, exhibit non-deterministic behavior, and make decisions through complex reasoning chains. These characteristics shift the focus of production monitoring from system metrics to the actual inputs and outputs themselves.
The approaches we've described (structured annotation queues, automated pattern discovery, and continuous evaluation) represent our current thinking on how to make production agent behavior observable and improvable at scale. We built LangSmith to address these requirements based on patterns we observed working with teams deploying agents.
If you're working on agent observability, we'd be interested to hear what approaches you've found effective. Learn more about LangSmith Observability or read our documentation.
Additional Reading
Learn how:
- Monday uses online evaluations to monitor their customer-facing agents
- Appfolio leverages LangSmith to monitor and pinpoint issues in production
- Podium collects user feedback and performs online evals to improve response quality
- Jimdo monitors agent metrics including quality scores and tool quality output
Related content
Conceptual Guide
Deep Agents
The runtime behind production deep agents
S. Runkle,
V. Trivedy
April 20, 2026
24
min
Harrison's In the Loop
Your harness, your memory
Harrison Chase
April 11, 2026
7
min
Harrison's In the Loop
Continual learning for AI agents
Harrison Chase
April 5, 2026
4
min
See what your agent is really doing
LangSmith, our agent engineering platform, helps developers debug every agent decision, eval changes, and deploy in one click.
関連記事
カスタムエージェントハネスの構築方法
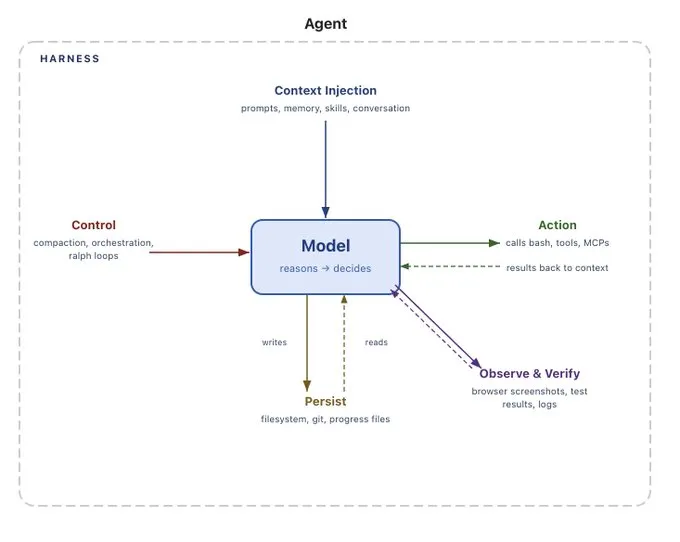
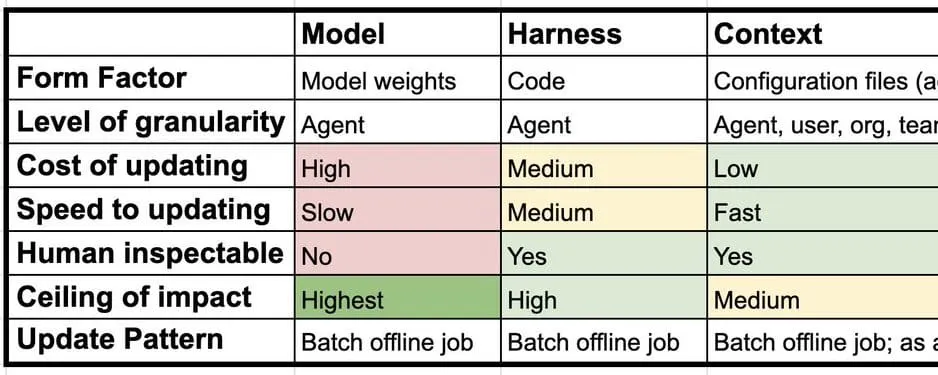
LangChain は、タスクに適切なコンテキストやデータ、環境を接続することで有用なエージェントを構築するにはカスタマイズが重要であると説明し、モデルがツールを呼び出してループ処理を行うエージェントの核心について解説している。
今日は何も大きな出来事はありませんでした
Smol AI News は、5 月 16 日から 18 日にかけての期間に、主要なニュースや技術進展がない静かな日であったと報告しています。
本日は特に目立った出来事なし
AIニュース配信元「AINews」は、2026年5月12日から13日にかけての期間に、主要なSNSや掲示板で注目すべき技術進展や業界動向が確認されなかったと報告した。
今日のまとめ
AI日報で今日の重要ニュースをまとめ読み