毒性のある組み合わせ:小さな信号がセキュリティインシデントに積み上がるとき
Cloudflareは、単一の脆弱性ではなく「デバッグフラグの放置」「認証欠如」「ボットトラフィック」などの微小な異常信号が複合することで重大なセキュリティインシデント(Toxic Combinations)を引き起こす現象を定義し、その検知手法と対策について解説している。
キーポイント
Toxic Combinationsの定義と実態
単体のリクエストでは目立たない「マイナーな設定ミス」や「異常行動」が、攻撃者によって自動化・複合化されることで、システム侵害やデータ漏洩という重大なインシデントへと発展する現象を指す。
Cloudflareの検知フレームワーク
従来のWAFが個々のリクエストの評価に焦点を当てるのに対し、Cloudflareは「ボット信号」「特定のアプリケーションパス(admin/debugなど)」「リクエスト異常(ステータスコード、地理的ジャンプ等)」の交差情報を統合し、コンテキストに基づいて脅威を検知する。
具体的な検知要素と対策
セッションクッキーの欠如、予測可能なID、レートリミットの回避など、複数の文脈を組み合わせることで攻撃意図を特定し、ユーザーに対してスタック内の弱点を特定・修正するための知見を提供する。
「有害な組み合わせ」の発生頻度
WordPressを含む全ホストの約11%が該当するが、WordPressを除外すると0.25%に減少し、稀ではあるものの重大な脆弱性を示す。
攻撃段階の3段階分析
プロービング(スキャン)、有害な組み合わせによるフィルタリング、到達可能なホスト(実際の攻撃成功)の3段階でデータを整理し、誤検知を排除した。
到達可能性の検証の重要性
検出クエリだけでは不十分であり、200 OK応答が偽陽性である可能性を排除するため、認証が必要なパスやリダイレクトなどのノイズを検証する必要がある。
公開された管理パネルのリスク
攻撃者はブルートフォース攻撃やボットネットへの組み込み、既知の脆弱性(CVE)を狙った標的型攻撃、およびユーザー名列挙によるフィッシング準備などの被害をもたらす。
影響分析・編集コメントを表示
影響分析
この記事は、現代のサイバーセキュリティにおいて「防御の厚み」だけでなく、「攻撃者の行動パターン(特に自動化されたプロビジョニング)」に対する監視の重要性を再定義するものである。単一ポイントの脆弱性対策に偏りがちな組織に対し、システム全体のコンテキストを統合して評価するアプローチの必要性を示唆しており、セキュリティ運用の質的転換を促す内容となっている。
編集コメント
単一シグネチャでの検知限界を指摘し、複数信号のコンテキスト統合による脅威検知の重要性を示す実務的な記事です。セキュリティ運用担当者は、ログ分析における「微小な異常の相関」への注目度を高めるべきでしょう。
午前3時、単一のIPアドレスがログインページをリクエストしました。無害です。しかしその後、複数のホストとパスにわたって、同じ送信元が ?debug=true の付加を開始しました。これは、攻撃者が技術スタックを評価し、侵害計画を立てるために環境を探っている兆候です。
軽微な設定ミス、見過ごされたファイアウォールイベント、リクエストの異常などは、単体では無害に感じられます。しかし、これらの小さなシグナルが収束すると、「有害な組み合わせ」として知られるセキュリティインシデントへと爆発的に発展する可能性があります。これは、攻撃者が多くの軽微な問題(ウェブアプリケーションに残されたデバッグフラグや認証が不要なアプリケーションパスなど)を発見し、組み合わせることで、システムを侵害したりデータを窃取したりするエクスプロイトです。
Cloudflareのネットワークは、お客様のスタックへのリクエストを観測しているため、このような有害な組み合わせが形成される過程をデータとして捉え、識別することができます。この記事では、当社のアプリケーションセキュリティデータからこれらのシグナルをどのように浮き彫りにするかを紹介します。最も一般的な種類の有害な組み合わせと、それらがもたらす危険な脆弱性について説明します。また、この知見を活用してスタック内の弱点を特定し、対処する方法についても詳しく説明します。
有害な組み合わせの定義
「有害な組み合わせ」はいくつかの方法で定義できますが、ここでは当社が自社のデータセットをどのように見ているかに基づいた実用的な定義を示します。ほとんどのウェブ攻撃は最終的に自動化によって規模を拡大します。攻撃者が実行可能なエクスプロイトを見つけると、通常はそれをボットにスクリプト化して作業を完了させます。ボットトラフィック、特定のアプリケーションパス、リクエストの異常、設定ミスの交差点を調べることで、潜在的な侵害を発見できます。私たちはこのフレームワークを使用して、毎秒数百万のリクエストを評価しています。
WAF(ウェブアプリケーションファイアウォール)、ボット検出、API保護などのポイントディフェンスは、行動パターンやレピュテーションシグナルを取り入れるように進化してきましたが、依然として個々のリクエストのリスク評価に主眼を置いています。対照的に、Cloudflareの「有害な組み合わせ」検知は、より広範な意図に焦点を移し、複数のシグナルを取り巻くコンテキストの融合を分析することで、醸成されつつあるインシデントを特定します。
コンテキストに基づく検知としての有害な組み合わせ
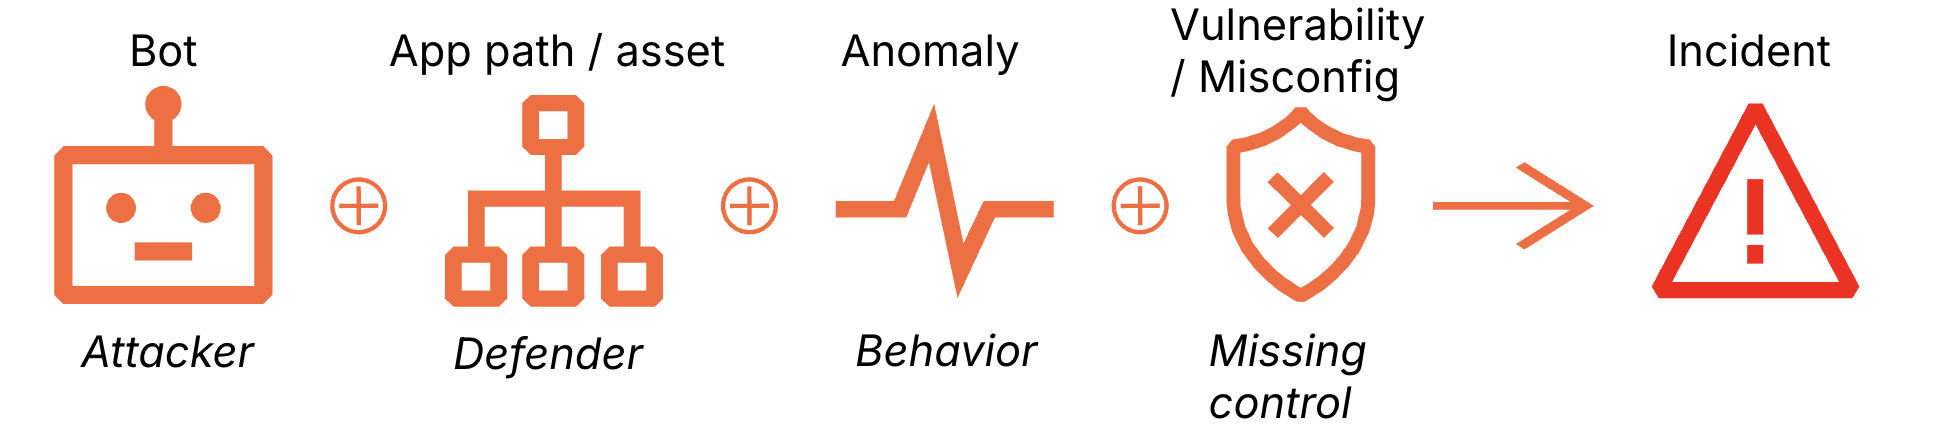
この視点の転換が重要なのは、多くの実際のインシデントには明白なエクスプロイトペイロードも、明確なシグネチャも、「攻撃だ」と叫ぶような単一のイベントも存在しないからです。したがって、以下では、以下のコンテキストを組み合わせて、いくつかの有害な組み合わせを構築します:
- ボットシグナル
- アプリケーションパス(特に機密性の高いもの):admin、debug、metrics、search、決済フロー
- 異常:予期しないHTTPコード、地理的なジャンプ、IDの不一致、高いIDの入れ替わり、レート制限回避(分散したIPが同じことを行う)、リクエストまたは成功率の急増
- 脆弱性または設定ミス:セッションCookieや認証ヘッダーの欠落、予測可能な識別子
一般的なアプリケーションスタックにおける有害な組み合わせの例
一般的なアプリケーションスタックにおいてこれらのパターンが実際にどの程度出現するかを確認するため、Cloudflareデータの24時間分のウィンドウを調査しました。以下の表に示すように、分析したホストの約11%がこれらの組み合わせに対して脆弱でしたが、これは脆弱なWordPressウェブサイトによって偏りが生じています。WordPressサイトを除くと、エクスプロイト可能な有害な組み合わせの兆候を示すホストはわずか0.25%です。稀ではありますが、これらは侵害に対して脆弱なホストを表しています。
データを理解しやすくするため、攻撃の3つの段階に分解しました:
- 調査されたと推定されるホスト数:これは「広範囲な網」です。特定の機密パス(例:
/wp-admin)をターゲットとしたHTTPリクエストが観測されたユニークなホストをカウントします。 - 有害な組み合わせでフィルタリングされたホスト数:ここでは、有害な組み合わせの基準を実際に満たした特定のホストにリストを絞り込みました。
- 到達可能と推定されるホスト数:エクスプロイトの試みに対して正常に応答したユニークなホスト数で、攻撃の「決定的証拠」です。単純な200 OK応答(例:
?debug=trueを付加してトリガーされたもの)は誤検知の可能性があります。200ステータスコードにもかかわらず資格情報を必要とする認証済みパスによるノイズ、真のエクスプロイトパスを隠すリダイレクト、到達不可能なパスに対して成功コードを返すオリジン側の設定ミスを除外するため、パスを検証しました。
次のセクションでは、具体的な調査結果と、それらを導き出した組み合わせの背後にあるロジックについて掘り下げます。提供される検知クエリは必要ですが、到達可能性のテストなしでは十分ではありません。調査結果が誤検知である可能性もあります。場合によっては、Cloudflare Log Explorerを使用して、これらのクエリを非サンプリングのCloudflareログで実行できます。
表1. 有害な組み合わせの概要


複数のアプリケーションホストにわたる機密的管理エンドポイントの調査
#### 検知内容
WordPress管理パネル(/wp-admin)、データベース管理ツール、サーバーダッシュボードなどの一般的な管理ログインページを、自動化ツールがスキャンしているのを観測しました。Cloudflare Log Explorerで実行可能な、テンプレート化されたクエリのバージョンを以下に示します:
SELECT
  clientRequestHTTPHost,
  COUNT(*) AS request_count
FROM
  http_requests
WHERE
  timestamp >= '{{START_DATE}}'
  AND timestamp <= '{{END_DATE}}'
  AND edgeResponseStatus = 200
  AND clientRequestPath LIKE '{{PATH_PATTERN}}' //例: '%/wp-admin/%'
  AND NOT match( extract(clientRequestHTTPHost, '^[^:/]+'), '^\\d{1,3}(\\.\\d{1,3}){3}(:\\d+)?$') // Cloudflare Log Explorerではこの行をコメントアウト
  AND botScore < {{BOT
原文を表示
At 3 AM, a single IP requested a login page. Harmless. But then, across several hosts and paths, the same source began appending ?debug=true — the sign of an attacker probing the environment to assess the technology stack and plan a breach.
Minor misconfigurations, overlooked firewall events, or request anomalies feel harmless on their own. But when these small signals converge, they can explode into security incidents known as “toxic combinations.” These are exploits where an attacker discovers and compounds many minor issues — such as a debug flag left on a web application or an unauthenticated application path — to breach systems or exfiltrate data.
Cloudflare’s network observes requests to your stack, and as a result, has the data to identify these toxic combinations as they form. In this post, we’ll show you how we surface these signals from our application security data. We’ll go over the most common types of toxic combinations and the dangerous vulnerabilities they present. We will also provide details on how you can use this intelligence to identify and address weaknesses in your stack.
How we define toxic combinations
You could define a "toxic combination" in a few different ways, but here is a practical one based on how we look at our own datasets. Most web attacks eventually scale through automation; once an attacker finds a viable exploit, they'll usually script it into a bot to finish the job. By looking at the intersection of bot traffic, specific application paths, request anomalies and misconfigurations, we can spot a potential breach. We use this framework to reason through millions of requests per second.
While point defenses like Web Application Firewalls (WAF), bot detection, and API protection have evolved to incorporate behavioral patterns and reputation signals, they still primarily focus on evaluating the risk of an individual request. In contrast, Cloudflare’s detections for "toxic combinations" shift the lens toward the broader intent, analyzing the confluence of context surrounding multiple signals to identify a brewing incident.
image
Toxic combinations as contextualized detections
That shift in perspective matters because many real incidents have no obvious exploit payload, no clean signatures, and no single event that screams “attack.” So, in what follows, we combine the following context to construct several toxic combinations:
Bot signals
Application paths, especially sensitivity ones: admin, debug, metrics, search, payment flows
Anomalies including: unexpected http codes, geo jumps, identity mismatch, high ID churn, rate-limit evasion (distributed IPs doing the same thing), request or success rate spikes
Vulnerabilities or misconfigurations: missing session cookies or auth headers, predictable identifiers
Examples of toxic combinations on popular application stacks
We looked at a 24-hour window of Cloudflare data to see how often these patterns actually appear in popular application stacks. As shown in the table below, about 11% of the hosts we analyzed were susceptible to these combinations, skewed by vulnerable WordPress websites. Excluding WordPress sites, only 0.25% of hosts show signs of exploitable toxic combinations. While rare, they represent hosts that are vulnerable to compromise.
To make sense of the data, we broke it down into three stages of an attack:
Estimated hosts probed: This is the "wide net." It counts unique hosts where we saw HTTP requests targeting specific sensitive paths (like /wp-admin).
Estimated hosts filtered by toxic combination: Here, we narrowed the list down to the specific hosts that actually met our criteria for a toxic combination.
Estimated reachable hosts: Unique hosts that responded successfully to an exploit attempt—the "smoking gun" of an attack. A simple 200 OK response (such as one triggered by appending ?debug=true) could be a false positive. We validated paths to filter out noise caused by authenticated paths that require credentials despite the 200 status code, redirects that mask the true exploit path, and origin misconfigurations that serve success codes for unreachable paths.
In the next sections, we’ll dig into the specific findings and the logic behind the combinations that drove them. The detection queries provided are necessary but not sufficient without testing for reachability; it is possible that the findings might be false positives. In some cases, Cloudflare Log Explorer allows these queries to be executed on unsampled Cloudflare logs.
Table 1. Summary of Toxic Combinations
image
image
Probing of sensitive administrative endpoints across multiple application hosts
What did we detect?
We observed automated tools scanning common administrative login pages — like WordPress admin panels (/wp-admin), database managers, and server dashboards. A templatized version of the query, executable in Cloudflare Log Explorer, is below:
SELECT
clientRequestHTTPHost,
COUNT(*) AS request_count
FROM
http_requests
WHERE
timestamp >= '{{START_DATE}}'
AND timestamp <= '{{END_DATE}}'
AND edgeResponseStatus = 200
AND clientRequestPath LIKE '{{PATH_PATTERN}}' //e.g. '%/wp-admin/%'
AND NOT match( extract(clientRequestHTTPHost, '^[^:/]+'), '^\\d{1,3}(\\.\\d{1,3}){3}(:\\d+)?$') // comment this line for Cloudflare Log Explorer
AND botScore < {{BOT_THRESHOLD}} // we used botScore < 30
GROUP BY
clientRequestHTTPHost
ORDER BY
request_count DESC;
Why is this serious?
Publicly accessible admin panels can enable brute force attacks. If successful, an attacker can further compromise the host by adding it to a botnet that probes additional websites for similar vulnerability. In addition, this toxic combination can lead to:
Exploit scanning: Attackers identify the specific software version you're running (like Tomcat or WordPress) and launch targeted exploits for known vulnerabilities (CVEs).
User enumeration: Many admin panels accidentally reveal valid usernames, which helps attackers craft more convincing phishing or login attacks.
What evidence supports it?
Toxic combination of bots automation and exposed management interfaces like: /wp-admin/, /admin/, /administrator/, /actuator/*, /_search/, /phpmyadmin/, /manager/html/, and /app/kibana/.
Ingredient
Signal
Description
Bot activity
Bot Score < 30
Bot signatures typical of vulnerability scanners
Anomaly
Repeated Probing
Unusual hits on admin endpoints
Vulnerability
Publicly accessible endpoint
Successful requests to admin endpoints
How do I mitigate this finding?
Implement Zero Trust Access.
If for any reason the endpoint has to remain public, implement a challenge platform to add friction to bots.
Implement IP allowlist: Use your WAF or server configuration to ensure that administrative paths are only reachable from your corporate VPN or specific office IP addresses.
Cloak admin paths: If your platform allows it, rename default admin URLs (e.g., change /wp-admin to a unique, non-guessable string).
Deploy geo-blocking: If your administrators only operate from specific countries, block all traffic to these sensitive paths coming from outside those regions.
Enforce multi-factor authentication (MFA): Ensure every administrative entry point requires a second factor; a password alone is not enough to stop a dedicated crawler.
Unauthenticated public API endpoints allowing mass data exposure via predictable identifiers
What did we detect?
We found API endpoints that are accessible to anyone on the Internet without a password or login (see OWASP: API2:2023 – Broken Authentication). Even worse, the way it identifies records (using simple, predictable ID numbers,see OWASP: API1:2023- Broken Object Level Authorization) allows anyone to simply "count" through your database — making it much simpler for attackers to enumerate and “scrape” your business records, without even visiting your website directly.
SELECT
uniqExact(clientRequestHTTPHost) AS unique_host_count
FROM http_requests
WHERE timestamp >= '2026-02-13'
AND timestamp <= '2026-02-14'
AND edgeResponseStatus = 200
AND bmScore < 30
AND (
match(extract(clientRequestQuery, '(?i)(?:^|[&?])uid=([^&]+)'), '^[0-9]{3,10}$')
OR match(extract(clientRequestQuery, '(?i)(?:^|[&?])user=([^&]+)'), '^[0-9]{3,10}$')
OR length(extract(clientRequestQuery, '(?i)(?:^|[&?])uid=([^&]+)')) BETWEEN 3 AND 8
OR length(extract(clientRequestQuery, '(?i)(?:^|[&?])user=([^&]+)')) BETWEEN 3 AND 8
)
Why is this serious?
This is a "zero-exploit" vulnerability, meaning an attacker doesn't need to be a hacker to steal your data; they just need to change a number in a web link. This leads to:
Mass Data Exposure: Large-scale scraping of your entire customer dataset.
Secondary Attacks: Stolen data is used for targeted phishing or account takeovers.
Regulatory Risk: Severe privacy violations (GDPR/CCPA) due to exposing sensitive PII.
Fraud: Competitors or malicious actors gaining insight into your business volume and customer base.
What evidence supports it?
Toxic combination of missing security controls and automation targeting particular API endpoints.
Ingredient
Signal
Description
Bot activity
Bot Score < 30
High volume of requests from a single client fingerprint iterating through different IDs.
Anomaly
High Cardinality of tid
A single visitor accessing hundreds or thousands of unique resource IDs in a short window.
Anomaly
Stable Response Size
Consistent JSON structures and file sizes, indicating successful data retrieval for each guessed ID.
Vulnerability
Missing Auth Signals
Requests lack session cookies, Bearer tokens, or Authorization headers entirely.
Misconfiguration
Predictable Identifiers
The tid parameter uses low-entropy, predictable integers (e.g., 1001, 1002, 1003).
While the query checked for bot score and predictable identifiers, signals like high cardinality, stable response sizes and missing authentication were tested on a sample of traffic matching the query.
How do I mitigate this finding?
Enforce authentication: Immediately require a valid session or API key for the affected endpoint. Do not allow "Anonymous" access to data containing PII or business secrets.
Implement authorization (IDOR check): Ensure the backend checks that the authenticated user actually has permission to view the specific tid they are requesting.
Use UUIDs: Replace predictable, sequential integer IDs with long, random strings (UUIDs) to make "guessing" identifiers computationally impossible.
Deploy API Shield: Enable Cloudflare API Shield with features like Schema Validation (to block unexpected inputs) and BOLA Detection.
Debug parameter probing revealing system details
What did we detect?
We found evidence of debug=true appended to web paths to reveal system details. A templatized version of the query, executable in Cloudflare Log Explorer, is below:
SELECT
clientRequestHTTPHost,
COUNT(rayId) AS request_count
FROM
http_requests
WHERE
timestamp >= '{{START_TIMESTAMP}}'
AND timestamp < '{{END_TIMESTAMP}}'
AND edgeResponseStatus = 200
AND clientRequestQuery LIKE '%debug=false%'
AND botScore < {{BOT_THRESHOLD}}
GROUP BY
clientRequestHTTPHost
ORDER BY
request_count DESC;
Why is this serious?
While this doesn't steal data instantly, it provides an attacker with a high-definition map of your internal infrastructure. This "reconnaissance" makes their next attack much more likely to succeed because they can see:
Hidden data fields: Sensitive internal information that isn't supposed to be visible to users.
Technology stack details: Specific software versions and server types, allowing them to look up known vulnerabilities for those exact versions.
Logic hints: Error messages or stack traces that explain exactly how your code works, helping them find ways to break it.
What evidence supports it?
Toxic combination of automated probing and misconfigured diagnostic flags targeting the Multiple Hosts and Application Paths.
Ingredient
Signal
Description
Bot activity
Bot Score < 30
Vulnerability scanner activity
Anomaly
Response Size Increase
Significant jumps in data volume when a debug flag is toggled, indicating details or stack traces are being leaked. Add these additional conditions, if needed:
SELECT
AVG(edgeResponseBytes) AS avg_payload_size,
WHERE
edgeResponseBytes > {{your baseline response size}}
Anomaly
Repeated Path Probing
Rapid-fire requests across diverse endpoints (e.g., /api, /login, /search) specifically testing for the same diagnostic triggers. Add these conditions, if needed:
SELECT
APPROX_DISTINCT(clientRequestPath) AS unique_endpoints_tested
HAVING
unique_endpoints_tested > 1
Misconfiguration
Debug Parameter Allowed
The presence of active "debug," "test," or "dev" flags in production URLs that change application behavior.
Vulnerability
Schema disclosure
The appearance of internal-only JSON fields or "Firebase-style" .json dumps that reveal the underlying structure.
While the query checked for bot score and paths with debug parameters, signals like repeated probing, response sizes and schema disclosure were tested on a sample of traffic matching the query.
How do I mitigate this finding?
Disable debugging in production: Ensure that all "debug" or "development" environment variables are strictly set to false in your production deployment configurations.
Filter parameters at the edge: Use your WAF or API Gateway to strip out known debug parameters (like ?debug=, ?test=, ?trace=) before they ever reach your application servers.
Sanitize error responses: Configure your web servers (Nginx, Apache, etc.) to show generic error pages instead of detailed stack traces or internal system messages.
Audit firebase/DB rules: If you are using Firebase or similar NoSQL databases, ensure that /.json path access is restricted via strict security rules, so public users cannot dump the entire schema or data.
Publicly exposed monitoring endpoints providing internal infrastructure visibility
What did we detect?
We discovered "health check" and monitoring dashboards are visible to the entire Internet. Specifically, paths like /actuator/metrics are responding to anyone who asks. A templatized version of the query, executable in Cloudflare Log Explorer, is below::
SELECT
clientRequestHTTPHost,
count() AS request_count
FROM http_requests
WHERE timestamp >= toDateTime('{{START_DATE}}')
AND timestamp < toDateTime('{{END_DATE}}')
AND botScore < 30
AND edgeResponseStatus = 200
AND clientRequestPath LIKE '%/actuator/metrics%' // an example
GROUP BY
clientRequestHTTPHost
ORDER BY request_count DESC
Why is this serious?
While these endpoints don't usually leak customer passwords directly, they provide the "blueprints" for a sophisticated attack. Exposure leads to:
Strategic timing: Attackers can monitor your CPU and memory usage in real-time to launch a Denial of Service (DoS) attack exactly when your systems are already stressed.
Infrastructure mapping: These logs often reveal the names of internal services, dependencies, and version numbers, helping attackers find known vulnerabilities to exploit.
Exploitation chaining: Information about thread counts and environment hints can be used to bypass security layers or escalate privileges within your network.
What evidence supports it?
Toxic combination of misconfigured access controls and automated reconnaissance targeting the Asset/Path: /actuator/metrics, /actuator/prometheus, and /health.
Ingredient
Signal
Description
Bot activity
Bot Score < 30
Automated scanning tools are systematically checking for specific paths
Anomaly
Monitoring Fingerprint
The response body matches known formats (Prometheus, Micrometer, or Spring Boot), confirming the system is leaking live data.
Anomaly
HTTP 200 Status
Successful data retrieval from endpoints that should ideally return a 403 Forbidden or 404 Not Found to the public.
Misconfiguration
Public Monitoring Path
Public accessibility of internal-only endpoints like /actuator/* that are intended for private observability.
Vulnerability
Missing Auth
These endpoints are reachable without a session token, API key, or IP-based restriction.
How do I mitigate this finding?
Restrict access via WAF: Immediately create a firewall rule to block any external traffic requesting paths containing /actuator/ or /prometheus.
Bind to localhost: Reconfigure your application frameworks to only serve these monitoring endpoints on localhost (127.0.0.1) or a private management network.
Enforce basic auth: If these must be accessed over the web, ensure they are protected by strong authentication (at a minimum, complex Basic Auth or mTLS).
Disable unnecessary endpoints: In Spring Boot or similar frameworks, disable any "Actuator" features that are not strictly required for production monitoring.
Unauthenticated search endpoints allowing direct index dumping
What did we detect?
Search endpoints (like Elasticsearch or OpenSearch) that are usually meant for internal use are wide open to the public. The templatized query is:
SELECT
clientRequestHTTPHost,
count() AS request_count
FROM http_requests
WHERE timestamp >= toDateTime('{{START_DATE}}')
AND timestamp < toDateTime('{{END_DATE}}')
AND botScore < 30
AND edgeResponseStatus = 200
AND clientRequestPath like '%/\_search%'
AND NOT match(extract(clientRequestHTTPHost, '^[^:/]+'), '^\\d{1,3}(\\.\\d{1,3}){3}(:\\d+)?$')
GROUP BY
clientRequestHTTPHost
Why is this serious?
This is a critical vulnerability because it requires zero technical skill to exploit, yet the damage is extensive:
Mass data theft: Attackers can "dump" entire indices, stealing millions of records in minutes.
Internal reconnaissance: By viewing your "indices" (the list of what you store), attackers can identify other high-value targets within your network.
Data sabotage: Depending on the setup, an attacker might not just read data — they could potentially modify or delete your entire search index, causing a massive service outage.
What evidence supports it?
We are seeing a toxic combination of misconfigured exposure and automated traffic and data enumeration targeting /_search, /_cat/indices, and /_cluster/health.
Ingredient
Sig
関連記事
今日のまとめ
AI日報で今日の重要ニュースをまとめ読み