A/Bテストの落とし穴:実データで何が機能し、何が失敗するか
この記事は、A/B テストの信頼性を損なう「サンプル比率ミスマッチ(SRM)」やデータ品質の問題を解説し、実務で陥りやすい落とし穴と回避策を具体的な事例とともに提示している。
キーポイント
サンプル比率ミスマッチ(SRM)の危険性
50/50 の割り当てが崩れる SRM は、無作為化の失敗やログ障害を示す警鐘であり、これを無視すると結果が完全に無効になる。
データ品質と偽の勝者
多くのテスト失敗はアイデアの問題ではなく、ノイズを信号と誤認させるデータ欠陥や不適切な停止ルールによるものである。
大企業の事例分析
Microsoft や DoorDash の事例から、SRM が重大な意思決定の誤りや偽の成果(phantom wins)を生む実例が示されている。
SRM はデータ品質の重大な警告信号
サンプル比率ミスマッチ(SRM)はランダム化やトラフィックルーティングの欠陥を示し、テスト結果を無効化する可能性があります。
分析前に SRM チェックを自動化すべき
カイ二乗検定を用いてトラフィック分割を確認し、比率チェックに失敗した場合は分析を停止して原因調査を行う必要があります。
早期チェックによる偽陽性の増加
テスト結果を頻繁に確認(ピーキング)すると、偶然によって有意差が検出される確率(偽陽性率)が5%から25%以上に急増し、「勝利」の多くがノイズになるリスクがあります。
逐次検定や適正化手法の活用
頻繁な確認を避けるか、SpotifyやNetflixなどが採用する逐次検定(sequential testing)や常に有効な推論手法を用いて、複数回のチェックに対する誤差率を調整する必要があります。
重要な引用
Most A/B test failures don't come from bad product ideas; they come from bad experimentation practices.
Sample Ratio Mismatch (SRM) is the canary in the coal mine.
The data misled you, the stopping rule was ignored, or no one checked if the 'win' was just noise dressed as a signal.
"Most 'surprising' test results aren't insights; they're data-quality bugs wearing a disguise."
"The fix isn't statistical cleverness. It's data hygiene."
uncorrected peeking can raise false positives from 5% to over 25%, meaning one in four 'wins' is noise
影響分析・編集コメントを表示
影響分析
この記事は、データドリブンな意思決定を行う組織にとって、単なる機能改善ではなく実験プロセスの健全性が結果の信頼性を左右することを浮き彫りにしています。技術チームが統計的バイアスやデータ欠陥に気づかずにリリースを決定するリスクを軽減し、より堅牢な A/B テスト文化の構築に寄与します。
編集コメント
A/B テストの運用において、結果の解釈よりも「実験プロセス自体の健全性」を優先する視点は非常に重要です。特に SRM の検知は、データサイエンティストやプロダクトマネージャーが必ずチェックすべき基本事項と言えます。
 image**
筆者による画像
# はじめに
見事な勝利を収めたテストのように見えるものをリリースしました:コンバージョン率が8%上昇し、エンゲージメント指標は緑色に輝いています。しかし本番環境でクラッシュするか、1ヶ月後に静かに失敗します。
もしその状況に心当たりがあるなら、あなただけではありません。A/Bテストの失敗のほとんどは、悪い製品アイデアから来るのではなく、悪い実験手法から来ます。
データがあなたを誤導し、停止ルールが無視され、あるいは「勝利」が単なるノイズでありシグナルではないことを確認する人が誰もいませんでした。ここにある不快な真実:テストを取り巻くインフラストラクチャは、バリアント自体よりも重要であり、ほとんどのチームがこれを誤っています。
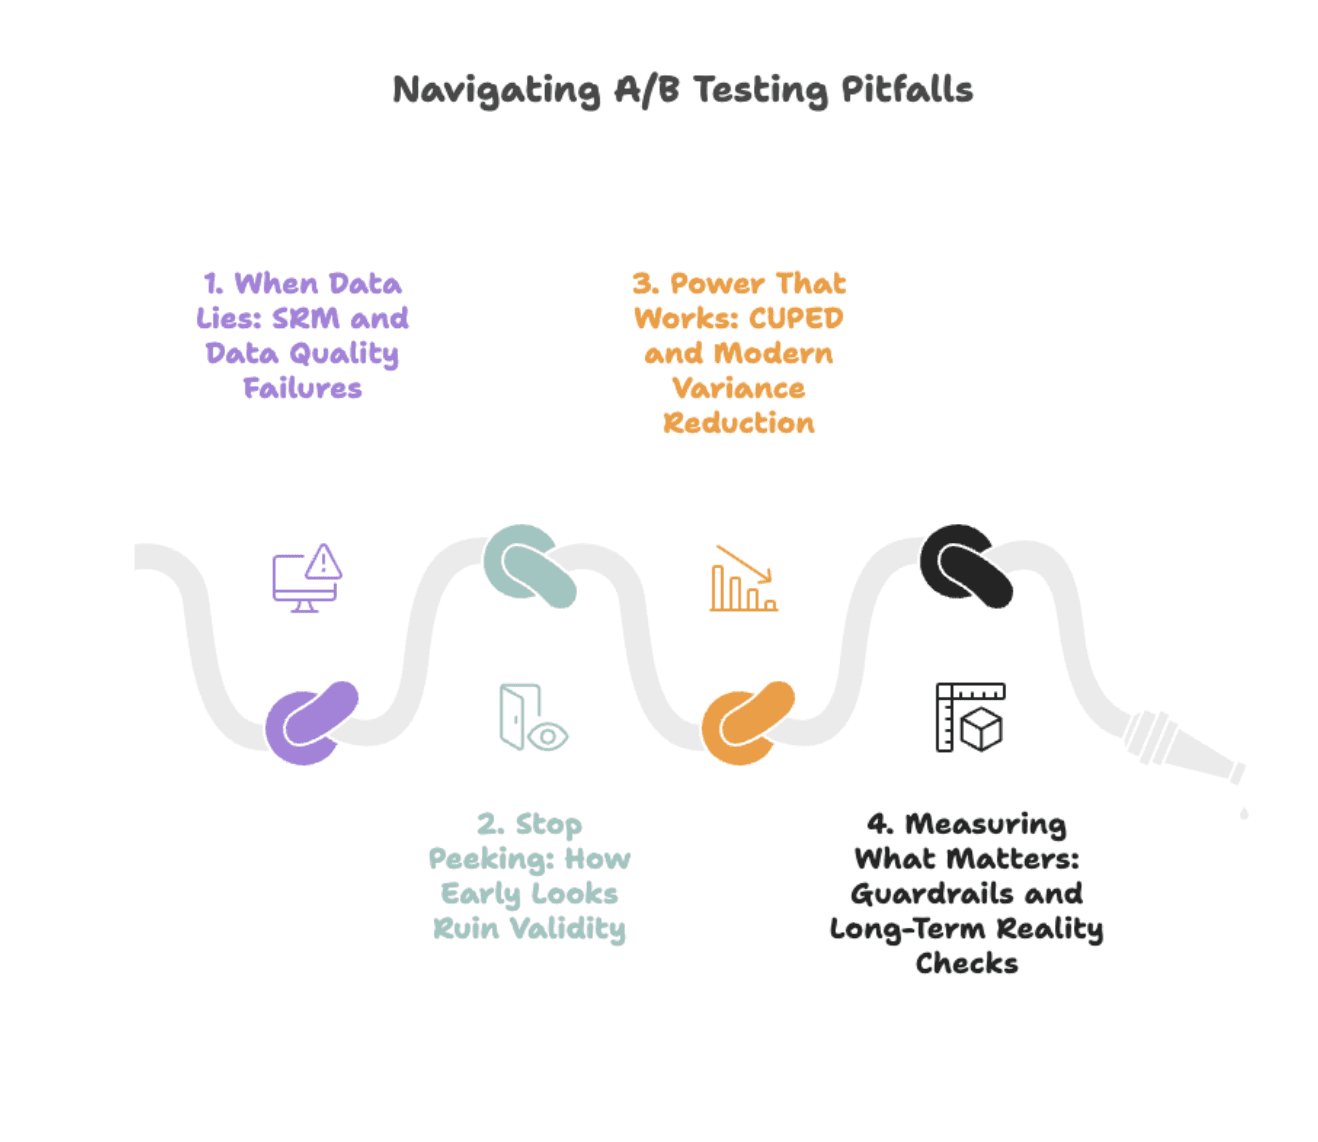
データ品質のミスから論理の欠陥に至るまで、A/Bテストの4つの静かな殺し屋を分解し、最上位チームとその他のチームを分ける規律ある実践を明らかにしましょう。
筆者による画像
# データが嘘をつくとき:SRMとデータ品質の失敗
落とし穴:最も「驚くべき」テスト結果は洞察ではなく、正体を隠したデータ品質のバグです。
サンプル比率の不一致(SRM**)は、炭鉱のカナリアのようなものです。50対50の分割を期待しますが、52対48になります。無害に聞こえるかもしれませんが、そうではありません。SRMは、無作為化の失敗、バイアスのかかったトラフィックルーティング、または結果を静かに腐食させるログ記録の失敗を示します。
実世界の事例:Microsoftは、SRM(Sample Ratio Mismatch:サンプル比率の不均衡)が重大なデータ品質の問題を示し、実験結果を無効化することを発見しました。つまり、SRMが存在するテストは往々にして誤ったリリース判断につながります。DoorDashは、バグ修正後のあるグループから低意図ユーザーが不均衡に離脱した後にSRMを検出し、その結果は歪み、偽の勝利(phantom wins)を生み出しました。
SRMが発生した場合の確認事項:
 image**
画像は筆者作成
- トラフィック分割のカイ二乗検定:分析の前にこれを自動化してください。
- ユーザーレベル対セッションレベルのログ記録:粒度の不整合は偽の効果を生み出します。
- 時間ベースのバケット化バグ:コントロールグループに月曜日のユーザー、治療グループに金曜日のユーザーが含まれる場合、結果は交絡します。
解決策:修正に必要なのは統計的な巧妙さではありません。それはデータ衛生(data hygiene)です。指標を見る前にSRMチェックを実行してください。テストが比率チェックに失敗した場合、停止します。調査し、ランダム化を修正します。例外はありません。
SRM(サンプリング結果の不一致)やロギングの不整合といったデータ品質の問題を見抜く練習をしたい場合は、StrataScratch** で実際の SQL データクリーニングや異常検出の課題に挑戦してみてください。実際の企業からのデータセットが見つかり、デバッグやデータ検証のスキルを試すことができます。
ほとんどのチームはこのステップをスキップします。そのため、「成功した」とされるテストの多くが本番環境で失敗してしまうのです。
# 早期のチェック(ピーキング)を止める:これが妥当性を損なう理由
**
落とし穴:毎朝テスト結果を確認するのは生産的だと感じられますが、実際にはそうではありません。それは系統的に偽陽性率(false positive rate)を膨らませます。
その理由:p値を確認し、停止するかどうかを判断するたびに、ランダム性があなたを騙すもう一つの機会を与えていることになります。無効仮説(null effect)に対して20回の早期チェックを行うと、純粋な運によって最終的に p < 0.05 が観測されることになります。Optimizely** の研究によると、補正のない早期チェックは偽陽性率を5%から25%以上に引き上げる可能性があり、つまり「勝利」とされる結果の4つに1つがノイズであることを意味します。
素朴なアプローチを見抜く方法:
- テストを2週間実行する。
- 毎日確認する。
- p < 0.05 の時点で停止する。
- 結果:調整なしで14回の多重比較を実行したことになります。
解決策:逐次検定 または、複数回の確認に対応して調整された「常に妥当な推論」手法を使用します。
実世界のケース:
- Spotifyのアプローチ:グループ逐次検定(Group Sequential Tests: GST)は、アルファ支出関数を用い、中間検定間の相関構造を活用することで、複数回の確認を最適に処理します。
- Optimizelyのソリューション:継続的なモニタリングを考慮した「常に有効なp値」により、エラー率を増大させることなく安全なピーキング(早期確認)が可能です。
- Netflixの手法: anytime-valid confidence sequences(いつでも有効な信頼区間列)を用いた逐次検定は、固定期間から継続的モニタリングへ切り替えつつ、第一種エラーの保証を維持します。
もしピーキング(早期確認)を行わなければならないなら、それ用に設計されたツールを使用してください。t検定で適当にやるのはやめましょう。
結論:開始前に停止ルールを事前に定義してください。「良さそうになったら止める」はルールではありません。それは「愚者の金(偽物)」を作るレシピです。
# 機能する統計検出力:CUPEDと現代の分散削減
**
落とし穴:テスト期間を長くすることだけが答えではありません。賢くテストを行うことです。
ソリューション:CUPED**(Controlled-experiment Using Pre-Experiment Data:実験前データを用いた制御実験)は、Microsoftがノイズの多い指標に対して提供しているソリューションです。この概念は、実験前の行動を用いて実験後の結果を予測し、残差の差分のみを測定することを含みます。予測可能な分散を除去することで、より多くのデータを収集せずに信頼区間を縮小できます。
実世界の例:Microsoft は、あるプロダクトチームにおいて CUPED が実験に 20% 分の追加トラフィックを加えるのと同様の効果をもたらしたと報告しています。Netflix は、主要なエンゲージメント指標において約 40% の分散低減を確認しました。Statsig は、多くの一般的な指標で CUPED が 50% 以上の分散低減をもたらしたことを観察しており、これはテストが有意水準に達するまでの時間が半分になるか、必要なトラフィック量が半分で済むことを意味します。
動作原理:
Adjusted_metric = Raw_metric - θ × (Pre_period_metric - Mean_pre_period)
訳:ユーザーがテスト前に週 100 ドルを使用していた場合、テストコホートの事前テスト平均が週 90 ドルであれば、CUPED はすでに高額消費者であったユーザーに対して下方調整を行います。ここで測定するのは既存の分散ではなく、処置効果です。
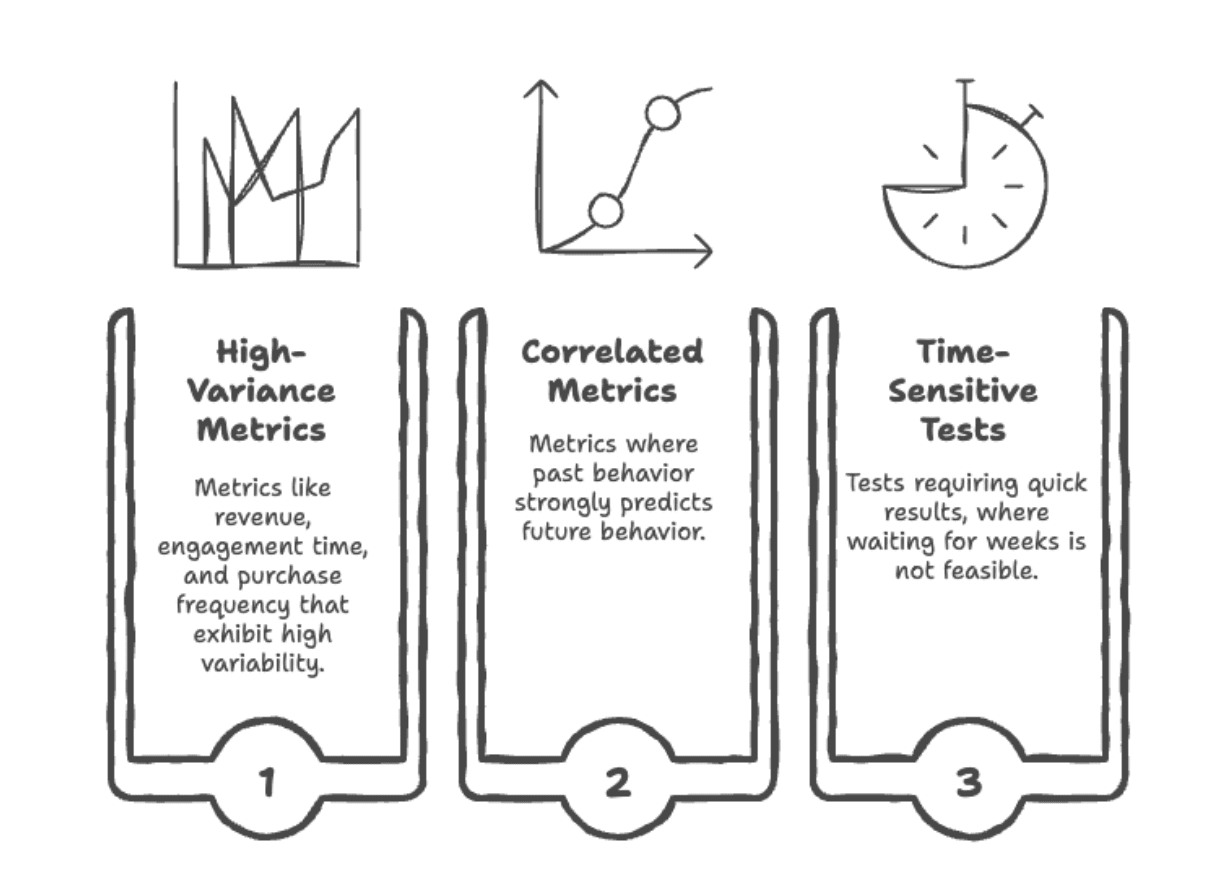
CUPED を使用するべき場面は?
 image**
画像提供:著者
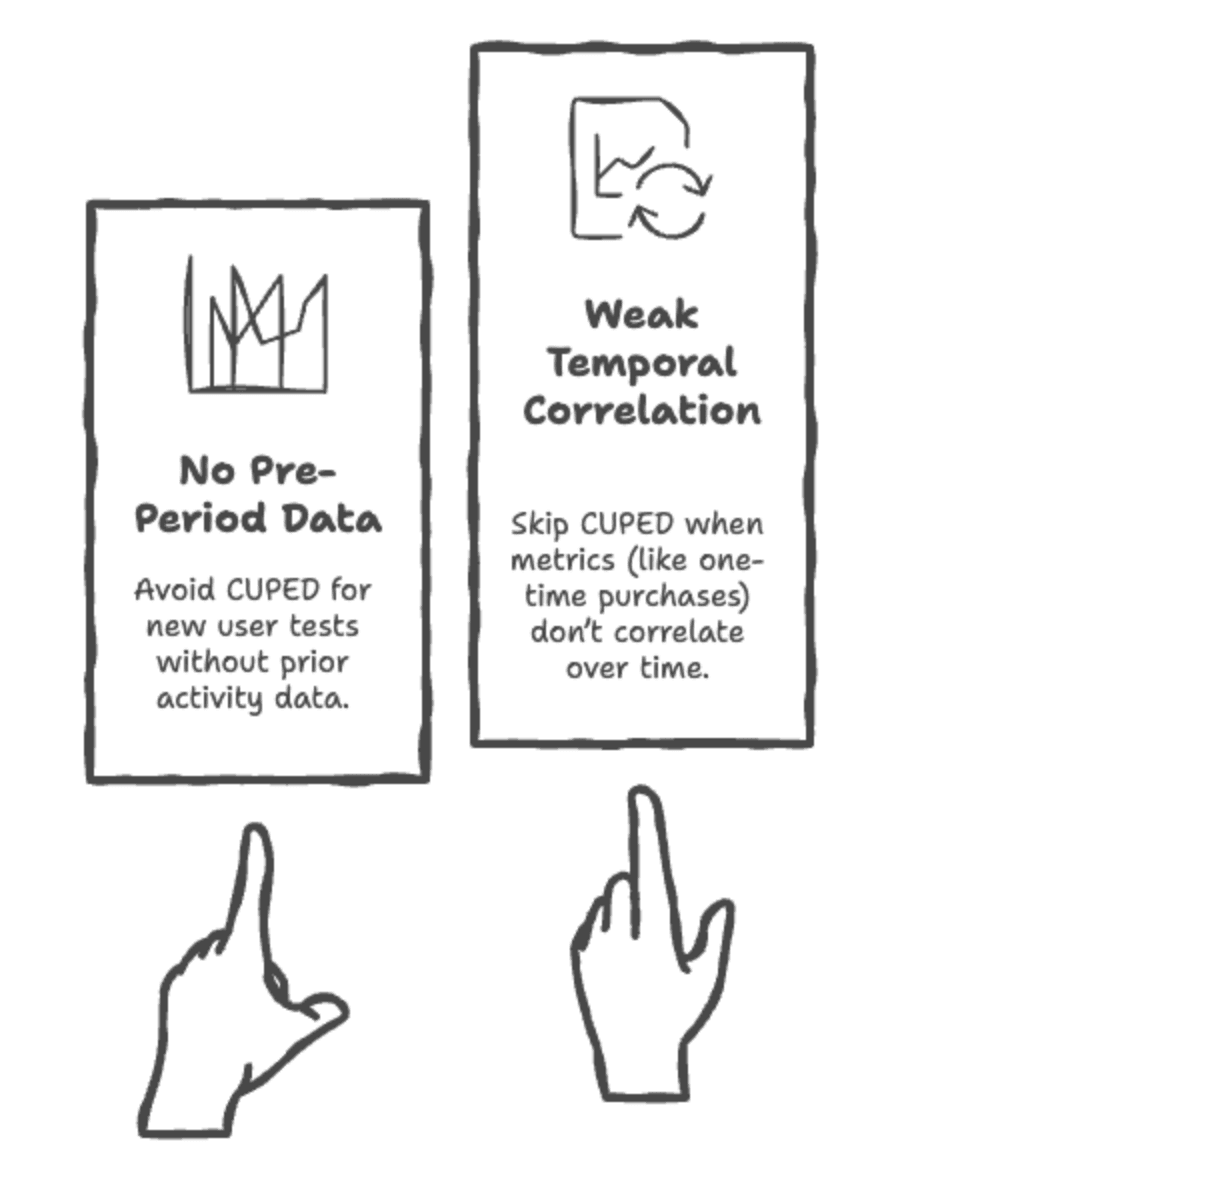
CUPED を使用すべきでない場面は?
画像提供:著者
CUPAC**(指標間で共変量を組み合わせる)や層別サンプリングといった新しい手法はさらに進んでいますが、基本原理は同じです。分析した後ではなく、分析の前にノイズを減らすことです。
実装に関する補足:現代の実験プラットフォーム(Optimizely、Eppo、GrowthBook)のほとんどは、CUPED(Controlled-experiment Using Pre-Experiment Data:実験前データを用いた制御実験)を標準でサポートしています。もし独自に実装する場合は、分析パイプラインに事前期間の共変量(covariates)を追加してください。統計的な効果の向上は、エンジニアリングの手間に見合う価値があります。
何を測定するか:ガードレールと長期的な現実確認
**
落とし穴:誤った指標の最適化は、テストを行わないことよりも悪いです。
古典的な罠:クリック数を12%向上させる機能をテストし、リリースしました。3ヶ月後、リテンション(ユーザー維持率)が8%低下していました。何が起こったのでしょうか?下流への悪影響を防ぐことなく、バニティ指標(見栄えだけの指標)を最適化した結果です。
解決策:ガードレール指標(guardrail metrics)は安全網です。これらは最適化する対象ではありませんが、意図しない結果を捕捉するために監視する指標です。
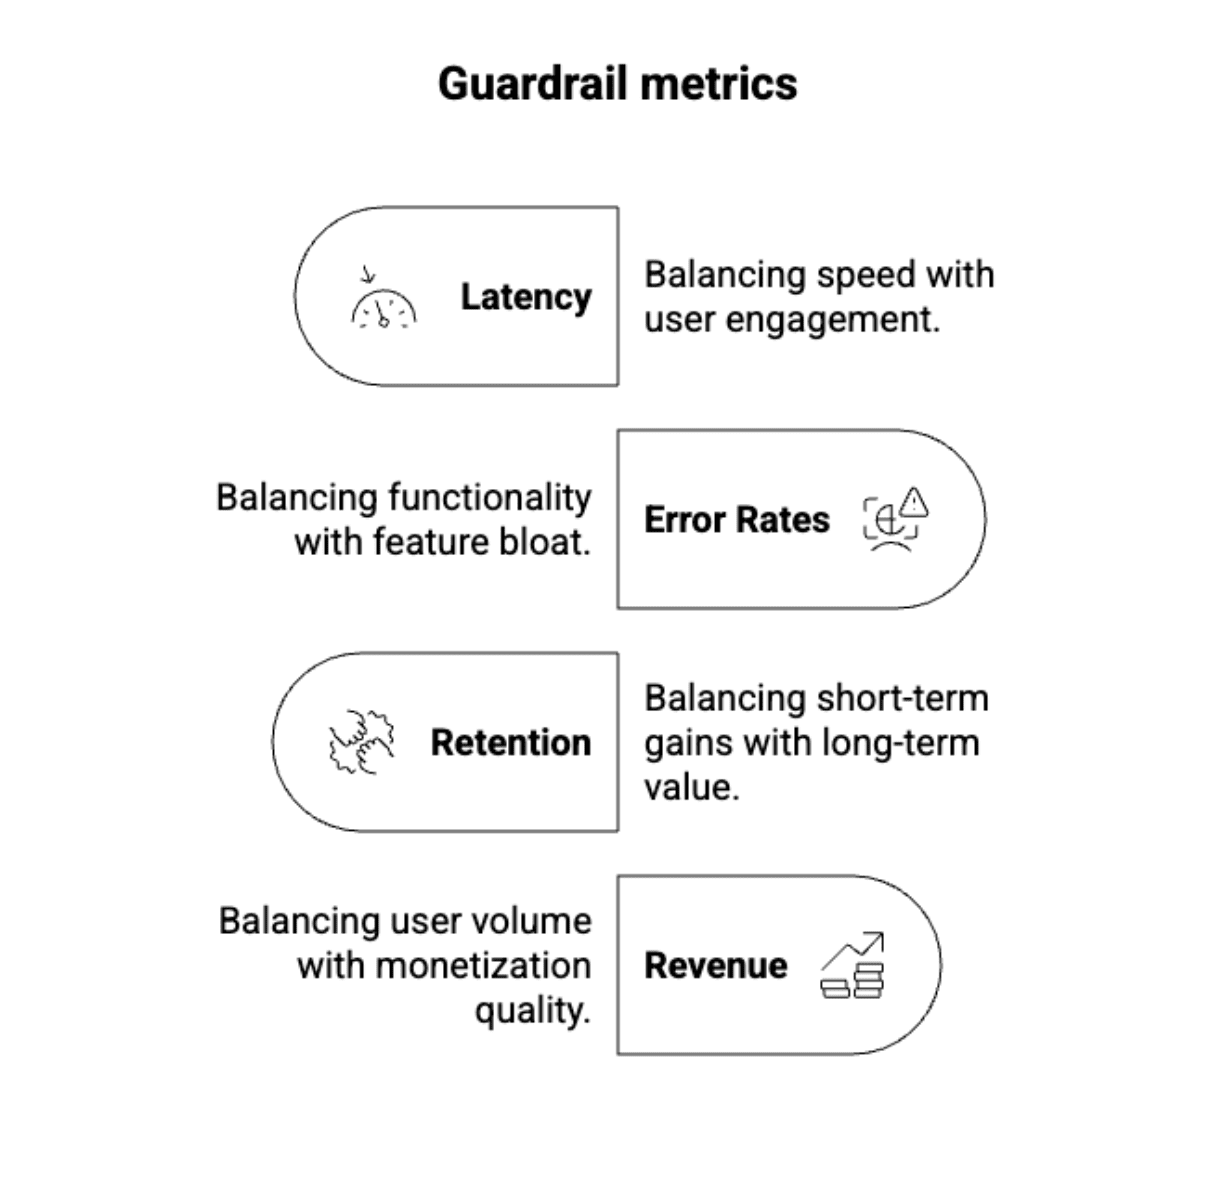
画像作成者:著者
実世界の例:Airbnb**は、予約数を増加させるテストがレビュー評価を低下させていることを発見しました。この変更はより多くの予約をもたらしましたが、長期的な満足度を損ないました。ガードレール指標が問題を検出し、フルロールアウト前に防止しました。月数千回の実験のうち、Airbnbのガードレールは約25件のテストをステークホルダーによるレビュー対象としてフラグを立て、毎月約5件の潜在的な重大な悪影響を防いでいます。
ガードレールの構成方法:
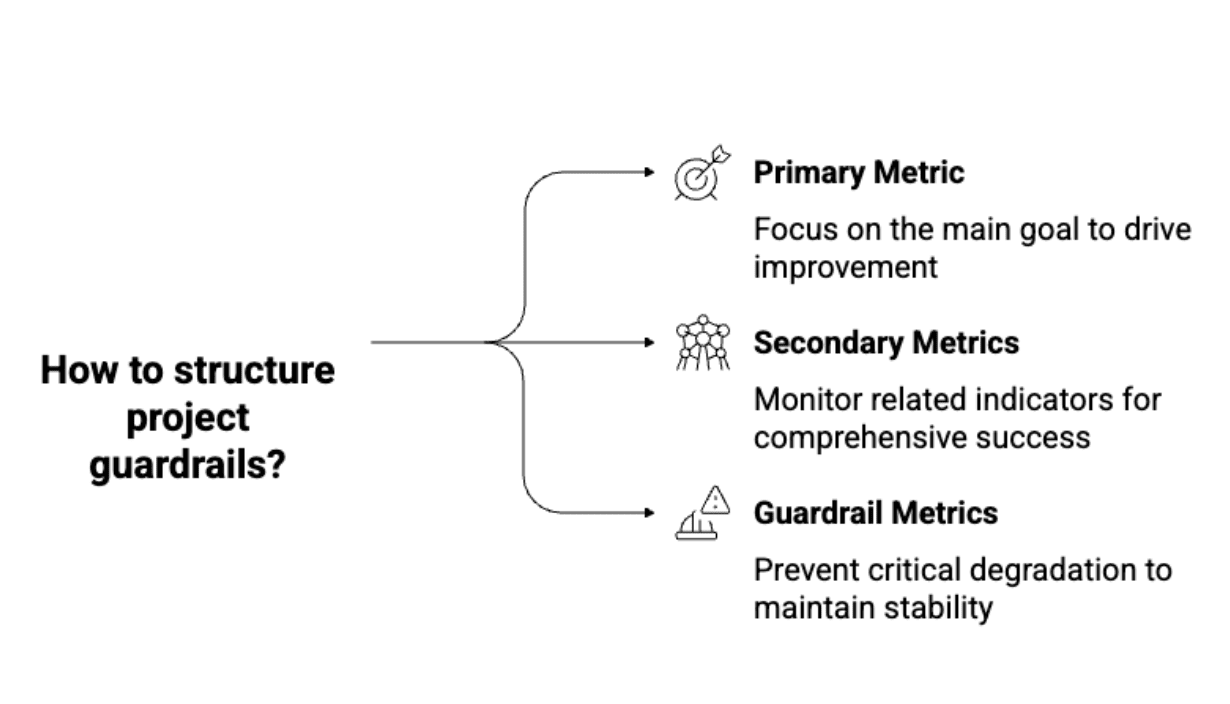
画像:筆者作成
新規性問題:短期間のテストは、持続的な影響ではなく「新規性効果」を捉えてしまいます。ユーザーが新しいボタンをクリックするのは、それが優れているからではなく、単に新しいからです。企業はホールドアウトグループを用いて、ローンチから数週間または数ヶ月経過した後も効果が持続するかどうかを測定します。一般的には、変更前の体験を5〜10%のユーザーに維持し、長期的な指標を追跡します。
ベストプラクティス:すべてのテストには、初期実験を超えた検証が必要です。
- フェーズ1:直近の影響を測定するための標準的なA/Bテスト(1〜4週間)。
- フェーズ2:ホールドアウトグループや長期追跡を用いた長期的なモニタリングで、効果の持続性を検証する。
もしフェーズ2で効果が消失した場合、それは本当の勝利ではありませんでした。単なる好奇心によるものでした。
# トップ実験チームが異なる点
**
良い実験チームと優れた実験チームの差は、統計的な洗練度にあるのではなく、運用上の規律にあります。
Booking.com、Netflix、Microsoftなどの企業が他社と異なる取り組みは以下の通りです:
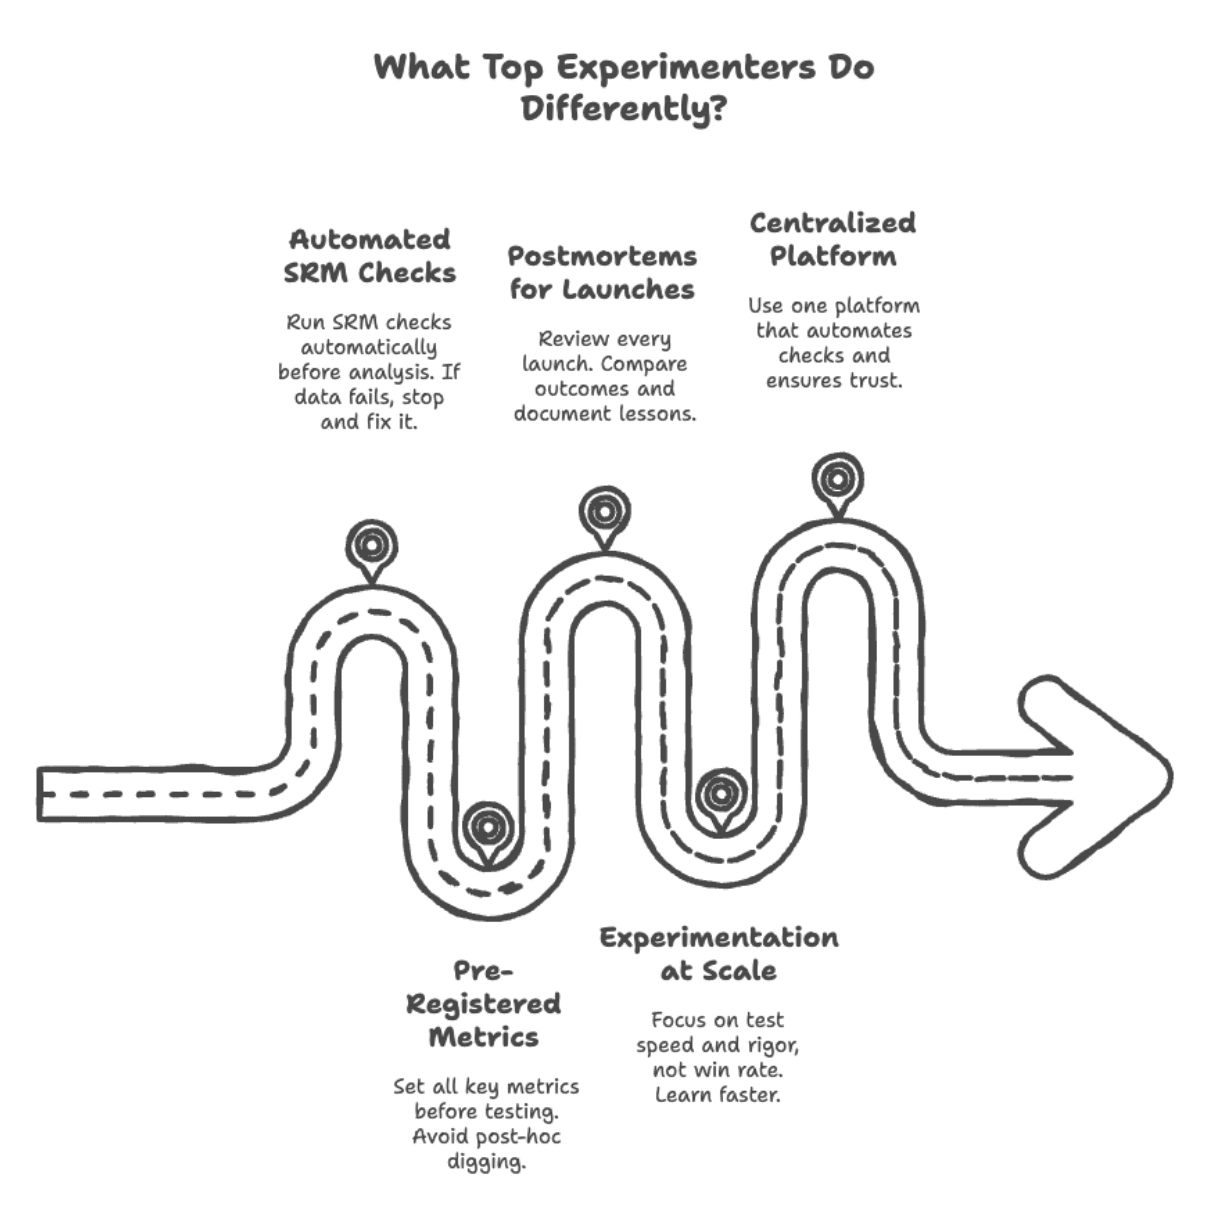
画像:筆者作成
// SRMチェックの自動化
業界の慣行:OptimizelyやStatsigといった現代の実験プラットフォームは、すべての実験でSRM(Sample Ratio Mismatch:サンプル比率の不整合)テストを自動的に実行します。チェックが失敗した場合、ダッシュボードは警告を表示します。上書きオプションはありません。「後で調査する」という選択肢もありません。修正するか、リリースしないかの二者択一です。
Booking.comの実験文化では、結果を分析する前にデータ品質の問題を検出することを要求しており、SRMチェックはオプションの診断ツールではなく、絶対遵守すべきガードレール(安全装置)として扱われています。
// メトリクスの事前登録
ベストプラクティス:テスト開始前に主要指標、二次指標、ガードレール指標を定義します。事後のメトリクス掘り出しは禁止です。「収益も動いたか確認しよう」という言い訳も通じません。測定する計画がなければ、それを勝利として主張する権利はありません。
Netflixのアプローチ:テストには、意図しない悪影響(ネガティブな結果)を検出するためのガードレール指標(カスタマーサービスへの連絡率など)に加え、事前に定義された主要指標が含まれます。
// 全リリースに対するポストモーテムの実施
MicrosoftのExPプラットフォームの慣行:勝敗にかかわらず、リリースされたすべての実験に対してポストモーテム(事後検証)が行われます:
- 効果は予測と一致したか?
- ガードレール(安全装置)は機能していたか?
- 次回のために何を変えるべきか?
これは官僚主義ではありません。それは学習のためのインフラです。
// スケーラブルな実験の実施
Booking.com の結果:同時に 1,000 件以上の実験を実行している同社は、テストの大部分(90%)が失敗するという事実を学びましたが、それがポイントです。テストの量は勝率に関わるものではなく、競合他社よりも速く学習することにあります。
チームの評価基準は勝率ではなく、以下の項目に基づきます:
- テストの速度(1 クォーターあたりの実験数)。
- データの品質(SRM 率を低く保つこと)。
- 実行の徹底(有効な勝利結果のうち実際にリリースされる割合)。
これにより、システムを操作する行為が抑制され、厳格な実行が奨励されます。
// 集中化された実験プラットフォームの構築
優れたチームは、エンジニアが独自の A/B テストを独自に実装することを許しません。彼らは(または購入する)以下の機能を持つプラットフォームを構築します:
- 無作為化の正しさを強制する。
- サンプルサイズを自動計算する。
- SRM(サンプリング結果の偏り)と検出力チェックを自動実行する。
- 監査のためにすべての決定をログに記録する。
これが重要な理由:実験における成功は、より多くのテストを実行することではありません。それは信頼性の高いテストを実行することです。勝つチームは、厳格なプロセスを自動化できるチームです。
# 結論
**
A/B テストにおける最も難しい真実は、統計学的なものではなく文化的なものです。逐次テストをマスターし、CUPED(共変量を用いた分散削減手法)を実装し、完璧なガードレールを定義できたとしても、チームが結果を早期に確認したり、SRM の警告を無視したり、検証なしで勝利結果をリリースしたりするのであれば、それらのすべては無意味になります。
実験をスケーリングできるチームと、偽陽性で溺れるチームの違いは、より賢いデータサイエンティストではありません。それは自動化された厳格さ、強制された規律、そして「有意性がありそう」というだけでは不十分だという共通の合意です。
次回、テストを覗き込んだり、SRM(Sample Ratio Mismatch:サンプル比率不均衡)チェックをスキップしたりしたくなったときは、覚えておいてください。実験において最も高価なミスは、データがクリーンでないにもかかわらず、自分はクリーンだと信じ込んでしまうことです。
Nate Rosidi はデータサイエンティストであり、プロダクト戦略の専門家です。また、アナリティクスを教える非常勤教授でもあり、トップ企業からの実際の面接質問を用いてデータサイエンティストの面接準備を支援するプラットフォーム「StrataScratch」の創設者でもあります。Nate は、キャリア市場における最新のトレンドについて執筆し、面接のアドバイスを提供し、データサイエンスプロジェクトを共有し、SQL に関するあらゆるトピックをカバーしています。
原文を表示
**
Image by Author
# Introduction
You've shipped what looks like a winning test: conversion up 8%, engagement metrics glowing green. Then it crashes in production or quietly fails a month later.
If that sounds familiar, you're not alone. Most A/B test failures don't come from bad product ideas; they come from bad experimentation practices.
The data misled you, the stopping rule was ignored, or no one checked if the "win" was just noise dressed as a signal. Here's the uncomfortable truth: the infrastructure around your test matters more than the variant itself, and most teams get it wrong.
Let's break down the four silent killers of A/B testing — from misleading data to flawed logic — and reveal the disciplined practices that separate the best from the rest.
Image by Author
# When Data Lies: SRM and Data Quality Failures
Pitfall: Most "surprising" test results aren't insights; they're data-quality bugs wearing a disguise.
Sample Ratio Mismatch (SRM**) is the canary in the coal mine. You expect a 50/50 split, you get 52/48. Sounds harmless. It's not. SRM signals broken randomization, biased traffic routing, or logging failures that silently corrupt your results.
Real-world case: Microsoft found that SRM signals severe data quality issues that invalidate experiment results, meaning tests with SRM often lead to wrong ship decisions.**
DoorDash** detected SRM after low-intent users dropped out disproportionately from one group following a bug fix, skewing results and creating phantom wins.
What to check if you have SRM:

**
Image by Author
- Chi-squared test for traffic splits: automate this before any analysis.
- User-level vs. session-level logging: mismatched granularity creates phantom effects.
- Time-based bucketing bugs: Monday users in control, Friday users in treatment = confounded results.
Solution: The fix isn't statistical cleverness. It's data hygiene. Run SRM checks before looking at metrics. If the test fails the ratio check, stop. Investigate. Fix the randomization. No exceptions.
Want to practice spotting data-quality issues like SRM or logging mismatches? Try a few real SQL data-cleaning and anomaly-detection challenges on StrataScratch**. You'll find datasets from real companies to test your debugging and data validation skills.
Most teams skip this step. That's why most "successful" tests fail in production.
# Stop Peeking: How Early Looks Ruin Validity
**
Pitfall: Checking your test results every morning feels productive. It's not. It's systematically inflating your false positive rate.
Here's why: every time you look at p-values and decide whether to stop, you're giving randomness another chance to fool you. Run 20 peeks on a null effect, and you'll eventually see p < 0.05 by pure luck. Optimizely**'s research found that uncorrected peeking can raise false positives from 5% to over 25%, meaning one in four "wins" is noise.
How to recognize a naive approach:
- Run the test for two weeks.
- Check daily.
- Stop when p < 0.05.
- Result: You've run 14 multiple comparisons without adjustment.
Solution: Use sequential testing or always-valid inference methods that adjust for multiple looks.
Real-world case:
- Spotify's approach: Group sequential tests (GST) with alpha spending functions optimally account for multiple looks by exploiting the correlation structure between interim tests.
- Optimizely's solution: Always-valid p-values that account for continuous monitoring, allowing safe peeking without inflating error rates.
- Netflix's method: Sequential testing with anytime-valid confidence sequences switches from fixed-horizon to continuous monitoring while preserving Type I error guarantees.
If you must peek, use tools built for it. Don't wing it with t-tests.
Bottom line: Predefine your stopping rule before you start. "Stop when it looks good" isn't a rule; it's a recipe for fool's gold.
# Power That Works: CUPED and Modern Variance Reduction
**
Pitfall: Running longer tests isn't the answer. Running smarter tests is.
Solution: CUPED** (Controlled-experiment Using Pre-Experiment Data) is Microsoft's solution to noisy metrics. The concept involves using pre-experiment behavior to predict post-experiment outcomes, then measuring only the residual difference. By removing predictable variance, you shrink confidence intervals without collecting more data.
Real-world example: Microsoft reported that for one product team, CUPED was akin to adding 20% more traffic to experiments. Netflix found variance reductions of roughly 40% on key engagement metrics. Statsig observed that CUPED reduced variance by 50% or more for many common metrics, meaning tests reached significance in half the time, or with half the traffic.
How it works:
Adjusted_metric = Raw_metric - θ × (Pre_period_metric - Mean_pre_period)Translation: If a user spent $100/week before the test, and your test cohort averages $90/week pre-test, CUPED adjusts downward for users who were already high spenders. You're measuring the treatment effect, not pre-existing variance.
When to use CUPED?
**
Image by Author
When not to use CUPED?
Image by Author
Newer methods like CUPAC** (combining covariates across metrics) and stratified sampling push this further, but the principle stays the same: reduce noise before you analyze, not after.
Implementation note: Most modern experimentation platforms (Optimizely, Eppo, GrowthBook) support CUPED out of the box. If you're rolling your own, add pre-period covariates to your analysis pipeline; the statistical lift is worth the engineering effort.
# Measuring What Matters: Guardrails and Long-Term Reality Checks
**
Pitfall: Optimizing for the wrong metric is worse than running no test at all.
A classic trap: You test a feature that boosts clicks by 12%. Ship it. Three months later, retention is down 8%. What happened? You optimized a vanity metric without protecting against downstream harm.
Solution: Guardrail metrics are your safety net. They're the metrics you don't optimize for, but you monitor to catch unintended consequences:
Image by Author
Real-world example: Airbnb** discovered that a test increasing bookings also decreased review ratings; the change attracted more bookings but hurt long-term satisfaction. Guardrail metrics caught the problem before full rollout. Out of thousands of monthly experiments, Airbnb's guardrails flag roughly 25 tests for stakeholder review, preventing about five potentially major negative impacts each month.
How to structure guardrails:
**
Image by Author
The novelty problem: Short-term tests capture novelty effects, not sustained impact. Users click new buttons because they're new, not because they're better. Companies use holdout groups** to measure whether effects persist weeks or months after launch, typically keeping 5–10% of users in the pre-change experience while monitoring long-term metrics.
Best practice: Every test needs validation beyond the initial experiment:
- Phase 1: Standard A/B test (1–4 weeks) to measure immediate impact.
- Phase 2: Long-term monitoring with holdout groups or extended tracking to validate persistence.
If the effect disappears in Phase 2, it wasn't a real win: it was curiosity.
# What Top Experimenters Do Differently
**
The gap between good and great experimentation teams isn't statistical sophistication; it's operational discipline.
Here's what companies like Booking.com, Netflix, and Microsoft do that others don't:
Image by Author
// Automating SRM Checks
Industry practice: Modern experimentation platforms like Optimizely and Statsig** automatically run SRM tests on every experiment. If the check fails, the dashboard shows a warning. No override option. No "we'll investigate later." Fix it or don't ship.
Booking.com's experimentation culture demands that data quality issues get caught before results are analyzed, treating SRM checks as non-negotiable guardrails, not optional diagnostics.
// Pre-Registering Metrics
Best practice: Define primary, secondary, and guardrail metrics before the test starts. No post-hoc metric mining. No "let's check if it moved revenue too." If you didn't plan to measure it, you don't get to claim it as a win.
Netflix's approach: Tests include predefined primary metrics plus guardrail metrics (like customer service contact rates) to catch unintended negative consequences.
// Running Postmortems for Every Launch
Microsoft's ExP platform practice: Win or lose, every shipped experiment gets a postmortem:
- Did the effect match the prediction?
- Did guardrails hold?
- What would we do differently?
This isn't bureaucracy; it's learning infrastructure.
// Experimenting at Scale
Booking.com's results: Running 1,000+ concurrent experiments, they've learned that most tests (90%) fail, but that's the point. Testing volume isn't about wins; it's about learning faster than competitors.
Teams are measured not on win rate, but on:
- Test velocity (experiments per quarter).
- Data quality (keeping SRM rates low).
- Follow-through (% of valid wins that actually ship).
This discourages gaming the system and rewards rigorous execution.
// Building a Centralized Experimentation Platform
Great teams don't let engineers roll their own A/B tests. They build (or buy) a platform that:
- Enforces randomization correctness.
- Auto-calculates sample sizes.
- Runs SRM and power checks automatically.
- Logs every decision for audit.
Why this matters: Success in experimentation isn't about running more tests. It's about running trustworthy tests. The teams that win are the ones who make rigor automatic.
# Conclusion
**
The hardest truth in A/B testing isn't statistical; it's cultural. You can master sequential testing, implement CUPED, and define perfect guardrails, but none of it matters if your team checks results too early, ignores SRM warnings, or ships wins without validation.
The difference between teams that scale experimentation and teams that drown in false positives isn't smarter data scientists; it's automated rigor, enforced discipline, and a shared agreement that "it looked significant" isn't good enough.
Next time you're tempted to peek at a test or skip the SRM check, remember: the most expensive mistake in experimentation is convincing yourself the data is clean when it's not.
Nate Rosidi** is a data scientist and in product strategy. He's also an adjunct professor teaching analytics, and is the founder of StrataScratch, a platform helping data scientists prepare for their interviews with real interview questions from top companies. Nate writes on the latest trends in the career market, gives interview advice, shares data science projects, and covers everything SQL.
関連記事
今日のまとめ
AI日報で今日の重要ニュースをまとめ読み