Amazon Bedrock上のCodex可視化にOpenTelemetryとCloudWatch
本文の状態
日本語全文を表示中
詳細モードで約15分の本文を読めます。
同じ出来事の情報源
この情報源を基点に整理
AWS Machine Learning Blog
AWS は、開発者がローカル環境で Codex を利用する際に OpenTelemetry を経由してメトリクスを収集し、Amazon CloudWatch で組織ごとの利用状況やコストを可視化するネイティブなアーキテクチャを発表した。
AI深層分析を開く2026年8月7日 02:33
AI深層分析
キーポイント
ローカル環境でのメトリクス収集アーキテクチャ
開発者のワークステーションに配置された OpenTelemetry カレッターが、Codex の利用メトリクスを収集・付加し、AWS Signature Version 4 で CloudWatch に送信する。この構成はモデルリクエストパスに集中型プロキシを追加しないため、既存の開発フローを維持できる。
組織レベルでの可視化とガバナンス
収集されたデータは AWS IAM Identity Center と連携し、ユーザー、チーム、部門、コストセンター単位で利用状況を整理可能にする。これにより、技術リーダーは広範な採用と孤立した実験を区別し、責任あるスケーリングを実現できる。
意思決定支援のためのダッシュボード機能
提供される CloudWatch ダッシュボードには、アクティブユーザー数、会話ターン数、API リクエスト、トークン使用量などの 24 時間ローリング合計が含まれる。これらの信号は、パイロットの拡大やオンボーディングの優先度決定といった経営判断を支援する。
コスト報告とメトリクスの区別
CloudWatch OTel メトリクスは使用量や動作の可視化に用いられるが、請求明細ではない。実現された支出については IAM プリンシパルごとのコスト配分を含む AWS Cost and Usage Reports (CUR) 2.0 を使用する必要がある。
アーキテクチャと認証フロー
モデルアクセスとテレメトリ公開に同一の AWS IDENTITY が使用され、Codex はローカルコレクターへメトリクスを送信する。コレクターは識別子や組織属性を追加して SigV4 署名付きで CloudWatch にバッチ送信し、推論パスから外れる。
重要な引用
It is no longer only, 'Can this tool help a developer?' It becomes, 'How do we understand adoption, manage consumption, maintain reliability, and scale access responsibly?'.
This approach does not add a centralized proxy to the model-request path.
Telemetry is most useful when it answers a decision, not simply when it produces another dashboard.
CloudWatch OTel metrics show usage volume and operational behavior. Token counts can support trend analysis, but they are not a billing ledger.
編集コメントを表示
編集コメント
本記事は、生成 AI ツールの導入が単なる実験段階から組織的な運用フェーズへ移行する際の課題解決策を提示している。特に、開発体験を阻害せずに利用状況を把握できる分散型アプローチの提案は実用的価値が高い。
Source Article
元記事を日本語で読む
本文に関係しない購読案内、埋め込み通知、サイト内プロモーションは除いています。
コーディングエージェントの導入を「実験」から「エンジニアチーム全体での本格活用」へと移行させる組織において、リーダーが問うべき問いも変化します。単に「このツールは開発者を支援できるか」という段階を超え、「採用状況をどう把握し、利用量を管理し、信頼性を維持し、責任を持ってアクセスを拡大するか」という課題が浮上します。
Codex はその活動に関する OpenTelemetry (OTel) メトリクスを出力できます。ローカルの Codex クライアントが Amazon Bedrock を介して OpenAI モデルを利用し、AWS IAM Identity Center で認証を行う場合、これらのメトリクスはローカルの OTel カレクターを経由して Amazon CloudWatch へルーティング可能です。その結果、ユーザー、チーム、部門、組織、あるいはコストセンターごとに整理された、AWS ネイティブな Codex の利用状況ビューが得られます。
このアプローチでは、モデルリクエストパスに中央集権型のプロキシを追加しません。開発者は引き続きローカルの Codex を使用します。各開発者のワークステーションで動作するカレクターが、ホスト上でメトリクスを受信し、組織コンテキストを付加して強化します。その後、AWS Signature Version 4 (SigV4) を用いて、リージョンごとの CloudWatch OpenTelemetry Protocol (OTLP) エンドポイントへ送信されます。
参考となるデプロイ構成では、Amazon Elastic Container Service (Amazon ECS) サービスやロードバランサー、仮想プライベートクラウド (VPC)、パブリックなインジェクションエンドポイントを構築するのではなく、CloudWatch ダッシュボードを作成します。
本稿では、このパターンがどのようにして統制された導入を可能にするかを解説し、そのアーキテクチャを検証するとともに、Codex on AWS ガイダンスリポジトリ における実装の概要をまとめます。
テレメトリをビジネスの意思決定へ
テレメトリが最も価値を発揮するのは、単にダッシュボードを生成するだけでなく、具体的な「判断」を下すための根拠を提供したときです。CodexOnBedrock に同梱されたダッシュボードでは、アクティブユーザー数、会話のターン数、API リクエスト数、トークン使用量といった指標を過去 24 時間のローリング合計で確認できます。さらに、モデル別、トークンの種類別、ユーザー別、部署別、チーム別、コストセンター別、組織別、セッションソース別など、多角的な切り口での分析ビューも用意されています。
これらのデータは、技術リーダーが「広範な採用」と「限定的な実験」を区別する手助けとなります。例えば、複数のチームでアクティブユーザー数が増加している場合は、小規模なグループに消費が集中している場合とは、必要な支援策(エンブレメント)が異なります。ツール呼び出しの活動状況を追跡すれば、エージェント型ワークフローがどの領域で定着しつつあるかを把握できます。また、リクエスト数や処理時間のメトリクスは、パフォーマンス劣化の原因を調査する際にも役立ちます。
| 経営上の問い | 利用可能なシグナル | 意思決定に活用できる点 |
|---|---|---|
| Codex の採用は拡大しているか? | アクティブユーザー、スレッド数、ターン数、および API リクエスト数 | パイロットの拡大を行うか、オンボーディングに注力するか |
| 利用はどの領域に集中しているか? | ユーザー、モデル、部署、チーム、およびコストセンター別のトークン数 | ショウバック(利用料の請求)を適用する場所、利用状況を見直す場所、またはエンパワーメントを調整する場所 |
| チームはエージェント機能を利用しているか? | ツール呼び出しのボリュームとセッションのソース | ワークフローガイダンスやシステム投資が役立つ可能性がある場所 |
| 開発者体験は信頼できるか? | API ステータス、リクエスト処理時間、およびエンドツーエンドのターン処理時間 | モデルアクセス、ネットワーク、またはクライアント側の動作を調査すべきか否か |
| サービスの費用はいくらか? | IAM プリンシパルデータを含む AWS Cost and Usage Reports (CUR) 2.0 | 請求グレードの財務レポートおよび配分 |
最後の行の区別は重要です。CloudWatch の OpenTelemetry メトリクスは、利用量と運用上の挙動を示すものであり、トークン数は傾向分析を支援するものですが、請求台帳そのものではありません。料金の見積もりが実際の請求額と異なる理由は、価格変更、割引、クレジット、および請求調整によるものです。実際に支出した金額を確認するには、AWS Cost and Usage Reports (CUR) 2.0 の IAM プリンシパル別コスト配分機能、または該当する Amazon Bedrock のコスト管理レポートを利用してください。
ソリューションの概要
本アーキテクチャでは、モデルへのアクセスとテレメトリデータの公開に同じ AWS ID を使用します。開発者は IAM Identity Center を通じてサインインし、Amazon Bedrock をモデルプロバイダーとして Codex を実行します。Codex はメトリクスを 127.0.0.1 でのみリッスンしているコレクターへ送信します。このコレクターは ID や組織属性を追加した上でメトリクスをバッチ化し、一時的な AWS クレデンシャルを使用して CloudWatch へのリクエストに署名を行います。
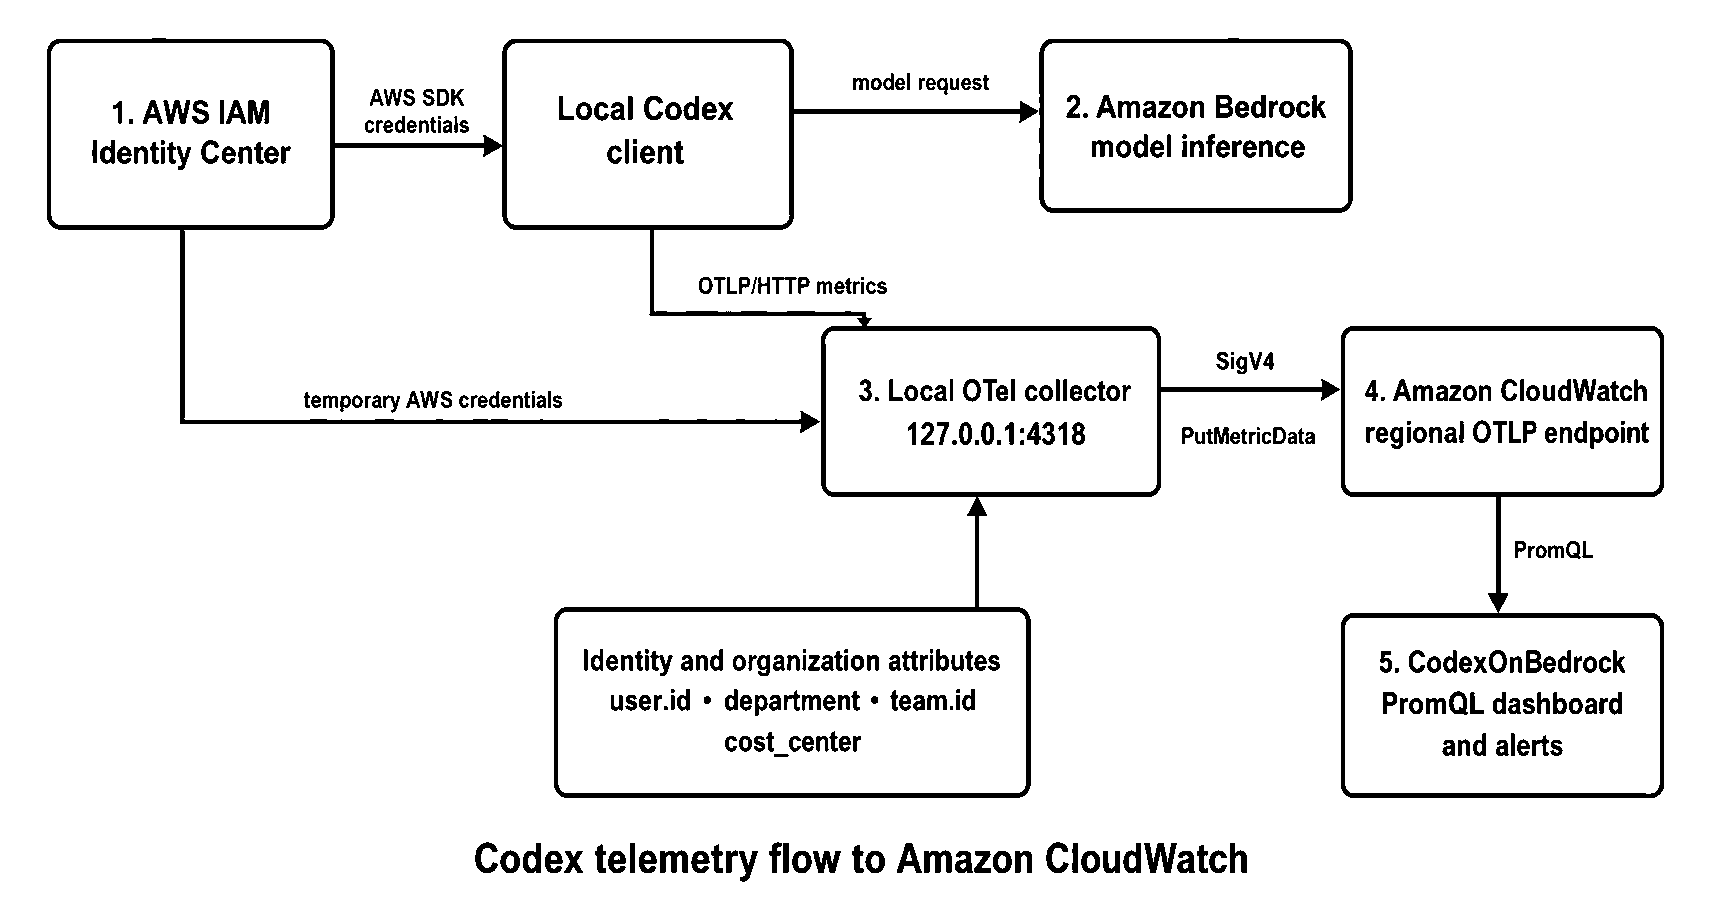
ローカルコレクターを介した Codex のテレメトリフロー。SigV4 認証でメトリクスを公開し、Amazon Bedrock の推論パスからは外れています
Codex は、codex.api_request や codex.api_request.duration_ms、codex.turn.e2e_duration_ms、codex.turn.token_usage、codex.turn.tool.call といったメトリクスを出力します。
codex.thread.started と codex.conversation.turn.count の 2 つの指標です。
現在の Codex の設定ドキュメント(Codex configuration documentation)では、OpenTelemetry(OTel)はオプトイン形式であり、ログ、メトリクス、トレースそれぞれにエクスポート機能を用意していることが記載されています。
ローカルコレクタでは、必須のリソース属性として user.id と user.email が追加されます。また、department や team.id などのオプション属性も利用可能です。
コストセンター、組織、場所、役割など (原文の技術表記: cost_center、organization、location、role)
マネージャー。参照コレクターは、これらの属性を各メトリクスデータポイントにもコピーします。 (原文の技術表記: manager)
このアプローチにより、ローカルのサイドカーおよび他のサポートされるインジェクションパターン全体で、Prometheus クエリ言語(PromQL)のグループ化が統一されます。
リファレンスパターンの実装
完全なコマンドとテンプレートは、ネイティブ AWS アクセスのクイックスタートに記載されています。以下の 5 つのステップで実装を要約します。
1. CloudWatch の OTel 機能を有効にする
リファレンス・ランブックでは、まず対象リージョンでのテレメトリに OTel エンリッチメントとリソースタグを有効化することから始めます。
aws cloudwatch start-otel-enrichment --region us-west-2
aws observabilityadmin start-telemetry-enrichment --region us-west-2
aws cloudwatch get-otel-enrichment --region us-west-2
現在の CloudWatch OTel ドキュメントでは、ネイティブな OTLP 取り込みと PromQL クエリについて説明されています。start-otel-enrichment オペレーションを使用すると、対応する AWS ベンダーメトリクスに対してデータ拡張と PromQL アクセスが可能になります。また、start-telemetry-enrichment オペレーションではリソースタグの拡張が有効になります。設定を変更する前に、アカウントレベルで既に有効になっている設定を確認してください。
2. ダッシュボードのデプロイとコレクターの構築
リポジトリをクローンした後、ダッシュボードをデプロイしてコレクターバイナリを取得します:
deployment/scripts/deploy-otel-stack.sh --region us-west-2
deployment/scripts/build-local-collector.sh --all
AWS CloudFormation スack は、CodexOnBedrock ダッシュボードをデプロイします。コレクターは開発者のワークステーション上で動作するため、このステップでは集約型のコレクター計算リソースやネットワークインフラストラクチャが作成されることはありません。
3. 開発者ごとの設定生成
認証済みの AWS プロファイルからコレクターの設定を生成します:
deployment/scripts/generate-sidecar-config.sh \
  --region us-west-2 \
  --profile codex-bedrock \
  --auto-lookup
--auto-lookup オプションを指定すると、スクリプトは IAM Identity Center の ID ストアから組織属性を読み取ることができます。コマンドラインで明示的に値を指定した場合、検出された値を上書きできます。オプションの属性が存在しない場合は、その設定ブロック全体を省略してください。次元にプレースホルダー文字列を送信しないでください。そうすると価値の低いデータ系列が生成され、レポート品質が低下します。
fleet 展開を行う場合は、この設定を既存のエンドポイント管理プロセスを通じて生成・配布してください。組織メタデータは管理対象データとして扱い、経営層向けの報告に使用する前に、承認された値、所有権、更新手順を確立しておいてください。
4. Codex の設定と最小権限の付与
Codex メトリクスエクスポート先をローカルコレクタに指定します。Codex はパスを自動で付加しないため、/v1/metrics をフルパスで含めてください:
[otel]
environment = "production"
log_user_prompt = false

[otel.metrics_exporter]
otlp-http = { endpoint = "http://127.0.0.1:4318/v1/metrics", protocol = "binary" }コレクターは、https://monitoring.us-west-2.amazonaws.com/v1/metrics のようなリージョン固有の CloudWatch OTLP メトリクスエンドポイント(リージョン別の CloudWatch OTLP エンドポイント)へメトリクスを転送します。短期 AWS 認証情報の場合、SigV4 が推奨される認証方式です。パブリッシングには cloudwatch:PutMetricData の権限が必要です。ただし、このメトリクス経路ではロググループや ECS に関する権限は不要です。
log_user_prompt = false を維持してください。本設計の目的は、ソースコードやプロンプト内容を収集することではなく、運用状況と採用状況を測定することにあります。
5. フロー全体の検証
生成された設定でサービス固有のコレクターを起動し、Codex タスクを実行した後に、CloudWatch コンソールで「CodexOnBedrock」ダッシュボードを開きます。また、CloudWatch Query Studio を使用するか、リポジトリ内の check-otel-pipeline.sh スクリプトを実行して、codex.turn.token_usage が正常に受信されていることを確認することもできます。
Codex のメトリクスは定期的に、またはプロセスが正常に終了した際にフラッシュされます。参考の運用マニュアルでは 60 秒間隔を推奨しており、エラーパスで終了時のフラッシュがスキップされる可能性のある場合のために、OTEL_METRIC_EXPORT_INTERVAL=1000 をオプションの安全策として提案しています。もしメトリクスが表示されない場合は、管理設定で [analytics] enabled = false が設定されていないか確認してください。この設定を有効にすると、Codex のメトリクスパイプライン自体が無効化されてしまうためです。
ガバナンスを意識した運用
ダッシュボードの有用性を支える同じ要素が、過度に広く公開されるとプライバシーやガバナンス上の懸念を生む可能性があります。経営層向けの報告には、チーム・部署・コストセンターごとの集計ビューを活用しましょう。ユーザー個別のダッシュボードは、承認されたシステム担当、運用担当者、セキュリティ担当、または財務担当者に限定し、従業員監視やデータ保持ポリシーと整合させる必要があります。
スケールする際にメトリクスのカーディナリティ(一意な値の数)を制御してください。属性名と値は標準化し、明確な判断基準がないフィールドは省略し、保持期間や照会計画が定まっていないプロジェクト名や一時的な識別子を不用意に追加しないようにします。CloudWatch の OpenTelemetry メトリクスは 1GB ごとのインゲーション課金であり、PromQL クエリはスキャンしたサンプル数に応じて課金されます。大規模展開を行う前に、最新の CloudWatch OTel の価格設定ドキュメント と Amazon CloudWatch の価格設定 を必ず確認してください。
このパターンにより、可視性とソフトな制御が可能になります。CloudWatch アラームや Amazon Simple Notification Service (Amazon SNS) の通知を活用して、ユーザーまたはチームが定義された利用しきい値を超えた際にアラートを発令できます。ただし、IAM Identity Center は直接、一時的な認証情報を発行するため、このローカルなテレメトリ経路ではトークン予算に基づいて Amazon Bedrock リクエストを同期的にブロックすることはできません。厳格な強制力が必要な場合は、予算制御機能を備えたパス内ゲートウェイを使用し、運用とアイデンティティの帰属に関するトレードオフを検討してください。
段階的な展開
まず、テレメトリの目的についてリーダーと開発者が合意している一つのエンジニアリンググループから始めます。アイデンティティの帰属が正確であること、ダッシュボードが実際の運用上の質問に答えていること、アクセス制御がガバナンスポリシーを反映していることを検証してください。
次に、管理された組織次元の一部を追加し、アクションが必要な条件に対するアラートを定義します。コレクターのライフサイクル、アイデンティティの更新、サポートプロセスが反復可能になった後にのみ、管理されたワークステーション構成を通じて展開を広げます。最後に、CloudWatch の利用テレメトリを CUR 2.0 レポートと組み合わせることで、リーダーは採用状況や運用行動を、請求レベルのコストとともにレビューできるようになります。
この順序により、初期投資を抑えつつ、ステークホルダーが指標とその背後にある意思決定の両方を改善する機会を得られます。
クリーンアップ
監視パターンを削除するには、開発者ワークステーション上のコレクターを停止し、ダッシュボードスタックを削除します:
aws cloudformation delete-stack \
  --stack-name codex-otel-dashboard \
  --region us-west-2

aws cloudformation wait stack-delete-complete \
  --stack-name codex-otel-dashboard \
--region us-west-2他のワークロードがアカウントレベルの拡張機能に依存していない場合、aws cloudwatch stop-otel-enrichment および aws observabilityadmin stop-telemetry-enrichment コマンドを使用して機能を無効化できるかどうか評価できます。ただし、依存関係を確認してから実施してください。これらの設定は、アカウント内の他の CloudWatch 観測ユースケースのサポートにも役立ちます。
結論
Codex のスケーリングは単なるアクセス権限の判断ではありません。開発者の支援、システムの信頼性、ガバナンス、財務責任を結びつける運用モデルに関する意思決定です。
Codex の OpenTelemetry メトリクス、IAM Identity Center の属性、ローカルコレクター、そして Amazon CloudWatch を組み合わせることで、推論パスに新しい集中型サービスを追加することなく、意思決定に必要な可視性を構築できます。CloudWatch は Codex の利用状況を可視化し、CUR 2.0 が財務上の真実の源となります。これらを併用することで、パイロット段階から統制された導入へと着実に移行する道筋が支援されます。
パイロットを開始するには、Codex on AWS native access quickstart を利用してください。その後、組織が必要とする意思決定に合わせて、分析の次元、アクセスモデル、報告頻度を調整してください。
*本記事は、公開されているガイダンスリポジトリに基づく実装パターンを説明するものです。AWS による公式発表や推奨を意味するものではありません。
著者について

クラウディオ・マッツォーニ
クラウディオは、Amazon Bedrock の GTM(Go-to-Market)チームに所属するシニアスペシャリストソリューションアーキテクトです。彼は顧客が生成 AI への移行を成功させるための道筋を示すことに長けています。仕事以外では、家族との時間を大切にし、庭いじりやウルグアイ料理の調理を楽しんでいます。

スーデシュ・サシダラン
スーデシュは OpenAI の GTM スタッフの一員で、OpenAI API や Codex に注力しています。彼の主な業務には、AWS と協力して Amazon Bedrock 上で OpenAI の最先端モデルの採用と展開を支援することが含まれています。
原文を表示
As organizations move from experimenting with coding agents to adopting them across engineering teams, the leadership question changes. It is no longer only, “Can this tool help a developer?” It becomes, “How do we understand adoption, manage consumption, maintain reliability, and scale access responsibly?”. Codex can emit OpenTelemetry (OTel) metrics about its activity. When local Codex clients use OpenAI models through Amazon Bedrock and authenticate with AWS IAM Identity Center, you can route those metrics through a local OTel collector to Amazon CloudWatch. The result is an AWS native view of Codex usage that can be organized by user, team, department, organization, or cost center.
This approach does not add a centralized proxy to the model-request path. Developers continue to use Codex locally. A collector running on each developer workstation receives metrics on the local host and enriches them with organizational context. It then sends them to the regional CloudWatch OpenTelemetry Protocol (OTLP) endpoint using AWS Signature Version 4 (SigV4). The reference deployment creates a CloudWatch dashboard, not an Amazon Elastic Container Service (Amazon ECS) service, load balancer, virtual private cloud (VPC), or public ingestion endpoint.
In this post, we explain how this pattern supports governed adoption, review its architecture, and summarize the implementation in the Codex on AWS guidance repository.
Turn telemetry into business decisions
Telemetry is most useful when it answers a decision, not simply when it produces another dashboard. The bundled CodexOnBedrock dashboard includes rolling 24-hour totals for active users, conversation turns, API requests, and token usage. It also provides views by model, token type, user, department, team, cost center, organization, and session source.
These signals can help technology leaders distinguish broad adoption from isolated experimentation. For example, an increase in active users across several teams suggests a different enablement need than high consumption concentrated among a small group. Tool-call activity can help teams see where agentic workflows are taking hold. Request and duration metrics can support investigation of degraded experiences.
| Executive question | Available signal | Decision it can inform |
|---|---|---|
| Is Codex adoption expanding? | Active users, threads, turns, and API requests | Whether to expand a pilot or focus on onboarding |
| Where is consumption concentrated? | Tokens by user, model, department, team, and cost center | Where to apply showback, review usage, or adjust enablement |
| Are teams using agentic capabilities? | Tool-call volume and session source | Where workflow guidance or system investment might help |
| Is the developer experience reliable? | API status, request duration, and end-to-end turn duration | Whether to investigate model access, networking, or client behavior |
| What did the service cost? | AWS Cost and Usage Reports (CUR) 2.0 with IAM principal data | Billing-grade financial reporting and allocation |
The distinction in the last row is important. CloudWatch OTel metrics show usage volume and operational behavior. Token counts can support trend analysis, but they are not a billing ledger. List-price estimates can diverge from actual charges because of pricing changes, discounts, credits, and billing adjustments. For realized spend, use IAM principal cost allocation from AWS Cost and Usage Reports (CUR) 2.0 or the applicable Amazon Bedrock cost-management reports.
Solution overview
The architecture uses the same AWS identity for model access and telemetry publishing. A developer signs in through IAM Identity Center and runs Codex with Amazon Bedrock as the model provider. Codex sends metrics to a collector listening only on 127.0.0.1. The collector adds identity and organizational attributes, batches the metrics, and signs requests to CloudWatch with temporary AWS credentials.
Local Codex telemetry flow to Amazon CloudWatch through a local collector that publishes metrics with SigV4 authentication and stays out of the Amazon Bedrock inference path
Codex emits metrics such as codex.api_request, codex.api_request.duration_ms, codex.turn.e2e_duration_ms, codex.turn.token_usage, codex.turn.tool.call, codex.thread.started, and codex.conversation.turn.count. The current Codex configuration documentation describes OTel as opt-in and documents separate exporters for logs, metrics, and traces.
The local collector adds user.id and user.email as required resource attributes. Optional attributes include department, team.id, cost_center, organization, location, role, and manager. The reference collector copies these attributes onto each metric datapoint as well. This approach gives the dashboard consistent Prometheus Query Language (PromQL) groupings across the local sidecar and other supported ingestion patterns.
Implement the reference pattern
The complete commands and templates are in the native AWS access quickstart. The following five stages summarize the implementation.
1. Enable the CloudWatch OTel capabilities
The reference runbook begins by enabling OTel enrichment and resource tags for telemetry in the target Region:
aws cloudwatch start-otel-enrichment --region us-west-2
aws observabilityadmin start-telemetry-enrichment --region us-west-2
aws cloudwatch get-otel-enrichment --region us-west-2
The current CloudWatch OTel documentation describes native OTLP ingestion and PromQL querying. The start-otel-enrichment operation enables enrichment and PromQL access for supported AWS vended metrics. The start-telemetry-enrichment operation enables resource-tag enrichment. Confirm which account-level settings are already enabled before changing them.
2. Deploy the dashboard and build the collector
Clone the repository, then deploy the dashboard and obtain the collector binary:
deployment/scripts/deploy-otel-stack.sh --region us-west-2
deployment/scripts/build-local-collector.sh --all
The AWS CloudFormation stack deploys the CodexOnBedrock dashboard. The collector runs on developer workstations, so this step does not create centralized collector compute or networking infrastructure.
3. Generate per-developer configuration
Generate the collector configuration from the developer’s authenticated AWS profile:
deployment/scripts/generate-sidecar-config.sh \
  --region us-west-2 \
  --profile codex-bedrock \
  --auto-lookup
With --auto-lookup, the script can read organizational attributes from the IAM Identity Center identity store. Explicit command-line values can override discovered values. If an optional attribute is unavailable, omit its entire configuration block. Do not send placeholder strings as dimensions. They create low-value series and weaken reporting quality.
For a fleet rollout, generate and distribute this configuration through your existing endpoint-management process. Treat organizational metadata as governed data: establish approved values, ownership, and update procedures before using it for executive reporting.
4. Configure Codex and grant least-privilege access
Point the Codex metrics exporter to the local collector. Include the full /v1/metrics path because Codex does not append it:
[otel]
environment = "production"
log_user_prompt = false

[otel.metrics_exporter]
otlp-http = { endpoint = "http://127.0.0.1:4318/v1/metrics", protocol = "binary" }
The collector forwards metrics to the regional CloudWatch OTLP metrics endpoint, such as https://monitoring.us-west-2.amazonaws.com/v1/metrics. SigV4 is the recommended authentication method for short-term AWS credentials. The publishing identity requires cloudwatch:PutMetricData. No log-group or ECS permissions are required for this metrics path.
Retain log_user_prompt = false. This design is intended to measure operational and adoption signals, not collect source code or prompt content.
5. Validate the complete flow
Start the service-specific collector with the generated configuration, run a Codex task, and then open the CodexOnBedrock dashboard in the CloudWatch console. You can also use CloudWatch Query Studio or the repository’s check-otel-pipeline.sh script to confirm that codex.turn.token_usage is arriving.
Codex metrics flush periodically and on a clean process exit. The reference runbook documents a 60-second interval and suggests OTEL_METRIC_EXPORT_INTERVAL=1000 as an optional safeguard for error paths that might skip the exit flush. If no metrics appear, also confirm that managed configuration has not set [analytics] enabled = false, because that setting disables the Codex metrics pipeline.
Operate with governance in mind
The same dimensions that make the dashboard useful can create privacy and governance concerns if they are exposed too broadly. Use aggregated team, department, and cost-center views for executive reporting. Restrict per-user dashboards to approved system, operations, security, or finance roles, and align access with employee-monitoring and data-retention policies.
Control metric cardinality as you scale. Standardize attribute names and values, omit fields that do not support a defined decision, and avoid adding project names or ephemeral identifiers without a retention and query plan. CloudWatch OTel metrics use per-gigabyte ingestion pricing, and PromQL queries are priced according to samples scanned. Review the current CloudWatch OTel pricing documentation and Amazon CloudWatch Pricing before a broad rollout.
This pattern provides visibility and soft controls. You can use CloudWatch alarms and Amazon Simple Notification Service (Amazon SNS) notifications to alert when a user or team crosses a defined usage threshold. However, IAM Identity Center issues temporary credentials directly. This local telemetry path cannot synchronously block an Amazon Bedrock request based on a token budget. If hard enforcement is required, use an in-path gateway with budget controls and evaluate the operational and identity-attribution tradeoffs.
Roll out in phases
Start with one engineering group whose leaders and developers agree on the purpose of the telemetry. Validate that identity attribution is accurate, the dashboard answers real operating questions, and access controls reflect your governance policy.
Next, add a small set of controlled organizational dimensions and define alerts for conditions that require action. Expand through managed workstation configuration only after the collector lifecycle, identity updates, and support process are repeatable. Finally, pair CloudWatch usage telemetry with CUR 2.0 reporting so leaders can review adoption and operational behavior alongside billing-grade costs.
This sequence keeps the initial investment small and gives stakeholders an opportunity to refine both the metrics and the decisions they support.
Clean up
To remove the monitoring pattern, stop the collector on developer workstations and delete the dashboard stack:
aws cloudformation delete-stack \
  --stack-name codex-otel-dashboard \
  --region us-west-2

aws cloudformation wait stack-delete-complete \
  --stack-name codex-otel-dashboard \
  --region us-west-2
If no other workload depends on the account-level enrichment features, you can evaluate disabling them with aws cloudwatch stop-otel-enrichment and aws observabilityadmin stop-telemetry-enrichment. Confirm dependencies first. These settings can support other CloudWatch observability use cases in the account.
まとめ
Scaling Codex is not only an access decision. It is an operating-model decision that connects developer enablement, system reliability, governance, and financial accountability.
By combining Codex OTel metrics, IAM Identity Center attributes, a local collector, and Amazon CloudWatch, organizations can build decision-ready visibility without placing a new centralized service in the inference path. CloudWatch shows how Codex is being used. CUR 2.0 provides the financial source of truth. Together, they support a measured path from pilot to governed adoption.
Use the Codex on AWS native access quickstart to begin a pilot, then adapt the dimensions, access model, and reporting cadence to the decisions your organization needs to make.
*This post describes an implementation pattern based on a public guidance repository. It does not imply publication or endorsement by AWS.*
About the authors
Claudio Mazzoni
Claudio is a Sr Specialist Solutions Architect on the Amazon Bedrock GTM team. Claudio excels at guiding customers through their Gen AI journey. Outside of work, Claudio enjoys spending time with family, working in his garden, and cooking Uruguayan food.
Sudeesh Sasidharan
Sudeesh is a Member of Go-to-Market Staff at OpenAI, focused on OpenAI APIs and Codex. His work includes collaborating with AWS on Amazon Bedrock to help organizations adopt and deploy OpenAI’s frontier models.
関連記事
News to Guide
ニュースの次に確認する
発表内容を、現在の料金や仕様と照らし合わせられる関連ガイドです。
今日のまとめ
AIデイリーブリーフで今日の重要ニュースをまとめ読み