シングルセルシーケンシングのための深層学習:細胞の多様性を見る顕微鏡
Deep learningは単一細胞シーケンシング技術の進展において重要な役割を果たしており、細胞の多様性を解明するための鍵となるツールとして1000以上の分析ソフトウェアが開発されている。
キーポイント
単一細胞シーケンシングの重要性
2013年にNatureがMethod of the Yearに選定した技術であり、細胞レベルのDNA・RNAシーケンシングを通じて細胞の不均一性を探求する重要な手法である。
Deep learningの役割
単一細胞RNAシーケンシングデータ分析において、Deep learning技術を活用した多数のツールが開発されており、技術進展の主要な推進力となっている。
分析ツールの急増
scRNA-toolsデータベースでは2016年から単一細胞RNAデータ分析ソフトウェアを収集しており、2021年までに1000以上のツールが登録されている。
ゲノム情報の複雑性
ヒトゲノムは30億塩基対からなり、約20,000〜25,000の遺伝子を含むが、これらは全ゲノムの約1%のみを占めるタンパク質コード領域である。
影響分析・編集コメントを表示
影響分析
この記事は、Deep learningが生命科学分野、特に単一細胞解析において重要な技術的進歩をもたらしていることを示している。医療研究や疾患理解への応用可能性が高く、AIとバイオテクノロジーの融合トレンドを象徴する内容である。
編集コメント
AI技術が生命科学の基礎研究に深く浸透している好例。専門的な内容ながら、Deep learningの実用的応用例として非常に示唆に富む。
 image 生きているすべての生物の歴史は、そのゲノムに記されています。ゲノムは DNA として保存され、体内のほぼすべての細胞に含まれています。同じ DNA を持ち、同じ細胞種であっても、2 つの細胞が完全に同一であることはありません。なぜなら、DNA がどのように発現するかを制御する調節因子において違いがあるからです。
ヒトのゲノムは、30 億塩基対からなり、23 本の染色体に広がっています。この膨大な遺伝コードの中には、約 2 万から 2 万 5 千個の遺伝子があり、タンパク質をコードする DNA を構成し、全ゲノムの約 1% を占めています [1]。
体内の複雑なシステム、特にこの小さなコーディング領域の機能を探求するためには、精密なシーケンシング手法が必要であり、シングルセルシーケンシング(sc-seq)技術がこの目的に最適です。
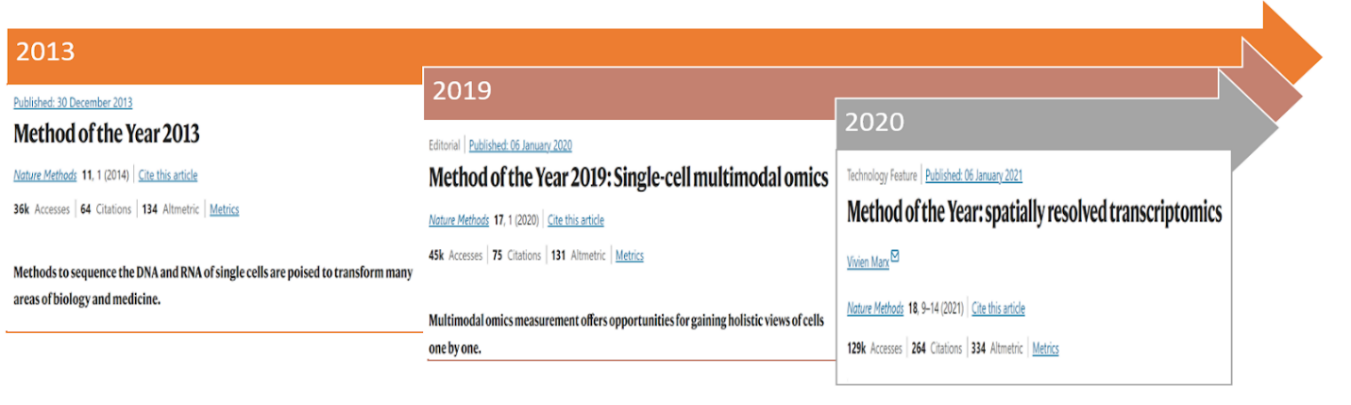
2013 年、Nature は単一細胞 RNA シーケンシングを「今年の手法」に選定しました [2](図 3)。これは、個々の細胞レベルで DNA および RNA をシーケンシングすることで細胞の多様性を探索する上でこの手法が極めて重要であることを強調したものです。その後、単一細胞 RNA シーケンシングデータの解析のための多数のツールが登場しました。例えば、scRNA-tools データベースは 2016 年から単一細胞 RNA データの解析ソフトウェアを収集し始めており、2021 年までに 1000 以上のツールが登録されています [3]。これらのツールの多くには深層学習(Deep Learning)技術を活用した手法が含まれており、本稿ではこれらに焦点を当てます。特に、単一細胞シーケンシング技術の進展における鍵となる推進役として深層学習が果たしてきた決定的な役割について探求していきます。
背景
細胞内における遺伝情報の DNA からタンパク質への流れ
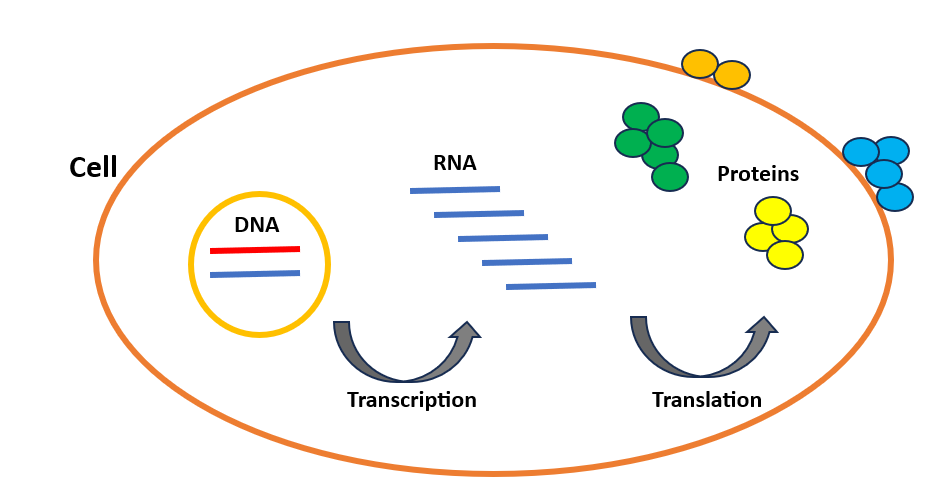
まず、細胞と配列が具体的に何を指すのかを確認しましょう。細胞は私たちの体の基本単位であり、体が健康に機能する仕組みや、分子の機能不全がどのように疾患につながるかを理解するための鍵です。私たちの体は数兆個の細胞で構成されており、ほぼすべての細胞には遺伝情報の3つの層、つまりDNA、RNA、タンパク質が含まれています。DNAは各人を独自のものにする遺伝コードを含む長い分子です。ソースコードのように、体内の各タンパク質をどのように作るかを示す複数の命令を含んでいます。これらのタンパク質は細胞の主要な働き手であり、細胞生命に必要なほぼすべてのタスクを実行します。例えば、細胞内の化学反応を触媒する酵素や、細胞分裂中のDNA複製に関与するDNAポリメラーゼもすべてタンパク質です。細胞はタンパク質を2段階で合成します:転写と翻訳(図1)であり、これらは遺伝子発現として知られています。まずDNAがRNAに転写され、その後RNAがタンパク質に翻訳されます。RNAはDNAとタンパク質の間のメッセンジャーと考えることができます。
私たちの体の細胞はすべて同じ DNA を共有していますが、生物学的な活動には違いがあります。例えば、免疫細胞と心臓細胞の違いは、これらの細胞内で活性化または不活性化されている遺伝子によって決定されます。一般的に、ある遺伝子が活性化されると、より多くの RNA コピーが作られ、タンパク質の産生が増加します。したがって、細胞の種類は合成される RNA/タンパク質分子の数と種類に基づいて異なるため、単一細胞レベルでこれらの分子の存在量を評価することは興味深いことです。これにより、各細胞内の DNA の挙動を調査し、体のさまざまな部分について高解像度の視点を得ることが可能になります。
一般的に、すべての単一細胞シーケンシング技術は、以下の 3 つの主要なステップに分類できます:
関心のある組織から単一細胞を分離し、各分離された細胞から遺伝物質を抽出する
各分離された細胞からの遺伝物質を増幅し、ライブラリー調製を行う
次世代シーケンサーを用いてライブラリーをシーケンシングし、データ解析を行う
細胞生物学および単一細胞シーケンシング技術の複雑なステップをたどる中で、決定的な問いが生じます:単一細胞シーケンシングデータはどのように数値的に表現されるのでしょうか?
単一細胞シーケンシングデータの構造
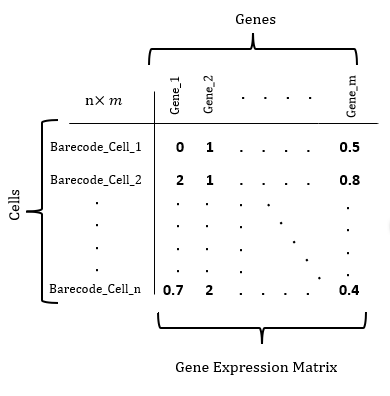
単一細胞シーケンシングデータの構造は行列(図 2)の形式をとります。ここで各行はシーケンシングされ、一意のバーコードで注釈付けされた細胞に対応します。行数は実験で解析された細胞の総数に等しくなります。一方、各列は特定の遺伝子に対応します。遺伝子はゲノムの機能単位であり、タンパク質や他の機能的分子の合成のための指示を符号化するものです。scRNA seq データの場合、行列内の数値エントリは個々の細胞における遺伝子の発現レベルを表します。これらの値は、特定の細胞内で各遺伝子から産生される RNA の量を示し、異なる細胞内での遺伝子の活性に関する洞察を提供します。
Single Cell Sequencing Overview
150 年以上にわたり、生物学者たちは人体を構成するすべての細胞タイプを同定し、その性質の正確な記述に基づいて明確なタイプに分類することを望んできました。ヒトゲノムプロジェクト [4] の遺伝子版である「ヒト細胞アトラス・プロジェクト(HCAP)」は、人体内のすべての細胞をマッピングするための国際的な共同取り組みです。「私たちはヒト細胞アトラスを、人体を一貫性かつ体系的に描き出そうとする地図の試みとして概念化できます。Google マップが複雑な詳細をより詳しく観察するためにズームインできる機能を提供するように、ヒト細胞アトラスは空間情報や内部属性、さらには要素間の関係性についての洞察をもたらします」と、MIT とハーバード大学の Broad Institute に所属する計算生物学・システム生物学の専門家であり、ジェネンテック社の研究担当執行副社長であるアビブ・レゲヴ氏は説明しています。
この比喩は、単一細胞シーケンシングのより広範な影響と見事に一致しており、これは集団全体ではなく個々の細胞を分析することを可能にします。この技術は、発生プロセスに関連する複雑な生物学的問いへの対応や、さまざまな治療条件や疾患状態における不均質な細胞または遺伝的変化の理解において極めて貴重なものとなります。さらに、特定の細胞集団内に存在する新たな細胞種の同定も容易にします。2009 年に最初の単一細胞 RNA シーケンシング(scRNA-seq)論文 [5] が発表され、その後 2013 年に「年の技術」[2] と指定されたことは、単一細胞トランスクリプトームの複雑さを解明するために実験手法と計算手法の双方を進展させるという広範な取り組みの始まりを示すものです。
技術環境が進化するにつれて、物語は単一細胞研究の進展へと移行し、特に複雑な細胞集団を研究する際の費用対効果の高さから、初期には単一細胞 RNA 配列解析(scRNA-seq)に焦点が当てられてきました。「ある意味では、RNA は測定しやすいものの一つでした」と、ニューヨークゲノムセンター(NYGC)の研究者である Satija [6] は述べています。しかし、単一細胞技術の急速な発展は、多様性のある可能性を切り開く新たな時代、すなわちマルチモーダル単一細胞データ統合の幕開けをもたらしました。これは Nature [7] によって「2019 年の手法」として認定され(図 3)、同じ細胞内でゲノム、エピゲノム、プロテオームなど、異なる細胞モダリティを測定することを可能にします。複数の情報層を重ね合わせることで細胞の正体に関する強力な洞察が得られる一方、マルチモーダル測定から生成されたデータセットを効果的にモデル化し統合する課題も生じます。この統合への挑戦は、Multi-view learning [8] 手法の導入によって対処され、モダリティ間での共通の変異を探求します。深層学習技術を組み込んだこの洗練されたアプローチは、生物学や生物医学をはじめとする様々な分野で関連する成果を示しています。
これらの進展の中で、単一細胞 RNA シーケンシングの永続的な限界である、細胞を元の位置から分離することで転写体プロファイリング中に空間情報が失われるという明確な課題が浮上しています。空間分解能トランスクリプトミクス(SRT)は、複雑な生物系を研究する際に空間の詳細情報を保持することにより、この課題に対処する決定的な解決策として登場しました [9]。2020 年の「今年の手法」として空間分解能トランスクリプトミクスが認識されたことは、複雑な生物系に対する理解を深めることに内在する課題に対する重要な解決策としての地位を確固たるものにするものです。
単一細胞シーケンシングのパノラマを探求した後、今度は単一細胞シーケンシングの文脈におけるディープラーニングの役割について深く掘り下げていきましょう。
単一細胞シーケンシングにおけるディープラーニング
深層学習は、単一細胞シーケンシングデータの複雑性を処理する能力により、単一細胞解析においてますます採用されています。一方、従来の機械学習アプローチでは、ドメインの専門家によって設計される特徴量エンジニアリング戦略の開発に多大な労力を要します。しかし、深層学習アプローチは、単一細胞シーケンシングデータから関連する特性を自律的に捉えることで、単一細胞シーケンシング実験間の不均質性や、そのようなデータに伴うノイズおよびスパース性を解決します。以下に、単一細胞シーケンシングにおける深層学習の適用に関する3 つの主要な理由を示します。
高次元データ:単一細胞シーケンシングは、各細胞について数千の遺伝子とその発現レベルを測定する高次元データを生成します。深層学習モデルは、このデータ内の複雑な関係やパターンを捉えるのに優れており、これは従来の統計手法では困難な場合があります。
非線形性:単一細胞遺伝子発現データは、遺伝子発現間および細胞間の不均質性の間に内在する非線形性を特徴としています。従来の統計手法は、単一細胞遺伝子発現データに存在する非線形関係を捉えることに困難を抱えます。一方、深層学習モデルは柔軟であり、複雑な非線形マッピングを学習できる能力を持っています。
不均一性:単細胞データは、遺伝子発現プロファイルが異なる多様な細胞集団を特徴とし、複雑な景観を示します。ディープラーニングモデルは、これらの固有の細胞種やサブ集団を同定し、クラスタリングし、特徴づける上で重要な役割を果たす可能性があり、これによりサンプル内の細胞不均一性に対するより深い理解が促進されます。
単細胞シーケンシングデータにおけるディープラーニングの使用理由を探求するにつれ、次の疑問が生じます:sc-seq データ解析にはどのようなディープラーニングアーキテクチャがよく用いられているのでしょうか?
オートエンコーダーの背景
オートエンコーダー(AE)は、GAN や RNN などさまざまな深層学習アーキテクチャの中で、単一細胞シーケンシングデータの複雑さを解読するための特に信頼性の高い手法として際立っています。これは、単一細胞シーケンシングデータに内在する不均質性を保持しながら次元削減を行うために広く採用されています。オートエンコーダーによって生成された低次元空間で細胞をクラスタリングすることで、研究者は異なる細胞種やサブ集団を効果的に同定し特徴づけることができます。このアプローチにより、単一細胞データセット内の多様な細胞成分を識別・分析する能力が向上します。Seurat [10] などの確立された scRNA-seq データ解析ソフトウェアに不可欠な構成要素である主成分分析(PCA)のような非深層学習モデルとは対照的に、オートエンコーダーは非線形多様体を解明することで独自性を発揮します。PCA が線形変換に制約されるのに対し、複雑な非線形マッピングを捉えるためのオートエンコーダーの柔軟性は、単一細胞ゲノミクスに埋め込まれた微妙な関係性を見つけるための先進的な手法となっています。
オートエンコーダーに関連する過学習の課題を緩和するため、sc-seq データの文脈において特に利点を提供するように設計された、いくつかの構造上の改良が実施されています。sc-seq データの文脈でよく用いられる顕著な適応の一つに、ノイズ除去オートエンコーダー(Denoising Autoencoder: DAEs)があります。これは、初期ネットワーク層にノイズを導入することで、オートエンコーダーの再構成能力を強化するものです。具体的には、ユニットの一部をランダムにゼロに変換します。その後、ノイズ除去オートエンコーダーは、この意図的に損なわれたバージョンから入力データを再構築し、ネットワークがより関連性の高い特徴を捉えるようにし、単に入力を暗記してしまう(過学習)ことを防ぎます。この改良により、モデルのデータノイズに対する耐性が大幅に強化され、sc-seq データから導出されるサンプルの低次元表現(すなわちボトルネック)の品質が向上します。
sc-seq データ解析において頻繁に用いられるオートエンコーダーの第 3 の変種として、variational autoencoders (VAEs) が挙げられます。これは scGen [19]、scVI [14]、scANVI [28] などのモデルによって具体化されています。VAE は生成モデルの一種であり、データの潜在表現分布を学習します。データを p 次元の潜在変数のベクトルとして符号化するのではなく、データはサイズが p の 2 つのベクトルに符号化されます。すなわち、平均値 η を表すベクトルと標準偏差 σ を表すベクトルです。VAE は符号化プロセスに確率的要素を導入し、合成単一細胞データの生成を可能にし、細胞集団内の多様性に関する洞察を提供します。この微妙なアプローチは、単一細胞ゲノミクスの探索に対して、さらに複雑さと豊かさを付加するもう一つの層を加えるものです。
深層学習の sc-seq データ解析への応用
本節では、sc-seq データ解析のさまざまな段階を改善するための深層学習の主な応用について概説し、プロセスの重要な側面を進展させる上でのその有効性を強調します。
scRNA-seq データの補完とノイズ除去
シングルセル RNA シーケンシング(scRNA-seq)データは本質的な課題に直面しており、その中でドロップアウト事象が顕著な懸念事項となっています。これは遺伝子発現マトリックス内のスパース性(疎性)、すなわち多数のゼロ値を特徴とする状態を引き起こし、重大な問題をもたらします。このスパース性は、下流のバイオインフォマティクス解析に大きな影響を与えます。これらのゼロ値の多くは、遺伝子発現の不十分さやキャプチャ率・シーケンシング深度の低さ、あるいはその他の技術的要因など、シーケンシング手法の欠陥によって人為的に生じたものです。その結果、観測されたゼロ値は真の基礎的な発現レベルを正確に反映していません。したがって、scRNA-seq データ内のすべてのゼロ値が単なる欠損値として扱えるわけではなく、従来の統計的アプローチである欠損値の代入(imputation)とは異なる性質を持っています。真のゼロと偽のゼロのカウント間の複雑な区別を考慮すると、事前に定義された欠損値を持つ伝統的な代入手法は、scRNA-seq データに対して不十分となる可能性があります。例えば、平均代入法のような古典的な代入手法では、これらのゼロ値をその遺伝子の全細胞における平均発現レベルで置き換えることになりますが、このアプローチには、scRNA-seq データにおけるドロップアウト事象によって生じた複雑さを過度に単純化するリスクがあり、結果としてバイアスのかかった解釈を招く可能性があります。
ScRNA-seq データの補完手法は、深層学習に基づく補完手法と非深層学習に基づく補完手法の 2 つのカテゴリーに分類されます。非深層学習による補完アルゴリズムには、統計確率モデルを適合させるか、発現行列を利用して平滑化や拡散を行う方法が含まれます。この簡素さにより、特定の種類のサンプルに対して効果的なものとなっています。例えば、Wagner ら [11] は k 近傍法(KNN)を利用し、細胞間の最近傍ノードを特定して遺伝子固有のユニーク分子識別子(UMI)カウントを集約することで、遺伝子発現行列を補完しました。一方、Huang ら [12] は SVAER アルゴリズムを提案し、遺伝子間関係を活用して遺伝子発現行列を補完する手法を示しました。より大規模なデータセット(数万個以上の細胞を含む)、高次元でスパースかつ複雑な scRNA-seq データにおいては、従来の計算手法では困難に直面することが多く、これらの手法を用いた分析が困難あるいは不可能となることがあります。そのため、多くの研究者はこれらの課題に対処するために深層学習に基づく手法の設計に取り組んでいます。
dropout イベントを補完するための深層学習アルゴリズムの多くは、オートエンコーダー(AE)に基づいています。例えば、2018 年に Eraslan ら [13] は、ディープカウントオートエンコーダー(DCA)を紹介しました。DCA は、単一細胞 RNA シーケンシング(scRNA-seq)データにおける dropout イベントに対処するために、深層オートエンコーダーアーキテクチャを利用します。これは、decoder 部に確率的層を組み込むことで dropout プロセスをモデル化します。この確率的層は、dropout イベントに伴う不確実性を考慮し、モデルが補完値の分布を生成できるようにします。scRNA-seq のカウントデータの特徴を捉えるため、DCA は観測されたカウントが負の二項分布から生じるとしてモデル化します。
単一細胞変分推論(scVI)は、Lopez ら [14] によって導入された別の深層学習アルゴリズムです。scVI は、深層学習と確率モデリングを組み合わせ、scRNA-seq データの背後にある構造を捉えるための確率的変分オートエンコーダー(VAE)です。scVI は、補完やノイズ除去、および scRNA-seq データ分析に関連するさまざまなタスクに使用できます。DCA モデルとは対照的に、scVI は decoder 部でゼロ膨れ負の二項分布(ZINB)を採用し、各細胞内の各遺伝子に対する可能なカウント数の分布を生成します。ゼロ膨れ負の二項分布(ZINB)は、遺伝子発現がゼロである確率(dropout イベントをモデル化するため)と、正の値の分布(非ゼロカウントをモデル化するため)の両方をモデル化することを可能にします。
さらに、別の研究では、scScope [15] と呼ばれるモデルに再帰ネットワーク層を導入することで、scRNA-seq データの補完課題に取り組んでいます。この新しいアーキテクチャは、入力される scRNA-seq データのゼロ値エントリに対して反復的に補完処理を実行します。scScope の設計における柔軟性により、選択された再帰ステップ数(T)を通じて、補完結果を反復的に改善することが可能になります。特筆すべき点は、scScope の時間的再帰回数を 1 に制限する(すなわち T = 1)と、モデルが従来のオートエンコーダー(AE: Autoencoder)に変換されるという事実です。scScope は本質的に従来の AE の改良版であるため、その実行時間は他の AE ベースのモデルと比較して同等となります。
深層学習を scRNA-seq データの補完およびノイズ除去に適用することが特に有利である理由は、遺伝子間の非線形関係を捉える能力にあります。これは標準的な線形アプローチとは対照的であり、単一細胞ゲノミクスの文脈において、より情報に基づいた正確な補完戦略を提供する上で深層学習が優れていることを示しています。
バッチ効果の除去
シングルセルデータは、実験ラボ、プロトコル、サンプル組成、さらには技術プラットフォームが異なる多様な実験から集約されることが一般的です。これらの違いはデータ内に顕著な変動やバッチ効果をもたらすため、データ統合の過程において関心のある生物学的変動を分析する際に課題となります。この問題に対処するため、異なるバッチまたは研究からの細胞を統合する際には、技術的な分散を取り除くことでバッチ効果を補正する必要があります。バッチ補正のために最初に現れる手法は、Limma パッケージ [16] に基づく線形回帰に基づく線形的手法であり、これは removeBatchEffect 関数を提供し、直線を適合させます
原文を表示
imageThe history of each living being is written in its genome, which is stored as DNA and present in nearly every cell of the body. No two cells are the same, even if they share the same DNA and cell type, as they still differ in the regulators that control how DNA is expressed by the cell. The human genome consists of 3 billion base pairs spread over 23 chromosomes. Within this vast genetic code, there are approximately 20,000 to 25,000 genes, constituting the protein-coding DNA and accounting for about 1% of the total genome [1]. To explore the functioning of complex systems in our bodies, especially this small coding portion of DNA, a precise sequencing method is necessary, and single-cell sequencing (sc-seq) technology fits this purpose.
In 2013, Nature selected single-cell RNA sequencing as the Method of the Year [2] (Figure 3), highlighting the importance of this method for exploring cellular heterogeneity through the sequencing of DNA and RNA at the individual cell level. Subsequently, numerous tools have emerged for the analysis of single-cell RNA sequencing data. For example, the scRNA-tools database has been compiling software for the analysis of single-cell RNA data since 2016, and by 2021, the database includes over 1000 tools [3]. Among these tools, many involve methods that leverage Deep Learning techniques, which will be the focus of this article – we will explore the pivotal role that Deep Learning, in particular, has played as a key enabler for advancing single-cell sequencing technologies.
Background
Flow of genetic information from DNA to protein in cells
Let’s first go over what exactly cells and sequences are. The cell is the fundamental unit of our bodies and the key to understanding how our bodies function in good health and how molecular dysfunction leads to disease. Our bodies are made of trillions of cells, and nearly every cell contains three genetic information layers: DNA, RNA, and protein. DNA is a long molecule containing the genetic code that makes each person unique. Like a source code, it includes several instructions showing how to make each protein in our bodies. These proteins are the workhorses of the cell that carry out nearly every task necessary for cellular life. For example, the enzymes that catalyze chemical reactions within the cell and DNA polymerases that contribute to DNA replication during cell division, are all proteins. The cell synthesizes proteins in two steps: Transcription and Translation (Figure 1), which are known as gene expression. DNA is first transcribed into RNA, then RNA is translated into protein. We can consider RNA as a messenger between DNA and protein.
In general, all single-cell sequencing technologies can be divided into three main steps:
Isolation of single cells from the tissue of interest and extraction of genetic material from each isolated cell
Amplification of genetic material from each isolated cell and library preparation
Sequencing of the library using a next-generation sequencer and data analysis
Navigating through the intricate steps of cellular biology and single-cell sequencing technologies, a pivotal question emerges: How is single-cell sequencing data represented numerically?
Structure of single-cell sequencing data
The structure of single-cell sequencing data takes the form of a matrix (Figure 2), where each row corresponds to a cell that has been sequenced and annotated with a unique barcode. The number of rows equals the total number of cells analyzed in the experiment. On the other hand, each column corresponds to a specific gene. Genes are the functional units of the genome that encode instructions for the synthesis of proteins or other functional molecules. In the case of scRNA seq data, the numerical entries in the matrix represent the expression levels of genes in individual cells. These values indicate the amount of RNA produced from each gene in a particular cell, providing insights into the activity of genes within different cells.
For more than 150 years, biologists have wanted to identify all the cell types in the human body and classify them into distinct types based on accurate descriptions of their properties. The Human Cell Atlas Project (HCAP), the genetic equivalent of the Human Genome Project [4], is an international collaborative effort to map all the cells in the human body.” We can conceptualize the Human Cell Atlas as a map endeavoring to portray the human body coherently and systematically. Much like Google Maps, which allows us to zoom in for a closer examination of intricate details, the Human Cell Atlas provides insights into spatial information, internal attributes, and even the relationships among elements”, explains Aviv Regev, a computational and systems biologist at the Broad Institute of MIT and Harvard and Executive Vice President and Head of Genentech Research.
This analogy seamlessly aligns with the broader impact of single-cell sequencing, since it allows the analysis of individual cells instead of bulk populations. This technology proves invaluable in addressing intricate biological inquiries related to developmental processes and comprehending heterogeneous cellular or genetic changes under various treatment conditions or disease states. Additionally, it facilitates the identification of novel cell types within a given cellular population. The initiation of the first single-cell RNA sequencing (scRNA-seq) paper in 2009 [5], subsequently designated as the "method of the year" in 2013 [2], marked the genesis of an extensive endeavor to advance both experimental and computational techniques dedicated to unraveling the intricacies of single-cell transcriptomes.
As the technological landscape evolves, the narrative transitions to the advancements in single-cell research, particularly the early focus on single-cell RNA sequencing (scRNA-seq) due to its cost-effectiveness in studying complex cell populations.” In some ways, RNA has always been one of the easiest things to measure,” says Satija [6], a researcher at the New York Genome Center (NYGC). Yet, the rapid development of single-cell technology has ushered in a new era of possibilities—multimodal single-cell data integration. Recognized as the "Method of the Year 2019" by Nature [7] (Figure 3), this approach allows the measurement of different cellular modalities, including the genome, epigenome, and proteome, within the same cell. The layering of multiple pieces of information provides powerful insights into cellular identity, posing the challenge of effectively modeling and combining datasets generated from multimodal measurements. This integration challenge is met with the introduction of Multi-view learning [8] methods, exploring common variations across modalities. This sophisticated approach, incorporating deep learning techniques, showcases relevant results across various fields, particularly in biology and biomedicine.
Amidst these advancements, a distinct challenge surfaces in the persistent limitation of single-cell RNA sequencing—the loss of spatial information during transcriptome profiling by isolating cells from their original position. Spatially resolved transcriptomics (SRT) emerges as a pivotal solution [9], addressing the challenge by preserving spatial details during the study of complex biological systems. This recognition of spatially resolved transcriptomics as the method of the year 2020 solidifies its place as a critical solution to the challenges inherent in advancing our understanding of complex biological systems.
Deep Learning on single-cell sequencing
Deep learning is increasingly employed in single-cell analysis due to its capacity to handle the complexity of single-cell sequencing data. In contrast, conventional machine-learning approaches require significant effort to develop a feature engineering strategy, typically designed by domain experts. The deep learning approach, however, autonomously captures relevant characteristics from single-cell sequencing data, addressing the heterogeneity between single-cell sequencing experiments, as well as the associated noise and sparsity in such data. Below are three key reasons for the application of deep learning in single-cell sequencing:
High-Dimensional Data: Single-cell sequencing generates high-dimensional data, with thousands of genes and their expression levels measured for each cell. Deep learning models are adept at capturing complex relationships and patterns within this data, which can be challenging for traditional statistical methods.
Non-Linearity: Single-cell gene expression data is characterized by its inherent nonlinearity between gene expressions and cell-to-cell heterogeneity. Traditional statistical methods encounter difficulties in capturing the non-linear relationships present in single-cell gene expression data. In contrast, deep learning models are flexible and able to learn complex non-linear mappings.
Heterogeneity: Single-cell data is often characterized by diverse cell populations with varying gene expression profiles, presenting a complex landscape. Deep learning models can play a crucial role in identifying, clustering, and characterizing these distinct cell types or subpopulations, thereby facilitating a deeper understanding of cellular heterogeneity within a sample.
As we explore the reasons behind using deep learning in single-cell sequencing data, it leads us to the question: What deep learning architectures are often used in sc-seq data analysis?
Background on Autoencoders
Autoencoders (AEs) stand out among various deep-learning architectures (such as GANs and RNNs) as an especially relied upon method for decoding the complexities of single-cell sequencing data. Widely employed for dimensionality reduction while preserving the inherent heterogeneity in the single-cell sequencing data. By clustering cells in the reduced-dimensional space generated by autoencoders, researchers can effectively identify and characterize different cell types or subpopulations. This approach enhances our ability to discern and analyze the diverse cellular components within single-cell datasets. In contrast to non-deep learning models, such as principal component analysis (PCA), which are integral components of established scRNA-seq data analysis software like Seurat [10], autoencoders distinguish themselves by uncovering non-linear manifolds. While PCA is constrained to linear transformations, the flexibility of autoencoders to capture complex non-linear mappings makes it an advanced method to find nuanced relationships embedded in single-cell genomics.
To mitigate the overfitting challenge associated with autoencoders, several enhancements to the autoencoder structure have been implemented, specifically tailored to offer advantages in the context of sc-seq data. One notable adaptation often used in the context of sc-seq data is the denoising autoencoder (DAEs), which amplifies the autoencoder's reconstruction capability by introducing noise to the initial network layer. This involves randomly transforming some of its units to zero. The Denoising Autoencoder then reconstructs the input from this intentionally corrupted version, empowering the network to capture more relevant features and preventing it from merely memorizing the input (overfitting). This refinement significantly bolsters the model's resilience against data noise, thereby elevating the quality of the low-dimensional representation of samples (i.e., bottleneck) derived from the sc-seq data.
A third variation of autoencoders frequently employed in sc-seq data analysis is variational autoencoders (VAEs), exemplified by models like scGen [19], scVI [14], scANVI [28], etc. VAEs, as a type of generative model, learn a latent representation distribution of the data. Instead of encoding the data into a vector of p-dimensional latent variables, the data is encoded into two vectors of size p: a vector of means η and a vector of standard deviations σ. VAEs introduce a probabilistic element to the encoding process, facilitating the generation of synthetic single-cell data and offering insights into the diversity within a cell population. This nuanced approach adds another layer of complexity and richness to the exploration of single-cell genomics.
Applications of deep learning in sc-seq data analysis
This section outlines the main applications of deep learning in improving various stages of sc-seq data analysis, highlighting its effectiveness in advancing crucial aspects of the process.
scRNA-seq data imputation and denoising
Single-cell RNA sequencing (scRNA-seq) data encounter inherent challenges, with dropout events being a prominent concern that leads to significant issues—resulting in sparsity within the gene expression matrix, often characterized by a substantial number of zero values. This sparsity significantly shapes downstream bioinformatics analyses. Many of these zero values arise artificially due to deficiencies in sequencing techniques, including problems like inadequate gene expression, low capture rates, sequencing depth, or other technical factors. As a consequence, the observed zero values do not accurately reflect the true underlying expression levels. Hence, not all zeros in scRNA-seq data can be considered mere missing values, deviating from the conventional statistical approach of imputing missing data values. Given the intricate distinction between true and false zero counts, traditional imputation methods with predefined missing values may prove inadequate for scRNA-seq data. For instance, a classical imputation method, like Mean Imputation, might entail substituting these zero values with the average expression level of that gene across all cells. However, this approach runs the risk of oversimplifying the complexities introduced by dropout events in scRNA-seq data, potentially leading to biased interpretations.
ScRNA-seq data imputation methods can be divided into two categories: deep learning–based imputation method and non–deep learning imputation method. The non–deep learning imputation algorithms involve fitting statistical probability models or utilizing the expression matrix for smoothing and diffusion. This simplicity renders it effective for certain types of samples. For example, Wagner et al. [11] utilized the k-nearest neighbors (KNN) method, identifying nearest neighbors between cells and aggregating gene-specific Unique Molecular Identifiers (UMI) counts to impute the gene expression matrix. In contrast, Huang et al. [12] proposed the SVAER algorithm, leveraging gene-to-gene relationships for imputing the gene expression matrix. For larger datasets (comprising tens of thousands or more), high-dimensional, sparse, and complex scRNA-seq data, traditional computational methods face difficulties, often rendering analysis using these methods difficult and infeasible. Consequently, many researchers have turned to designing methods based on deep learning to address these challenges.
Most deep learning algorithms for imputing dropout events are based on autoencoders (AEs). For instance, in 2018, Eraslan et al. [13] introduced the deep count autoencoder (DCA). DCA utilizes a deep autoencoder architecture to address dropout events in single-cell RNA sequencing (scRNA-seq) data. It incorporates a probabilistic layer in the decoder to model the dropout process. This probabilistic layer accommodates the uncertainty associated with dropout events, enabling the model to generate a distribution of possible imputed values. To capture the characteristics of count data in scRNA-seq, DCA models the observed counts as originating from a negative binomial distribution.
Single-cell variational inference (scVI) is another deep learning algorithm introduced by Lopez et al. [14]. ScVI is a probabilistic variational autoencoder (VAE) that combines deep learning and probabilistic modeling to capture the underlying structure of the scRNA-seq data. ScVI can be used for imputation, denoising, and various other tasks related to the analysis of scRNA-seq data. In contrast to the DCA model, scVI employs Zero-Inflated Negative Binomial (ZINB) distribution in the decoder part to generate a distribution of possible counts for each gene in each cell. The Zero-Inflated Negative Binomial (ZINB) distribution allows modeling the probability of a gene expression being zero (to model dropout events) as well as the distribution of positive values (to model non-zero counts).
Additionally, another study addressed the scRNA-seq data imputation challenge by introducing a recurrent network layer in their model, known as scScope [15]. This novel architecture iteratively performs imputations on zero-valued entries of input scRNA-seq data. The flexibility of scScope's design allows for the iterative improvement of imputed outputs through a chosen number of recurrent steps (T). Noteworthy is the fact that reducing the time recurrence of scScope to one (i.e., T = 1) transforms the model into a traditional autoencoder (AE). As scScope is essentially a modification of traditional AEs, its runtime is comparable to other AE-based models.
It's important to note that the application of deep learning in scRNA-seq data imputation and denoising is particularly advantageous due to its ability to capture non-linear relationships among genes. This contrasts with standard linear approaches, making deep learning more adept at providing informed and accurate imputation strategies in the context of single-cell genomics.
Batch effect removal
Single-cell data is commonly aggregated from diverse experiments that vary in terms of experimental laboratories, protocols, sample compositions, and even technology platforms. These differences result in significant variations or batch effects within the data, posing a challenge in the analysis of biological variations of interest during the process of data integration. To address this issue, it becomes necessary to correct batch effects by removing technical variance when integrating cells from different batches or studies. The first method that appears for batch correction is a linear method based on linear regression such as Limma package [16] that provides the removeBatchEffect function which fits a line
関連記事
今日のまとめ
AI日報で今日の重要ニュースをまとめ読み