Claudeがチャット内でインタラクティブなチャートと視覚化を直接作成可能に
本文の状態
日本語全文を表示中
詳細モードで約1分の本文を読めます。
同じ出来事の情報源
6媒体で確認
CyberAgent Developers Blog · Anthropic News · InfoQ · The Decoder · Claude Blog · Simon Willison Blog
各社の報じ方を比較 ↓AnthropicはAIチャットボットClaudeに、会話内でインタラクティブな図表や視覚化を生成する新機能をベータ公開した。
Source Article
元記事を日本語で読む
本文に関係しない購読案内、埋め込み通知、サイト内プロモーションは除いています。
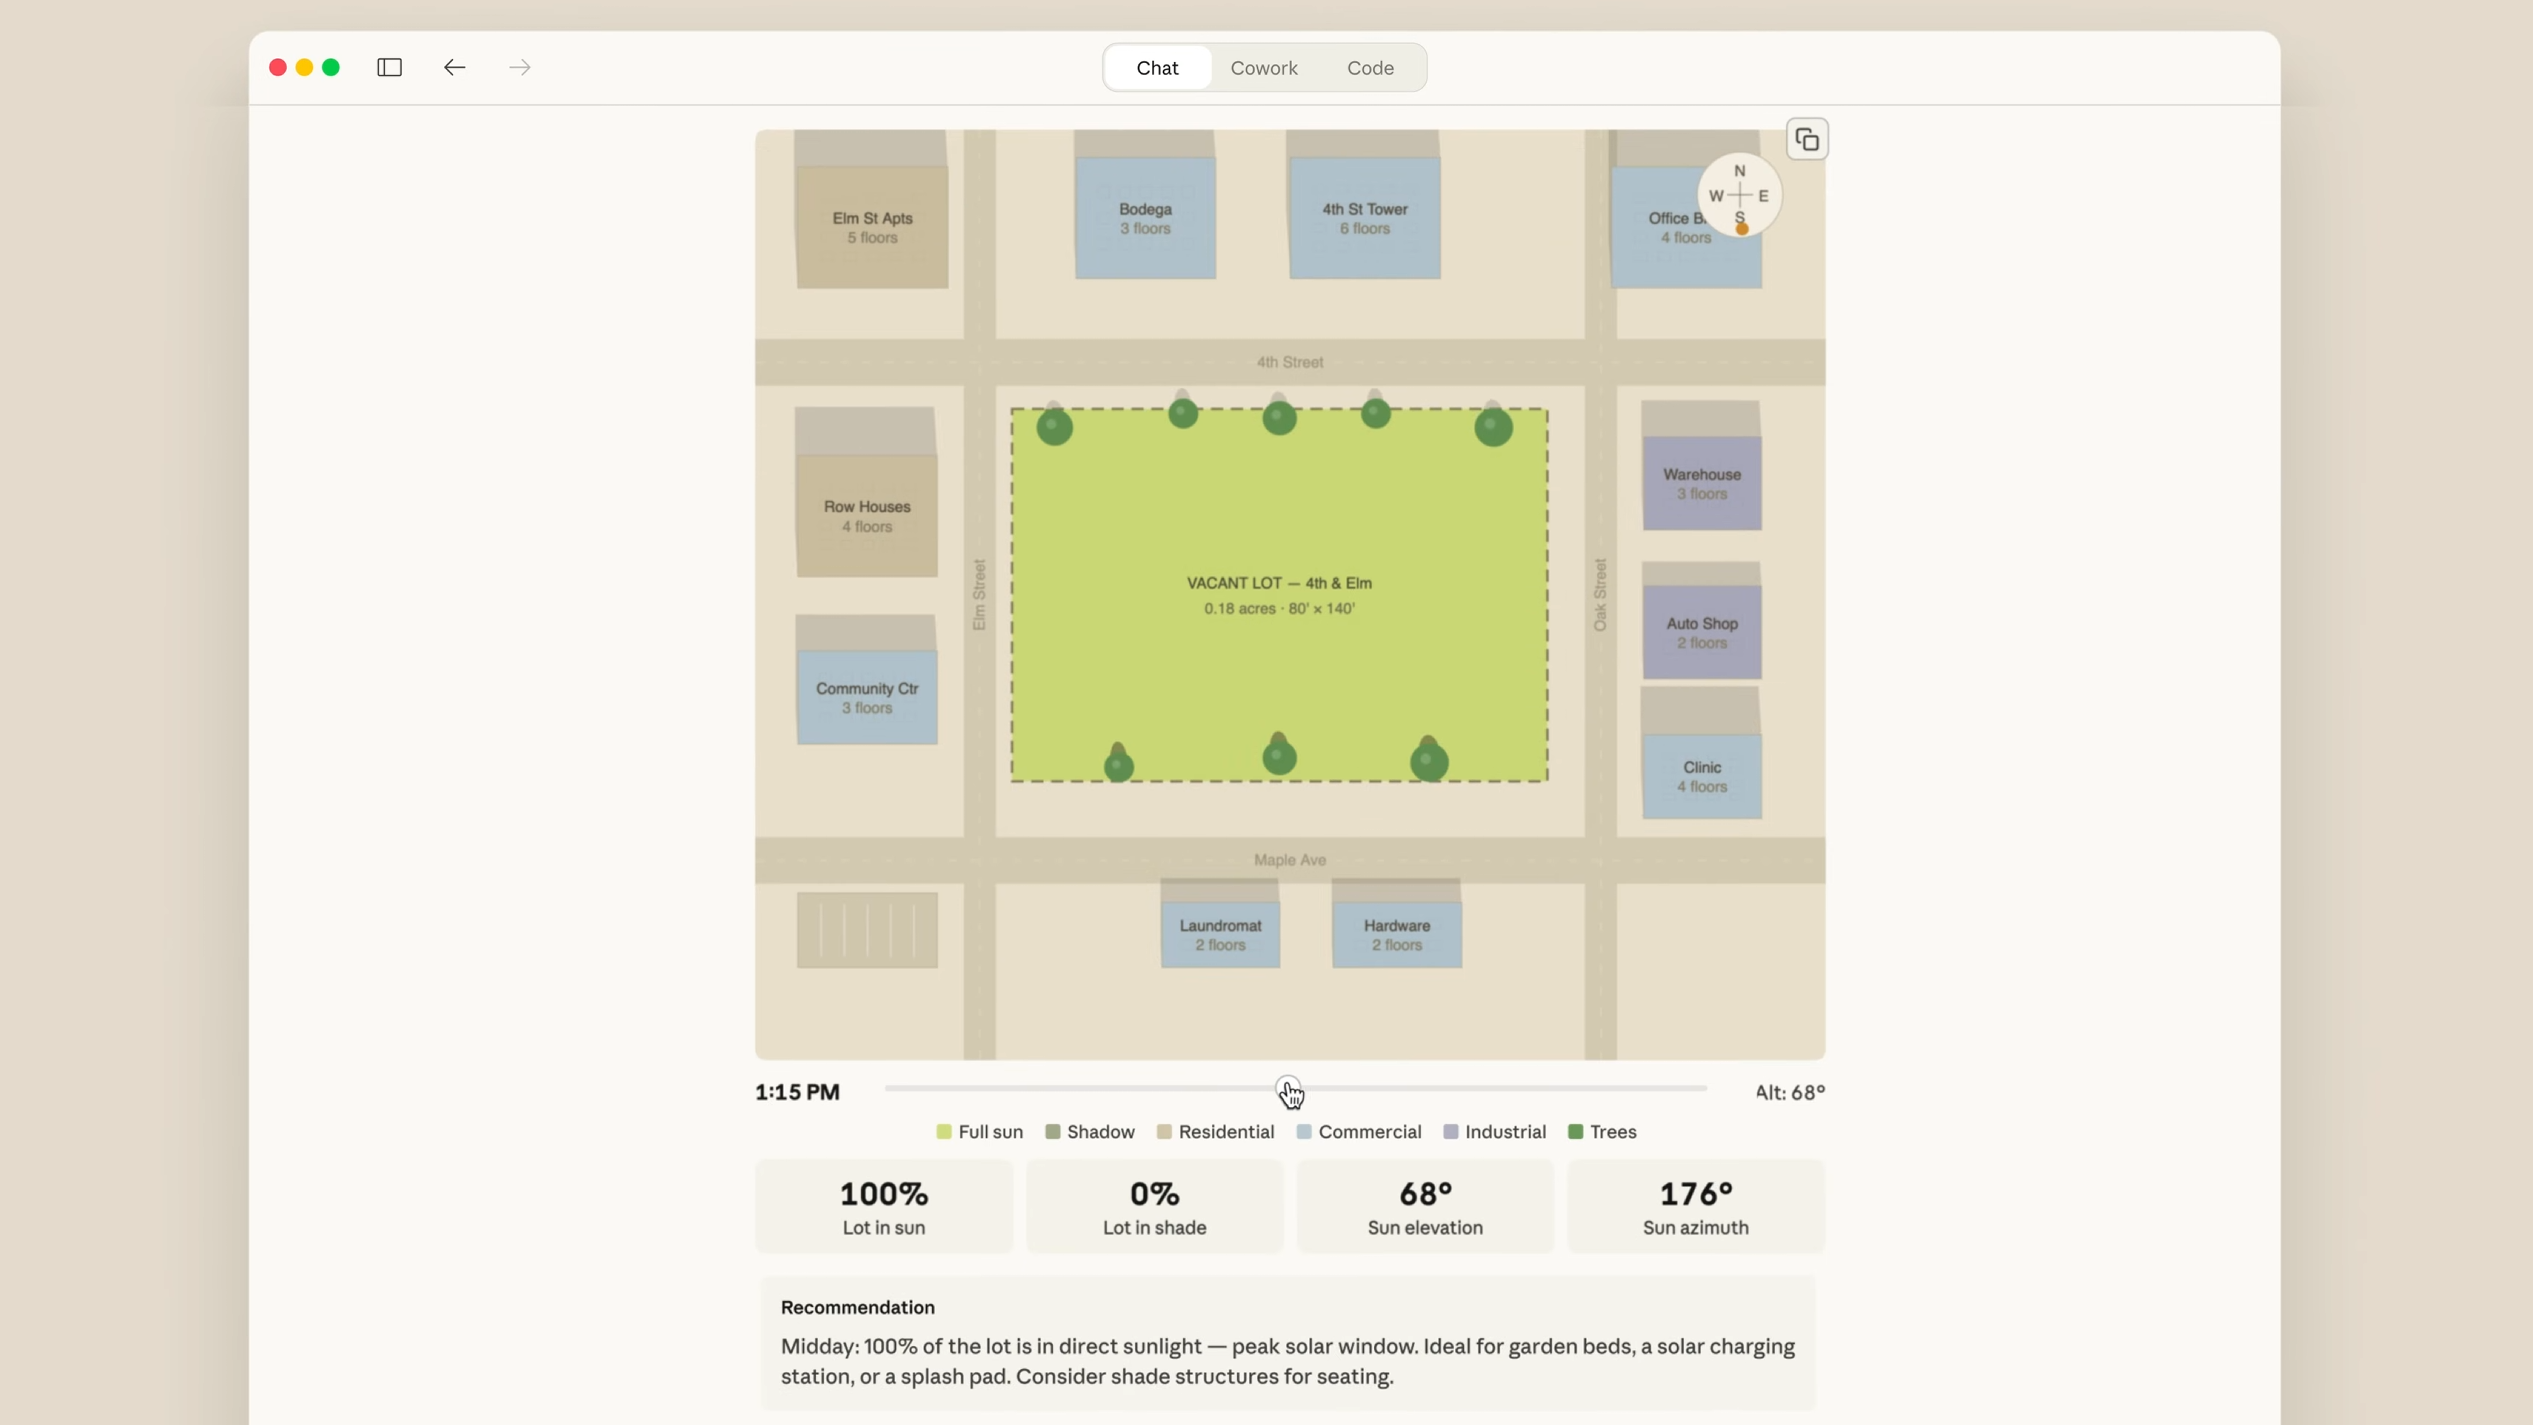
Anthropicは、AIチャットボットClaude向けに新たなベータ機能を公開しました。会話内で直接、インタラクティブなダイアグラム、チャート、視覚化を生成できる機能です。
この記事「Claudeはチャット内で直接インタラクティブなチャートや視覚化を作成できるようになりました」は、The Decoderで最初に公開されました。
原文を表示
Anthropic has launched a new beta feature for its AI chatbot Claude: the ability to generate interactive diagrams, charts, and visualizations directly within the conversation. The feature builds on a preview called "Imagine with Claude" from last fall, combining it with the existing "Artifacts" functionality - but embedded right in the chat flow instead of in a side panel, and labeled as "temporary," according to Anthropic.
Claude decides on its own when a visualization would be helpful, though users can also request one directly. Examples include interactive compound interest curves, an interactive decision tree, and a clickable periodic table. The feature is available across all pricing tiers.
AI News Without the Hype – Curated by Humans
Subscribe to THE DECODER for ad-free reading, a weekly AI newsletter, our exclusive "AI Radar" frontier report six times a year, full archive access, and access to our comment section.
Subscribe now
同じ出来事を6媒体で確認
同じ出来事を扱う別媒体の記事です。見出しと公開時刻を比較できます。
関連記事
今日のまとめ
AIデイリーブリーフで今日の重要ニュースをまとめ読み