GitHub エージェント型ワークフローにおけるトークン効率の向上
本文の状態
日本語全文を表示中
詳細モードで約22分の本文を読めます。
GitHub は、リポジトリのクリーンアップを行うエージェント型ワークフローのコスト削減のため、トークン使用効率を改善する手法を発表した。自動実行される CI ジョブでのコスト蓄積を防ぐ狙いがある。
Continue in AI NEW LAB
このニュースを、実務の判断につなげる
AI NEW LABで、試したことや先に確認したい条件を共有できます。まずはログインなしで読めます。
AI NEW LABで論点を見るSource Article
元記事を日本語で読む
本文に関係しない購読案内、埋め込み通知、サイト内プロモーションは除いています。
GitHub Agentic Workflows は、リポジトリ内の小さな汚れを掃除するストリート清掃員のチームのようなものです。これらのチームはリポジトリの衛生状態と品質を大幅に改善しますが、すべてのエージェント型作業と同様に、コストは開発者にとって日益高まる懸念事項となっています。また、エージェント型ワークフローなどの CI ジョブは自動的にスケジュールされトリガーされるため、コストが見えないまま蓄積していく可能性があります。
幸いにも、対話型のデスクトップセッションと同じように自動化をより効率的にするのは比較的容易です。開発者セッション中に行われる作業は予測が難しい場合もありますが、エージェント型ワークフローの作業は YAML で完全に指定されており、実行するたびに繰り返されます。
私たちが自身の GitHub リポジトリで GitHub Agentic Workflows を維持・利用しているため、ユーザーと同じくらいトークン効率性を懸念しています。そのため、2026 年 4 月より、毎日依存している多くのワークフローのトークン使用量を体系的に最適化し始めました。本記事では、私たちが計測した内容、適用した最適化手法、および予備的な結果について説明します。
トークン使用量のログ記録
メンテナンスと CI のために、私たちはリポジトリ内で数百ものエージェント型ワークフローを利用しています。すべてのワークフローは、実際の API レート制限に対して GitHub Actions として実行されます。私たちは飛行しながら機体を構築し、その過程でジェット燃料を消費しているようなものです。
トークン消費を最適化するには、まずトークンがどのように消費されているかを把握する必要があります。私たちが直面した最初の課題は、各エージェントフレームワーク(Claude CLI、Copilot CLI、Codex CLI)が異なる形式でログを出力し、過去のランニングにおける使用データが不完全である可能性がある点でした。幸いにも、アジェンティック・ワークフローのセキュリティアーキテクチャでは、API プロキシを使用してエージェントが認証資格情報に直接アクセスできないようにしています。このプロキシにより、どのエージェントフレームワークを使用しているかに関わらず、すべてのランニングでトークン使用量を単一の正規化形式でキャプチャーする方法が得られました。
現在、すべてのワークフローは、各 API 呼び出しごとに 1 つのレコードを含む token-usage.jsonl アーティファクトを出力します。このレコードには、入力トークン、出力トークン、キャッシュ読み取りトークン、キャッシュ書き込みトークン、モデル名、プロバイダー、タイムスタンプが含まれています。このデータをワークフローの他のログと組み合わせることで、トークンが通常どのように使用されるかの履歴的視点を得られ、将来のランニングを最適化することが可能になりました。
ワークフローによるワークフローの最適化
トークンデータを手に入れたことで、2 つの毎日実行される最適化ワークフローを構築しました。
1 つ目は「Daily Token Usage Auditor(日次トークン使用量監査役)」です。これは最近のワークフローランニングからトークン使用アーティファクトを読み取り、ワークフローごとに消費量を集約し、構造化されたレポートを投稿します。その役割は、直近の使用量が大幅に増加したワークフローをフラグ付けし、最もコストのかかるワークフローを表面化し、異常なランニング(例えば、通常 4 つの LLM ターンで完了するワークフローが 18 ターンかかってしまう場合など)に注意を払うことです。
Auditor がワークフローにフラグを立てた場合、Daily Token Optimizer はワークフローのソースコードと直近のログを確認し、具体的な非効率性を記述して特定の最適化案を提案する GitHub イシューを作成します。この Optimizer により、私たちが普段見逃していたであろう多くの非効率性が発見されています。
もちろん、Auditor と Optimizer もそれ自体がアジェンティック・ワークフローであり、そのトークン使用量も日々のレポートに反映され、小さな好循環を形成しています。
未使用の MCP ツールの排除
初期の Auditor および Optimizer の結果に基づくと、最も一般的な非効率性は、未登録の MCP ツール(Model Context Protocol)の登録です。
LLM API はステートレスであるため、エージェントランタイムでは通常、各リクエストに MCP ツールの関数名と JSON スキーマを含めます。実務的には、これはツールの完全セットがすべての呼び出しのコンテキストの一部となることを意味します。40 個のツールを持つ GitHub MCP サーバーの場合、1 トークンあたりスキーマが 10〜15 KB 追加されることになります。もしエージェントが実際に使用するツールが 2 つだけなら、残りの 38 個はすべてのリクエストに付随する純粋なオーバーヘッドとなります。
ワークフロー作成者は、抵抗の少ない道として最初からフルセットのツールセットから始め、エージェント自身が必要なツールを判断します。しかし時間が経つと、ほとんどのワークフローが狭く安定したツールのセットに依存するようになります。Optimizer は、実際のツール呼び出しに対してツールマニフェストを照合することでこのパターンを特定し、設定から未使用のツールを削除することを推奨します。
スモークテストワークフローにおいて、MCP 設定から未使用のツールを削除したところ、1 回あたりのコンテキストサイズが 8–12 KB 削減され、動作に変化なく数千人分のトークンを節約できました。
GitHub MCP から GitHub CLI への置き換え
未使用の MCP ツールの削除は比較的簡単な改善策です。より大きな構造的な機会として、プルリクエストの差分、ファイル内容、レビューコメントの取得といったデータ取得オペレーションにおける GitHub MCP の呼び出しを、GitHub CLI の呼び出しに置き換えることが挙げられます。
この変更は、未使用ツールのオーバーヘッドを削減しただけではありません。MCP ツール呼び出しは、データ取得に加えて推論ステップとなるからです。エージェントはツールを呼び出すかを決定し、引数を形成し、その出力をコンテキストの一部として受け取る必要があります。これは、ツール使用 JSON スキーマ、引数ブロック、レスポンスにトークンを消費する完全な往復 LLM API 呼び出しです。一方、「gh pr diff」を呼び出すことは、LLM の関与なく GitHub の REST API に対する決定論的な HTTP リクエストとなります。
この移行には 2 つの戦略を使用しました。
エージェント実行前のデータダウンロード。プルリクエストの差分や変更されたファイルリストなど、エージェントが常に必要とするデータについては、ワークフローにセットアップステップを追加し、エージェント起動前に gh コマンドを実行してその結果をワークスペースファイルに書き込みます。エージェントは MCP 呼び出しを行う代わりにこれらのファイルを読み取ります。これによりツール呼び出しのオーバーヘッドが排除され、エージェントは bash スクリプト処理における広範なトレーニングを活用してデータを効率的に処理できるようになります。
エージェント内 CLI プロキシ置換。エージェントが実行時に何を取得するかを決定するケースでは、事前ダウンロードは不可能です。そのような場合、認証トークンをエージェントに公開することなく、CLI トラフィックを GitHub の API サーバーへルーティングする軽量な透明性 HTTP プロキシを利用します。エージェントは gh pr view –json を実行し、ターミナルからユーザーが得るのと同じ構造化データを取得します。これにより、エージェントに対するゼロシークレットセキュリティ要件を損なうことなく、トークン使用量を削減できます。
これらの技術を組み合わせることで、GitHub データフェッチングの大部分を LLM の推論ループ外へ移動させることができます。
効率性の向上を測定するのは容易ではありません
ワークフローの最適化を開始すると、より微妙な問題に直面しました:変更が効率性を高めたのか、それとも単にワークフローが行う作業量(そしておそらく品質)を減らしたのかを、どのように判断すればよいのでしょうか?
3 つの交絡要因があります。
すべてのトークンが等しく作られているわけではありません。Claude Haiku と Claude Sonnet で同じワークフローを実行すると、類似のトークン数になりますが、コストは大きく異なります。Haiku の 1 トークンあたりのコストは Sonnet の約 4 分の 1 です。そのため、モデルを切り替えるワークフローは生トークン数では変化していないように見えますが、実際には大幅なコスト削減を意味します。これを考慮するため、各トークンタイプにモデル乗数を適用する「有効トークン(Effective Tokens: ET)」指標を使用しています:
ET = m × (1.0 × I + 0.1 × C + 4.0 × O)
ここで、m はモデルコスト乗数(Haiku = 0.25 倍、Sonnet = 1.0 倍、Opus = 5.0 倍)、I は新たに処理された入力トークン、C はキャッシュ読み取りトークン、O は出力トークンを表します。出力トークンは、主要なプロバイダーすべてで最も高価なトークンタイプであるため、4 倍の重みを持ちます。一方、キャッシュ読み取りトークンは、新鮮な入力に比べてコストが数分の一で提供されるため、0.1 倍の重みしか持ちません。この式は、モデルティア間での消費量を正規化するためのものであり、どのモデルを使用しているかに関わらず、ET(トークン効率)が 10% 低下すれば、実際のコストも 10% 削減されることを意味します。
このワークロードはライブのリポジトリです。現時点で、トークン使用量を最適化するために利用できるエージェントワークフローベンチマークは存在しないようです。ワークフローによるトークン使用量を検討し始めた際、ある実行では 5 行の修正を処理する一方で、次の実行では 200 行に及ぶプルリクエストを処理することがわかりました。最初のランでは当然ながら使用するトークンは少なくなりますが、これは効率の突然の変化によるものではなく、単なるワークロードの変動です。生のトークン数は、効率の変動とワークロードの違いを混同させる可能性があります。これを正規化するために、私たちはトークン数とともに LLM API 呼び出し回数も追跡しています。実行あたりの LLM ターン数が一定で、1 回の呼び出しあたりのトークン数が減少している場合は、それが真の効率向上を示します。両方が同時に減少する場合は、処理されている作業量が減っている可能性を示唆します。
品質は変化するのか?出力品質を理解することは最も難しい考慮事項です。より軽量なモデルが制約の多いワークフローを実行すると、出力品質が低下する可能性があります。私たちは、LLM 呼び出しあたりの出力トークン数、実行あたりのターン数、ツール呼び出し完了率といったプロセスレベルのシグナルを調べ、品質を近似しました。最適化された Smoke Copilot ワークフローでは、トークン消費量が減少したにもかかわらず、これら 3 つの指標は最適化期間を通じて安定していました。このワークフローは、最適化前後ともに、実行あたり約 5 回の LLM ターンで完了します。もちろん、これらはプロセスシグナルであり、結果シグナルではありません。根本的な「正解」が存在しないため、品質が向上したのか、劣化したのか、それとも安定していたのかを直接観察することはできません。正しい作業単位あたりのトークン数を測定するには、追加の計測機能と検討が必要です。
初期結果
auditor および optimizer を gh-aw および gh-aw-firewall リポジトリ内の dozen の本番ワークフローに展開した後、各最適化前後の実行におけるトークン使用量アーティファクトをダウンロードし、各実行に対して ET(効率係数)を計算しました。12 のワークフローのうち 9 つが optimizer 推奨の変更を受けました。結果は、最適化前および最適化後の両期間で少なくとも 8 回の実行があるワークフローのみを含めます。これらは以下の通りです:Auto-Triage Issues、Daily Compiler Quality、Community Attribution、Security Guard、Smoke Claude。
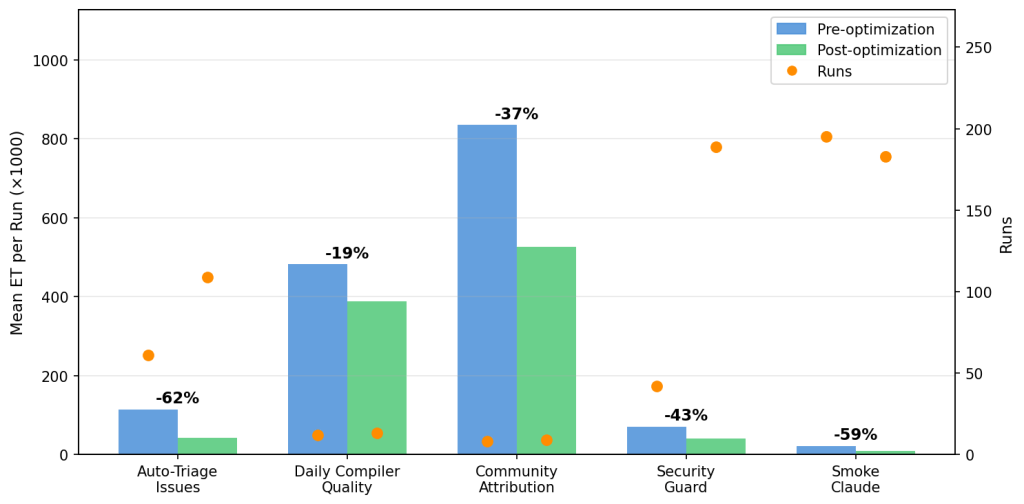
Auto-Triage Issues は、109 回の修正後実行にわたって明確かつ持続的な 62% の削減を示しています。Daily Compiler Quality は 12 回の修正後実行で 19% の改善を、Daily Community Attribution は 8 回の修正後実行で 37% の改善を示しました。gh-aw-firewall リポジトリでは、すべてのプルリクエストのセキュリティ上重要な変更を検証する Security Guard と、ファイアウォールの Claude CLI パスを検証する統合テストである Smoke Claude が最も多くの修正後実行数を示し、それぞれ 43% および 59% の改善を示しました。
実行頻度は、1 回あたりの節約額と同様に重要です。Auto-Triage Issues は新しい issue ごとにトリガーされ(1 日平均 6.8 回、最大 15 回)、Daily Compiler Quality は 1 日に最大 1 回しか実行されません。62% の節約と 1 日あたり 6.8 回の実行は急速に複合し、観測期間全体では、最適化前のレートに基づくと、Auto-Triage の最適化により合計で約 780 万 ET が節約されました。Security Guard と Smoke Claude はさらに頻繁に実行されます。どのワークフローを最適化する優先順位を決める際にも、1 回あたりの消費量と同様に実行頻度が重要です。
エージェントが推奨するすべての最適化が、特に日ごとの負荷変動があるライブリポジトリでの短期間の観測期間において、測定可能な ET の節約につながるわけではない点に注意することが重要です。例えば、Contribution Check ワークフローでは ET が 5% 増加しており、これについては後ほど詳しく議論します。
教訓
これらの結果に基づき、3 つのパターンを強調します。
多くのエージェントのターンは、決定論的なデータ収集です。Auto-Triage Issues は gh-aw において最も顕著な持続的改善を示しました(62 の修正後実行全体で -44%)。これは、構造的な非効率性を排除したためです。多くのエージェントのターンが、推論を必要としない読み取りに費やされていました。具体的には、イシューのメタデータを取得したりラベルをスキャンしたりする作業です。これらの読み取りを、エージェント開始前の事前エージェント CLI ステップへ移動させることで、LLM の推論ループから完全に除外されました。同じパターンが Security Guard にも適用され、gh-aw-firewall における -60% の削減を実現しました。これは、セキュリティに敏感なファイルに触れないプルリクエストに対して、関連性ゲートが LLM を完全にスキップするようになったためです。最もコストの低い LLM 呼び出しとは、行わない呼び出しのことです。
Contribution Check は、交絡因子を示しています。入力トークンの 82–83% がキャッシュ読み取り(データ収集)でしたが、平均 ET は 5% 増加しました。これは最適化の失敗によるものではなく、ワークロードの変化によるものです。最適化前の期間では、実行の 41% が小規模なプルリクエスト(ET < 100K)を処理し、39% が大規模なプルリクエスト(ET > 300K)を処理していました。一方、最適化後の期間は開発活動が急増した時期と重なり、ワークフローは小規模なプルリクエストを 9%、大規模なプルリクエストを 65% 処理しました。ET 計算式で 4 倍の重みを持つ出力トークンは、エージェントがより大きな差分レビューを行ったことで 14% 増加しました。最適化によってターンごとの効率は向上した可能性がありますが、より重いワークロードへのシフトにより、集計数値上ではその改善が隠れてしまっています。
使用されないツールは維持コストが高くなります。除外された gh-aw ワークフローの中で、Glossary Maintainer は示唆に富む事例です。単一のツール search_repositories が 1 回の実行で 342 回呼び出され、ローカルファイルの変更のみをスキャンするワークフローにとっては完全に不要であるにもかかわらず、すべてのツール呼び出しの 58% を占めていました。これをツールセットから削除することは、オプティマイザーからの推奨事項でした。gh-aw-firewall における Smoke Claude の -79% の削減は、積極的な MCP ツール(Model Context Protocol)の剪定と、モデルティアを Haiku に切り替えたことの一部によるものです。Daily Community Attribution ワークフローはこのアプローチの限界を示しています:このワークフローには 8 つの GitHub MCP ツールが設定されていましたが、1 回の実行全体でそれらのいずれにも呼び出しが行われませんでした。しかし、これらを削除しても ET(Estimated Time)は減少しませんでした。ツールマニフェストはこのワークフロー全体のコンテキストのごく一部に過ぎませんでした。
設定ミスをしたルール一つが、ループの暴走を引き起こす可能性があります。除外されたワークフローの中でも、「Daily Syntax Error Quality」は最適化以前にプロジェクト内で最もエントリポイント(ET)コストの高いワークフローでした。その根本原因は一行の設定ミスにありました:このワークフローはテストファイルを/tmp/へコピーした後、gh aw compile *を実行していましたが、サンドボックスの bash 許可リストでは相対パスのグローブパターンしか許可されていませんでした。すべてのコンパイル試行がブロックされました。必要なツールを使用できないエージェントは、64 ターンにわたるフォールバックループに陥り、手動でソースコードを読み込んでコンパイラーが伝えるはずだった情報を再構築しようとしていました。許可された bash パターンに対する一つの修正でこのループは解消されました。改善を正確に定量化するにはベースライン実行数が十分ではありませんでしたが、病理は明確であり、修正も明白でした。
次は何でしょうか?
ワークフローの最適化に使用するツール、つまり API レベルの観測機能、自動監査ワークフロー、MCP ツール剪断、CLI 置換などは、すべて現在 GitHub Agentic Workflows フレームワークで利用可能です。もう一つの今後の最適化は、より小さく安価なモデルを使用して、単一の巨大エージェントをサブエージェントからなるチームへとリファクタリングすることです。
次のステップは、ワークフローレベルの最適化からシステムレベルの最適化へと移行することです。1 つのワークフロー実行は、実際には単なるフラットな API コールの連続ではありません。それは、コンテキストの収集、アーティファクトの読み込み、失敗後の再試行、または最終回答の合成など、短い作業フェーズである「エピソード」の連鎖です。これらのエピソードを明確に把握できるようになれば、はるかに優れた質問が可能になります。「どのエピソードがコストのかかる実行を引き起こしたのか?」「どのエピソードが主に反復作業、ブロックされた作業、あるいは失敗した作業なのか?」「どのエピソードはもはやエージェント型ではなく、決定論的な事前ステップとして廃止すべきか?」
同じ論理はポートフォリオレベルにも適用されます。リポジトリは孤立して 1 つのワークフローを実行するわけではありません。多くの場合、同じイベントでトリガーされ、同じ差分やログを検査し、隣接する判断を下す一連のエージェント型自動化を並行して実行しています。つまり、コストは単一のワークフローの属性だけでなく、ポートフォリオ全体にわたる重複にも依存します。次に分析すべきはポートフォリオレベルでの課題です:どのワークフローで読み込みが重複しているのか、複数のワークフローを統合すべき箇所はどこか、そして各実行で再発見するのではなく共有中間アーティファクトをキャッシュすべき箇所はどこか。
これらの未解決の質問は本当に難しいものです。アジェンティック CI ワークフローにおいてスケーラブルな成果物インストゥルメンテーションはまだ存在しないため、グッドプット(goodput)を測定するには依然として課題があり、エピソードおよびポートフォリオ効率を理解するためには、現在の多くのシステムが収集しているよりも豊富な系譜データが必要です。しかし、それが重要となる方向性です。プロキシレベルの観測性とオプティマイザーワークフローは、すでに新しいアジェンティック自動化の開発とデプロイの方法を変えています。私たちは今や、後から取り付けるのではなく、最初の日からトークンの監視を追加しており、単独で高価な実行だけでなく、自動化フリート全体における回避可能な作業という視点で考えることが増えています。
CI でアジェンティックワークフローを実行していて、必要以上にコストをかけていないか疑問に思っている場合、最初のステップは私たちと同じです:API プロキシを追加し、ログを有効にして、データがどこを見るべきかを教えてくれるようにすることです。
ここで言及されたワークフローを追加したい場合は、gh-aw CLI を使用してリポジトリに直接配置するだけです:
gh extensions install github/gh-aw
gh aw add githubnext/agentic-ops/copilot-token-audit githubnext/agentic-ops/copilot-token-optimizer
既存の CI と並行して実行すれば、利用状況に関する即座の可視性が得られ、時間とともにワークフローを継続的に最適化できるようになります。
他の人々がこの問題にどのように取り組んでいるかをお聞きしたいです。コミュニティディスカッションでのご意見や、GitHub Next Discord の #agentic-workflows チャンネルへの参加をお待ちしています。
GitHub Agentic Workflows リポジトリを探索する >
The post Improving token efficiency in GitHub Agentic Workflows appeared first on The GitHub Blog.
GitHub エージェント型ワークフローにおけるトークン効率の向上に関する記事は、The GitHub Blog で最初に公開されました。
原文を表示
GitHub Agentic Workflows is like a team of street sweepers that clean up little messes in your repo. These teams significantly improve repo hygiene and quality, but as with all agentic work, cost is a growing concern for developers. And because CI jobs like agentic workflows are automatically scheduled and triggered, costs can accumulate out of view.
Thankfully, making automations more efficient is easier than doing the same for interactive desktop sessions. Work done during a developer session can be hard to predict, but agentic workflows’ work is fully specified in YAML and repeats every execution.
Because we maintain and use GitHub Agentic Workflows in our own GitHub repositories, we worry about token efficiency as much as our users. That is why in April 2026, we began to systematically optimize the token usage of many of the workflows that we rely on every day. This post describes what we instrumented, the optimizations we applied, and our preliminary results.
Logging token usage
We rely on hundreds of agentic workflows in our repos for maintenance and CI. All workflows run as GitHub Actions against real API rate limits. We are building the plane as we fly it and burning jet fuel as we go.
Before we could optimize our token consumption, we needed to know how tokens were consumed. The first challenge we faced was that each agent framework (Claude CLI, Copilot CLI, Codex CLI) emitted logs in a different format, and usage data could be incomplete for historical runs. Thankfully, the agentic-workflows security architecture uses an API proxy to prevent agents from directly accessing authentication credentials. This proxy gave us a way to capture token usage across all runs in a single normalized format, regardless of agent framework.
Every workflow now outputs a token-usage.jsonl artifact with one record per API call that contains input tokens, output tokens, cache-read tokens, cache-write tokens, model, provider, and timestamps. Combining this data with the rest of the workflow’s logs gave a historical view of how tokens were typically spent and allowed us to optimize for future runs.
Workflows optimizing workflows
With token data in hand, we built two daily optimization workflows.
A Daily Token Usage Auditor reads token usage artifacts from recent workflow runs, aggregates consumption by workflow, and posts a structured report. Its job is to flag any workflow that has significantly increased its recent usage, surface the most expensive workflows, and take note of anomalous runs (e.g., a workflow that normally completes in four LLM turns taking 18).
When an Auditor flags a workflow, a Daily Token Optimizer looks at the workflow’s source and recent logs to create a GitHub issue with describing concrete inefficiencies and proposing specific optimization. The Optimizer has found many inefficiencies that we would have otherwise missed.
Of course, the Auditor and Optimizer are agentic workflows themselves, and their token usage also appear in daily reports to create a small virtuous cycle.
Eliminating unused MCP tools
Based on our initial Auditor and Optimizer results, the most common inefficiency is unused MCP tool registrations.
Because LLM APIs are stateless, agent runtimes typically include the MCP tool function names and JSON schemas with each request. In practice, this means the full set of tools can become part of every call’s context. For a GitHub MCP server with 40 tools, this can add 10–15 KB of schema per turn. If the agent only uses two tools, the remaining 38 are pure overhead added to every request.
Workflow authors naturally start with a full tool-set since it is the path of least resistance, and the agent can figure out which tools it needs. But as time goes on, most workflows rely on a narrow, stable set of tools. The Optimizer identifies this pattern by cross-referencing tool manifests against actual tool calls and recommends pruning unused tools from the configuration.
In our smoke-test workflows, removing unused tools from the MCP configuration reduced per-call context size by 8–12 KB, saving several thousand tokens per run with no change in behavior.
Replacing GitHub MCP with GitHub CLI
Removing unused MCP tools is a relatively simple win. A larger structural opportunity was replacing GitHub MCP calls for data-fetching operations like retrieving pull request diffs, file contents, and review comments with calls to the GitHub CLI.
This change did more than reduce the overhead of unused tools because an MCP tool call is a reasoning step in addition to data retrieval. The agent must decide to call the tool, formulate its arguments, and receive its output as part of the context. That’s a full round-trip LLM API call, consuming tokens for the tool-use JSON schema, the argument block, and the response. Calling ‘gh pr diff’, by contrast, is a deterministic HTTP request to GitHub’s REST API with no LLM involvement.
We used two strategies for this migration:
Pre-agentic data downloads. For data that an agent will always need like a pull request diff or the list of changed files, we added setup steps in the workflow that run gh commands before the agent starts and writes the results to workspace files. The agent reads those files instead of making MCP calls. This eliminates tool-call overhead and allows the agent to take advantage of its extensive training in bash scripting to efficiently process the data.
In-agent CLI proxy substitution. Pre-downloading isn’t possible in cases where the agent determines what to fetch at runtime. In these cases we rely on a lightweight transparent HTTP proxy that routes CLI traffic to GitHub’s API servers without exposing an authentication token to the agent. The agent runs gh pr view –json and gets structured data back, just as a user would from a terminal. This reduces token usage without compromising our zero-secrets security requirement for the agent.
Together, these techniques move the majority of GitHub data-fetching out of the LLM reasoning loop.
Measuring efficiency gains is not easy
Once we began to optimize our workflows, we ran into a more nuanced problem: how do you know whether a change made things more efficient, or just made the workflow do less (and perhaps worse) work?
There are three confounding factors.
Not all tokens are created equal. Running the same workflow on Claude Haiku versus Claude Sonnet produces similar token counts but cost very differently. Haiku costs roughly 4× less per token than Sonnet, so a workflow that switches models appears unchanged in raw token count but represents a significant cost reduction. To account for this, we use an Effective Tokens (ET) metric that applies model multipliers to each token type:
ET = m × (1.0 × I + 0.1 × C + 4.0 × O)
where m is a model cost multiplier (Haiku = 0.25×, Sonnet = 1.0×, Opus = 5.0×), I is newly-processed input tokens, C is cache-read tokens, and O is output tokens. Output tokens carry 4× weight because they are the most expensive token type across all major providers. Cache-read tokens carry only 0.1× weight because they are served from cache at a fraction of the cost of fresh input. This formula normalizes consumption across model tiers so that a 10% ET reduction means a genuine 10% cost reduction regardless of which model is in use.
The workload is a live repository. As far as we know, there is no agentic-workflow benchmark that we can use to optimize our token usage. When we began looking at token usage by our workflows, we found that in one run a workflow would handle a five-line fix, and in the next run it would handle a 200-line pull request. The first run naturally uses fewer tokens, but the difference is not due to a sudden change in efficiency. Raw token counts can confuse workload variation with fluctuations in efficiency. We try to normalize this by tracking LLM API call counts alongside token counts; constant LLM turns-per-run and falling tokens-per-call indicate genuine efficiency improvement. Both falling together may indicate that less work is being done.
Does quality change? Understanding output quality is the hardest consideration. A lighter model running a more constrained workflow might produce lower-quality output. We looked at the process-level signals like output tokens per LLM call, turn counts per run, and tool-call completion rates to approximate quality. For our optimized Smoke Copilot workflow, all three remained stable across the optimization period even as token consumption fell. The workflow completes in roughly five LLM turns every run, before and after the optimizations. Of course, these are process signals, not outcome signals. We cannot directly observe whether the quality improved, degraded, or was stable, because there is no ground-truth “correctness.” Measuring tokens-per-unit-of-correct-work requires additional instrumentation and thought.
Initial results
After deploying the auditor and optimizer across a dozen production workflows in the gh-aw and gh-aw-firewall repos, we downloaded token-usage artifacts for runs before and after each was optimized and computed ET for each run. Nine of the 12 workflows received optimizer-recommended changes. We include results only for workflows with at least eight runs in both the pre- and post-optimization periods. These are: Auto-Triage Issues, Daily Compiler Quality, Community Attribution, Security Guard, and Smoke Claude.
Auto-Triage Issues shows a clear, sustained reduction of 62% across 109 post-fix runs. Daily Compiler Quality shows 19% improvement over 12 post-fix runs, and Daily Community Attribution shows 37% improvement over eight post-fix runs. In the gh-aw-firewall repo, Security Guard, which audits every pull request for security-sensitive changes, and Smoke Claude an integration test that exercises the firewall’s Claude CLI path, had the most post-fix runs and show improvements of 43% and 59%, respectively.
Run frequency matters as much as per-run savings. Auto-Triage Issues fires on every new issue (averaging 6.8 runs per day with a max of 15) while Daily Compiler Quality runs at most once per day. 62% savings and 6.8 runs/day compounds quickly: over the observation period, Auto-Triage’s optimization saved roughly 7.8 M ET in aggregate, assuming the pre-optimization rate. Security Guard and Smoke Claude run even more frequently. When prioritizing which workflows to optimize, run frequency is as important as per-run consumption.
It is important to note that not every optimization that the agent recommends translates into measurable ET savings, especially over short observation windows on a live repository where workload varies day to day. For example, the Contribution Check workflow experienced a 5% increase in ET, and we will discuss it in greater detail below.
Take aways
Based on these results, we highlight three patterns.
Many agent turns are deterministic data-gathering. Auto-Triage Issues shows the strongest sustained improvement in gh-aw (−44% across 62 post-fix runs) because the optimization eliminated structural inefficiency: many agent turns were spent on reads that required no inference, such as fetching issue metadata and scanning labels. Moving those reads into pre-agentic CLI steps before the agent starts removed them from the LLM reasoning loop entirely. The same pattern drove Security Guard’s −60% reduction in gh-aw-firewall: a relevance gate now skips the LLM entirely for pull requests that don’t touch security-sensitive files. The cheapest LLM call is the one you don’t make.
Contribution Check illustrates a confounding factor: 82–83% of input tokens were cache reads (data-gathering), but average ET increased 5%. This is due to a workload shift rather than optimization failure: in the pre-optimization period 41% of runs processed small pull requests (ET < 100K) and 39% processed large pull requests (ET > 300K). The post-optimization period coincided with a burst of development activity, and the workflow processed 9% small pull requests and 65% large pull requests. Output tokens, which carry a 4× weight in the ET formula, rose 14% as the agent reviewed bigger diffs. The optimization likely improved per-turn efficiency, but the shift toward heavier workloads masks that gain in the aggregate numbers.
Unused tools are expensive to carry. Among the excluded gh-aw workflows, the Glossary Maintainer is an instructive case. A single tool—search_repositories—was called 342 times in one run, accounting for 58% of all tool calls, despite being completely unnecessary for a workflow that only scans local file changes. Removing it from the toolset was the optimizer’s recommendation. In gh-aw-firewall, Smoke Claude’s −79% reduction was driven in part by aggressive MCP tool pruning combined with a model-tier switch to Haiku. The Daily Community Attribution workflow illustrates the limits of this approach: it was configured with eight GitHub MCP tools and made zero calls to any of them across an entire run, but removing them did not reduce ET. Tool manifests were a small fraction of this workflow’s overall context.
A single misconfigured rule can cause runaway loops. Also among the excluded workflows, Daily Syntax Error Quality was the highest-ET workflow in the project before optimization. The root cause was a one-line misconfiguration: the workflow copied test files to /tmp/ then called gh aw compile *, but the sandbox’s bash allowlist only permitted relative-path glob patterns. Every compile attempt was blocked. Unable to use the tool it needed, the agent fell into a 64-turn fallback loop in which it manually read source code to reconstruct what the compiler would have told it. One fix to the allowed bash patterns eliminated the loop. We did not have enough baseline runs to precisely quantify the improvement, but the pathology was clear and the fix was unambiguous.
What’s next?
The tools we use to optimize our workflows including API-level observability, automated auditing workflows, MCP tool pruning, and CLI substitution are all available today in the GitHub Agentic Workflows framework. Another upcoming optimization is refactoring monolithic agents into teams of subagents using smaller and cheaper models.
The next step is to move from workflow-level optimization to system-level optimization. A workflow run is not really one flat sequence of API calls. It is a chain of episodes: short phases of work like gathering context, reading artifacts, retrying after a failure, or synthesizing a final answer. Once you can see those episodes clearly, you can ask much better questions. Which episode actually caused a costly run? Which episodes are mostly repeated work, blocked work, or failed work? Which ones should stop being agentic entirely and become deterministic pre-steps?
That same logic applies at the portfolio level. Repositories do not run one workflow in isolation. They run a fleet of agentic automations that often trigger on the same events, inspect the same diffs and logs, and produce adjacent judgments. That means cost is not just a property of a single workflow, but also of overlap across the portfolio. The next analyses we want are portfolio-level ones: where workflows are duplicating reads, where several workflows should be consolidated, and where shared intermediate artifacts should be cached instead of rediscovered by each run.
Those open questions are genuinely hard. Measuring goodput still requires outcome instrumentation that does not yet exist at scale for agentic CI workflows, and understanding episode and portfolio efficiency requires richer lineage data than most systems collect today. But that is the direction that matters. The proxy-level observability and optimizer workflows have already changed how we develop and deploy new agentic automations. We add token monitoring from day one rather than retrofitting it later, and increasingly we think in terms of avoidable work across the whole automation fleet, not just expensive runs in isolation.
If you’re running agentic workflows in CI and wondering whether you’re spending more than you need to, the first step is the same as ours: add the API proxy, turn on logging, and let the data tell you where to look.
If you want to add the workflows mentioned here, you can simply drop them into your repo using the gh-aw CLI:
gh extensions install github/gh-aw
gh aw add githubnext/agentic-ops/copilot-token-audit githubnext/agentic-ops/copilot-token-optimizer
Running them alongside your existing CI will give you immediate visibility into usage and help continuously optimize your workflows over time.
We’d love to hear how others are approaching this problem. Share your thoughts in the community discussion or join the #agentic-workflows channel of the GitHub Next Discord.
Explore the GitHub Agentic Workflows repo >
The post Improving token efficiency in GitHub Agentic Workflows appeared first on The GitHub Blog.
同じ出来事を2媒体で確認
同じ出来事を扱う別媒体の記事です。見出しと公開時刻を比較できます。
関連記事
今日のまとめ
AIデイリーブリーフで今日の重要ニュースをまとめ読み