Cline、オープンウェイトエージェントの評価用セットを公開
本文の状態
日本語全文を表示中
詳細モードで約19分の本文を読めます。
同じ出来事の情報源
この情報源を基点に整理
Cline Blog
Cline はクローズドウェイトモデルの高コスト化と透明性の欠如に対し、オープンウェイトモデルへの移行を推進し、評価フレームワーク「Harbor」を用いた独自の実測データと分析手法を公開した。
AI深層分析を開く2026年8月19日 04:06
AI深層分析
キーポイント
クローズドウェイトモデルの限界とオープンウェイトの台頭
最新のクローズドウェイトモデルは高コストかつ価格透明性が低く、Cline の利用状況でも直近数ヶ月でオープンウェイトモデルの使用量が急増している。
独自評価による非効率性の発見
Cline が独自に実施した評価では、SOTA 評価スコアは得られたものの、リクエストのトークンサイズが効率的なハッチェスと比較して 20〜30% 重くなることが判明した。
評価フレームワーク「Harbor」の活用と公開
Cline は Terminal-Bench の作成者らが構築したエージェント評価フレームワーク「Harbor」を用いて並列評価を実行し、その結果と分析手法をオープンソース化した。
ヒルクライマーのためのチェックリスト提供
単なる自己賛美に終始しないよう、目的に応じた 5 つのヒューリスティック(「Hill Climber's Checklist」)と数千ドル分の評価スコア・トレースデータを公開した。
評価は多目的最適化問題である
コストと知能性、思考レベルとトークン効率など、競合する目標のバランスを取る必要がある。
重要な引用
closed-weight models are becoming a very expensive commodity
our requests ran 20–30% heavier than the publicly advertised averages of the most efficient harnesses
I have read dozens of eval blogs and learned that they are mostly about self-congratulation and benchmark-maxxing
When doing eval runs, you must think of them as multi-objective optimization problems in which you are balancing different, conflicting axes.
編集コメントを表示
編集コメント
本記事は、ベンチマークスコアという数値の背後にある実運用コスト(トークン消費量)に光を当てた貴重な分析である。評価フレームワークの公開と具体的なデータ提示により、開発者がモデル選定を行う際の客観的な根拠を提供している。
Source Article
元記事を日本語で読む
本文に関係しない購読案内、埋め込み通知、サイト内プロモーションは除いています。
序論
 imageFable や Gpt-5.6 Sol といった新モデルの登場により、重み(パラメータ)を非公開とするクローズド型モデルが極めて高価な商品になりつつあることが明確になってきました。その結果、私たちは最先端ラボに「何を使うべきか」「いくらで使えるのか」を一方的に決められる立場に置かれています。
 imagehttps://x.com/levelsio/status/2075530242186166519多くのコーディングエージェントのサブスクリプションプランでは価格設定が不透明であり、クレジット制限に含まれるトークンの価値も日によって変動します。AI 活用を最優先し、トークン数を最大化しようとする企業でさえ、選択肢は「オープンウェイトモデルに切り替える」か「効率のために独自の環境(ハネス)を構築する」かの二者択一になりつつあります。
Cline では最近、価格の安さと品質向上によりオープンウェイトモデルがクローズド型モデルと同等、あるいはそれ以上の性能を発揮しているという明確な理由から、同様のモデルの利用量が異常に増加していることに気づきました。
利用状況をランク付けした結果、現在 Cline で最も頻繁に使用されている 5 つのモデルはすべてオープンウェイトモデルであることが判明しました。
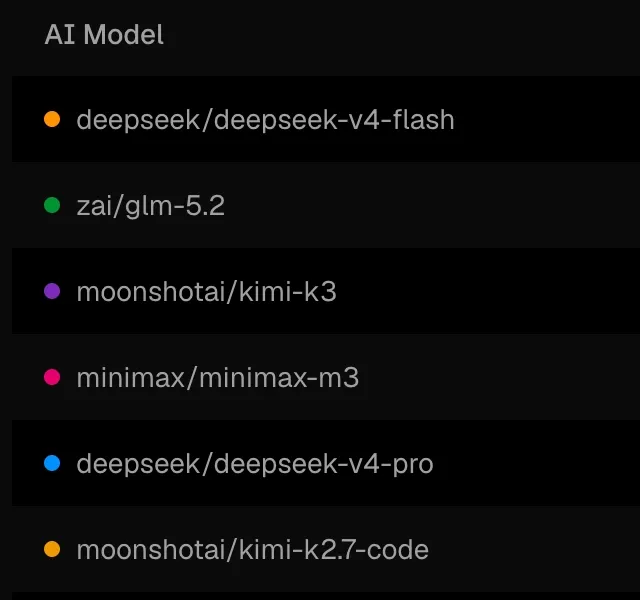 imageCline がオープンウェイトモデルでどのように動作するかを調査し始めました。多くの Cline ユーザーは、最新の最先端モデルに数十億トークンを消費する「SOTA トークン・マクサー」に慣れきっており、恵まれた環境にあります。しかし、私たちは今、オープンウェイトモデルでの実験をより多く行い、その扱い方や改善方法を学んでいます。
新しく開発した SDK により、Cline のリクエストにおける平均トークンサイズを計測できるようになりました。その結果は厳しいものでした。最も効率的なハッチェス(評価枠組み)が公表している平均値と比較して、私たちのリクエストは 20〜30% も重いことが判明したのです。確かに、Cline はほとんどのオープンウェイトモデルで SOTA の評価スコアを達成していますが、追加されるトークンコストを考慮すると、この結果は許容できるものではありません。
このブログの目的
私はこれまで数十本の評価(eval)関連のブログを読みましたが、それらはほとんどが自己賛美やベンチマークの数値最大化に終始しているように思えました。今回の記事はそれとは異なります。ここでは「ヒルクライマーのチェックリスト」を紹介し、5 つのヒューリスティック(経験則)と、それぞれの目標に応じたアプローチ方法について解説します。最後に、1,000 ドル分以上の評価スコアとトレースデータをお渡しします。これらのデータをダウンロードして探索すれば、エージェントに実行させてみることで、より微妙な発見や洞察を得ることができるでしょう。
評価の実行方法
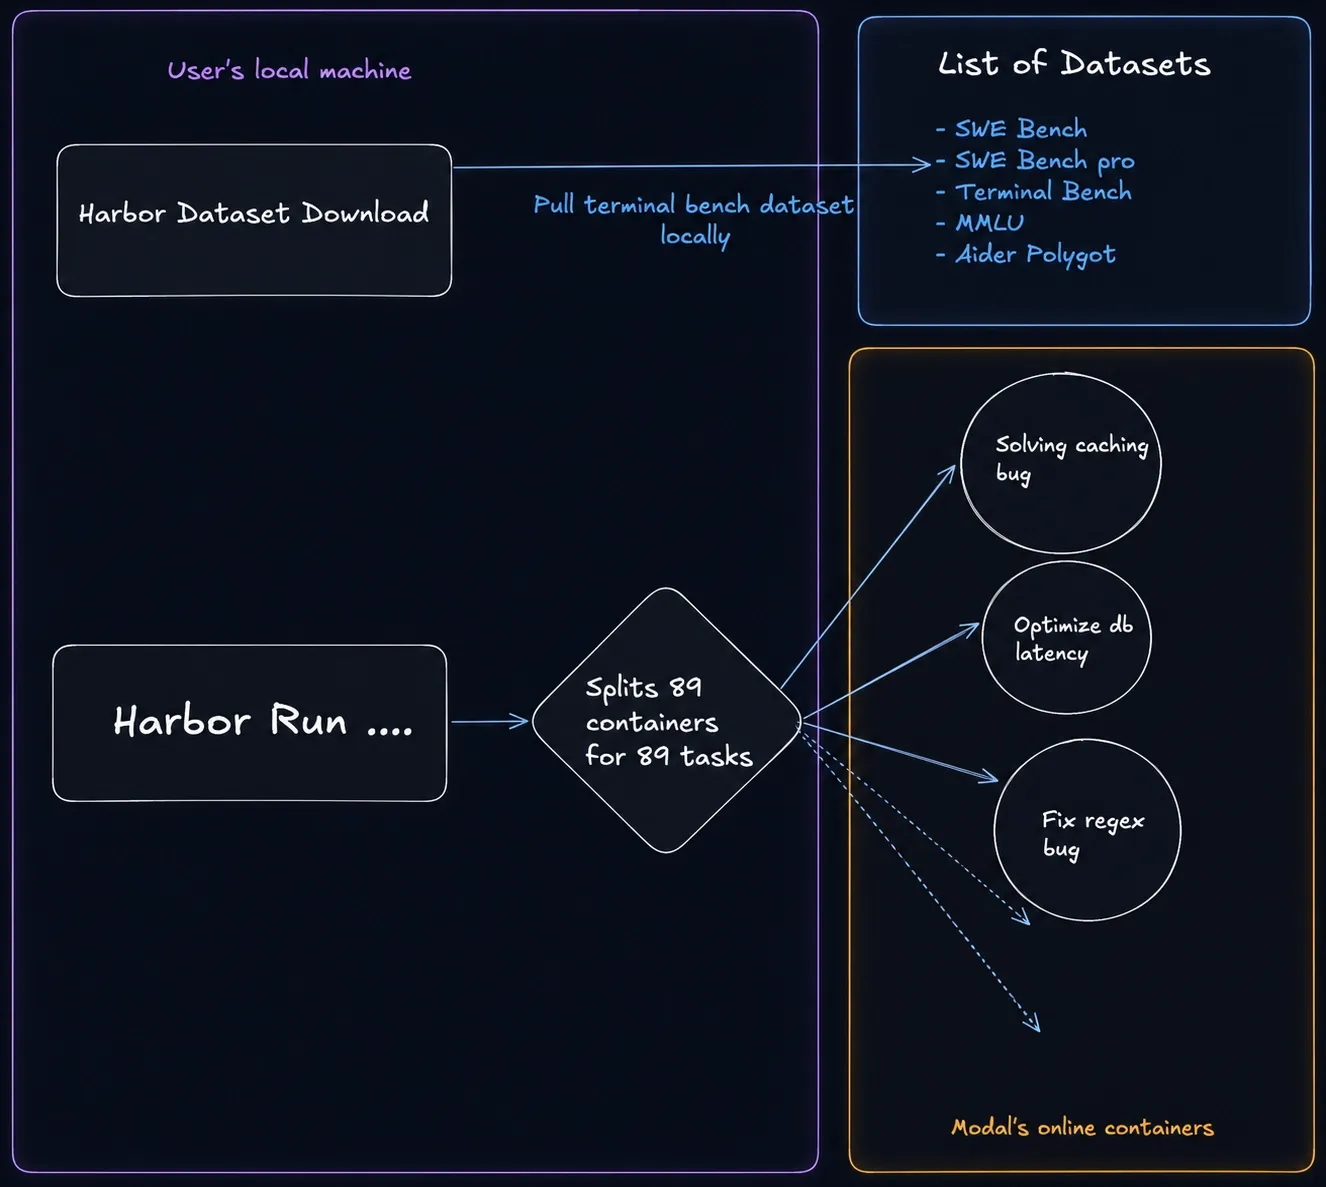
私たちは「Harbor」を利用しています。これは Terminal-Bench の作成者によって開発された、広く採用されているエージェント評価フレームワークです。サンドボックス管理、エージェントのループ処理、ロールアウト監視といった複雑な部分を抽象化し、評価をスムーズに実行できるように設計されています。
Harbor を使えば、Modal 上で Terminal Bench という 89 の問題からなるコーディングデータセットに対して、並列評価を大量に実行できます。これにより、さまざまなコーディングエージェントのハーンセス間で長期の評価ランを実行し、入力トークン数やキャッシュされたトークン数、出力トークン数、ネットコスト、使用されたツール呼び出し数などの集計指標を素早く把握することが可能になります。
 image評価で何を最適化すべきか?
評価ランを実行する際は、複数の競合する軸をどうバランスさせるかが問われる多目的最適化問題として捉える必要があります。重要なのは、どの目標にどれくらい重きを置くべきかを明確にすることです。
以下に、互いに矛盾しうる目標の具体例を示します。
コストと知能性
思考レベルとトークン効率
解決までの時間と評価スコア
トークン効率と評価スコア
これらはいずれも、対立する目標の両方を最適化したいケースですが、適切なバランスを選ぶ必要があります。例えば、Fable の最大モードを使えば Terminal Bench で 91% のスコアを達成できますが、そのコストは Kimi K3 と比べて約 10 倍になります。では、追加される 3% のスコアのために、ネット実行コストを 10 倍に支払う価値があるのでしょうか?
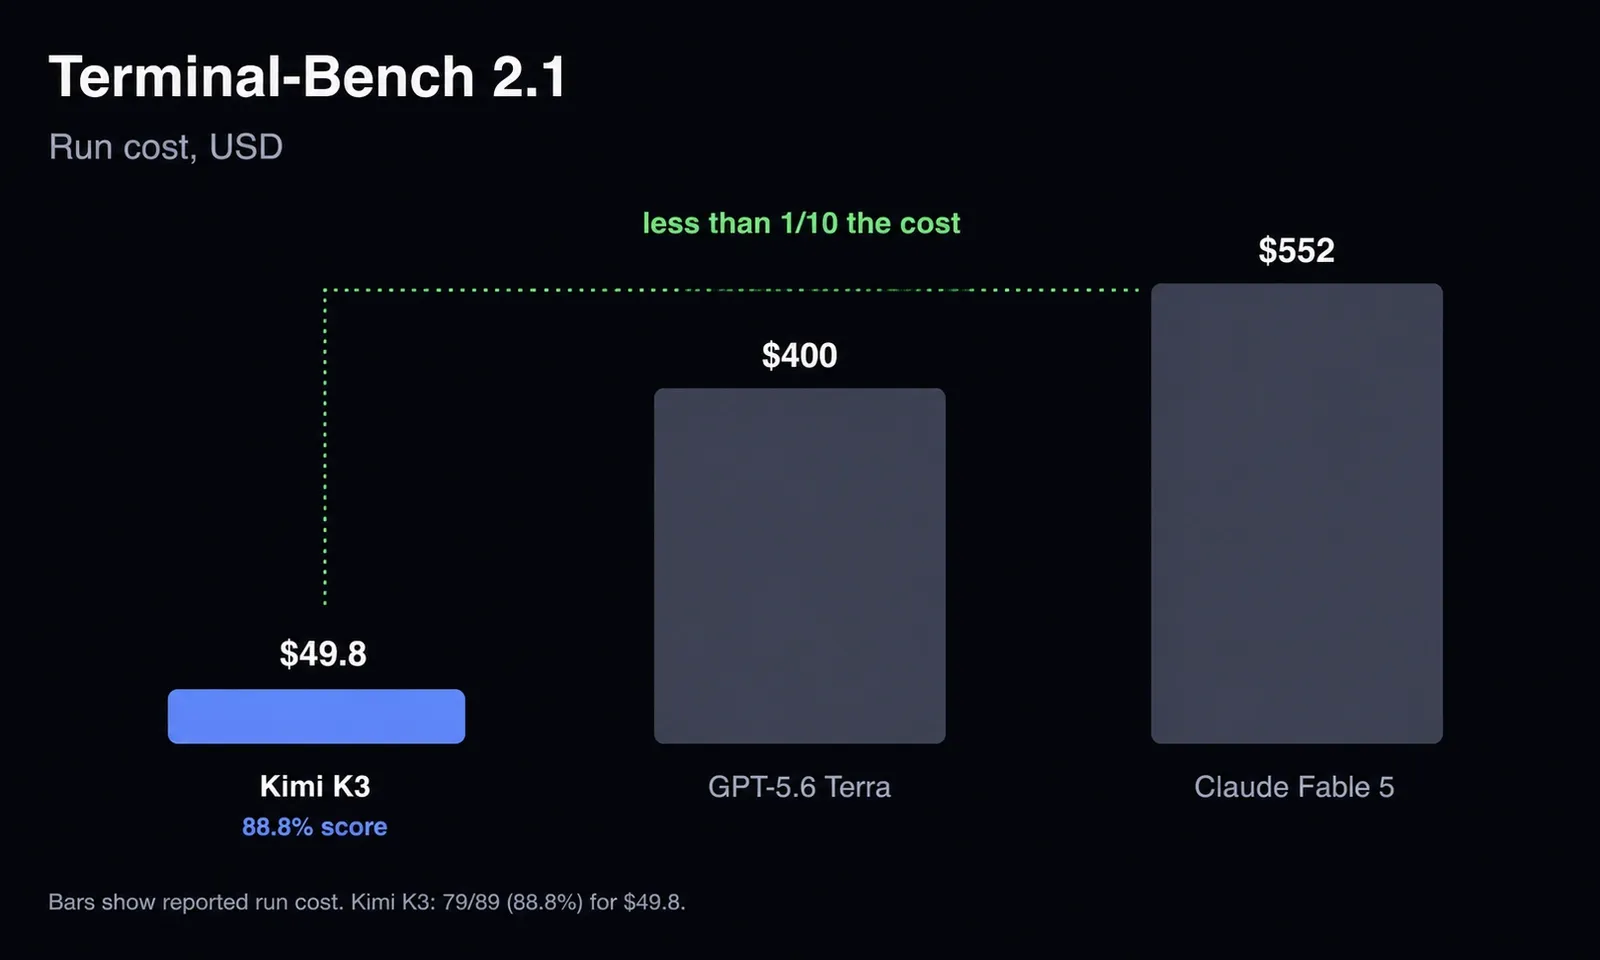 image評価の最適化には、この種のトレードオフが常に伴います。どこに戦力を集中させるかを選ぶ必要があるのです。
時には一つの要素を改善する代わりに別の要素が犠牲になることもあります。その場合、自らのユースケースにとって何が最も有効かを慎重に見極める必要があります。私たち Cline においては、最先端の性能(SOTA)は常に最優先事項ですが、それと同等に重要なのが「ユーザーにお金をかけずに最大の課題を解決してもらう」という価値提供です。
具体的には、キャッシュ機能やトークン管理の最適化、そして Cline Pass のようなまとめ買いプランなど、低コストで推論を提供するパッケージ型のサービスを通じて、その実現を図っています。
次に、ヒューリスティック(経験則)について説明します。これらは全部で 5 つあり、これらが「Hill Climber's Checklist」を構成しています。
北極星指標を設定する
北極星指標は、ヒルクライム法における二つの主要な失敗パターンからあなたを守ります。
- やりすぎ: モデルから引き出せる限界には限りがあります。その点を過ぎると、ただ同じことを繰り返すことになり、前進できなくなります。
- やりなさすぎ: ハーネス(評価環境)がモデルの能力を制限しているため、改善の余地を残したまま終わってしまうケースです。
北極星指標の目的は、この「ほどよい点」を見つけることです。つまり、過度な最適化に時間を費やすことなく、合理的に高いスコアを達成できる地点を見出すのです。
多くのモデルは、ツール呼び出しの利用や学習後の最適化を通じてモデルとハーネスが密接に結びついているため、独自の評価環境において最も高いパフォーマンスを発揮します。
Cline は誰もが使える共通の評価ハネスを構築しており、この記事を読んでいるあなたも、あらゆるモデルと連携するエージェントを開発中なのではないでしょうか。もし新しいモデルの評価スコアがシステムカードに記載された数値よりも著しく低い場合、私たちは最適化を行う必要があります。1〜3% のズレであれば、スコア向上のために追跡するのは通常価値がありません。しかし、SOTA(最良の成果)を大きく下回る場合は、即座に作業を開始すべき時です。一般的には、そのモデルに対して公開されている最も優れたハネスで得られるスコアに近づけることを目指します。
ノイズを定量化する
良い評価指標の一つは分散性です。意味のある課題において、同じモデル・ハネス・設定であっても、合格したテストの数には一定のばらつきが生じるはずです。難易度が高く、明確な定義を持つタスクでは、モデルが合格/不合格の境界線に置かれるため、同一条件での再実行でもスコアの広がりが現れます。この広がりが評価を区別可能にし、GRPO スタイルの強化学習に学習シグナルを与えるのです。ただし、まずそのばらつきが単なる不安定さ(フラッキネス)によるものではないことを排除する必要があります。そのため、私たちはしばしば評価を再実行し、結果の分布を報告しています。
Cline 側で観測された分散の具体例をいくつか挙げます。
- モデル:セットアップ / スコアのばらつき
- minimax-m3:同じビルド、5 回再実行 / 43.8% 〜 56.2%(±11 タスク);連続した 2 回の実行で 11 タスクが合格から不合格へ、18 タスクがその逆へ
- deepseek-v4-pro:同じビルド、2 回再実行 / 44.9% vs 53.9%(22 タスクが転換:一部は正解化、一部は不正解化)
- glm-5.1:同じビルド、3 回再実行 / 46.1% / 47.2% / 49.4%(タスクの 24% が転換)
- deepseek-v4-flash:同じビルド、3 回再実行 / 38.2% / 44.9% / 48.3%(±5 タスク、エラー数は 20/17/9 と減少)
- glm-5.2:同じビルド、多数の再実行 / 56.2% 〜 74.2%(約 16 タスクが転換)
評価結果のばらつきの原因を特定することが不可欠です。もし、ご自身のインフラに不安定な要素(フラッキネス)がある場合は、それを解決する必要があります。その原因は、パフォーマンスの低いプロバイダーを利用していることから、不安定な仮想マシン(VM)に至るまで様々です。評価実行におけるばらつきを可能な限り排除し、同一の設定値が確実に守られていることを確信できるよう、あらゆる手を打ってください。
失敗モードを分解する
総合的な評価スコアがおかしいと感じたら、問題の所在を見つけるためにデータを細かく切り分け、分析する必要があります。Terminal-Bench では 89 のタスクが含まれており、問題を特定の角度から分解することで、改善すべきポイントを絞り込むことがよくあります。
分解には優先順位をつけて以下の 3 つの方法があります:タスク別、モデル別、プロバイダー別です。
タスク別分析
失敗パターンを分解する最良の最初のステップは、タスクごとに分けることです。過去にトークン数の異常増加(トークン・ブロー)という問題がありましたが、その際、Cline が過剰なトークンを消費しているというグローバルな問題だと捉え、すべての場所でトークン使用量を修正しようとするのが第一反応でした。しかし後から振り返れば、それは誤った枠組みでした。
同じようなトークンの無駄遣いをしていないエージェントのトレースと比較したところ、その差はベンチマーク全体に均等に広がっているわけではありませんでした。特定の少数のタスクに限定されていたのです。ある実行では、89 のタスクのうち 15 のタスクだけで約 250K トークンが発生し、全体のトークン総数が 4.5 億であった場合でも、その 17% に当たるタスクから約 55% のトークンが生まれていました。
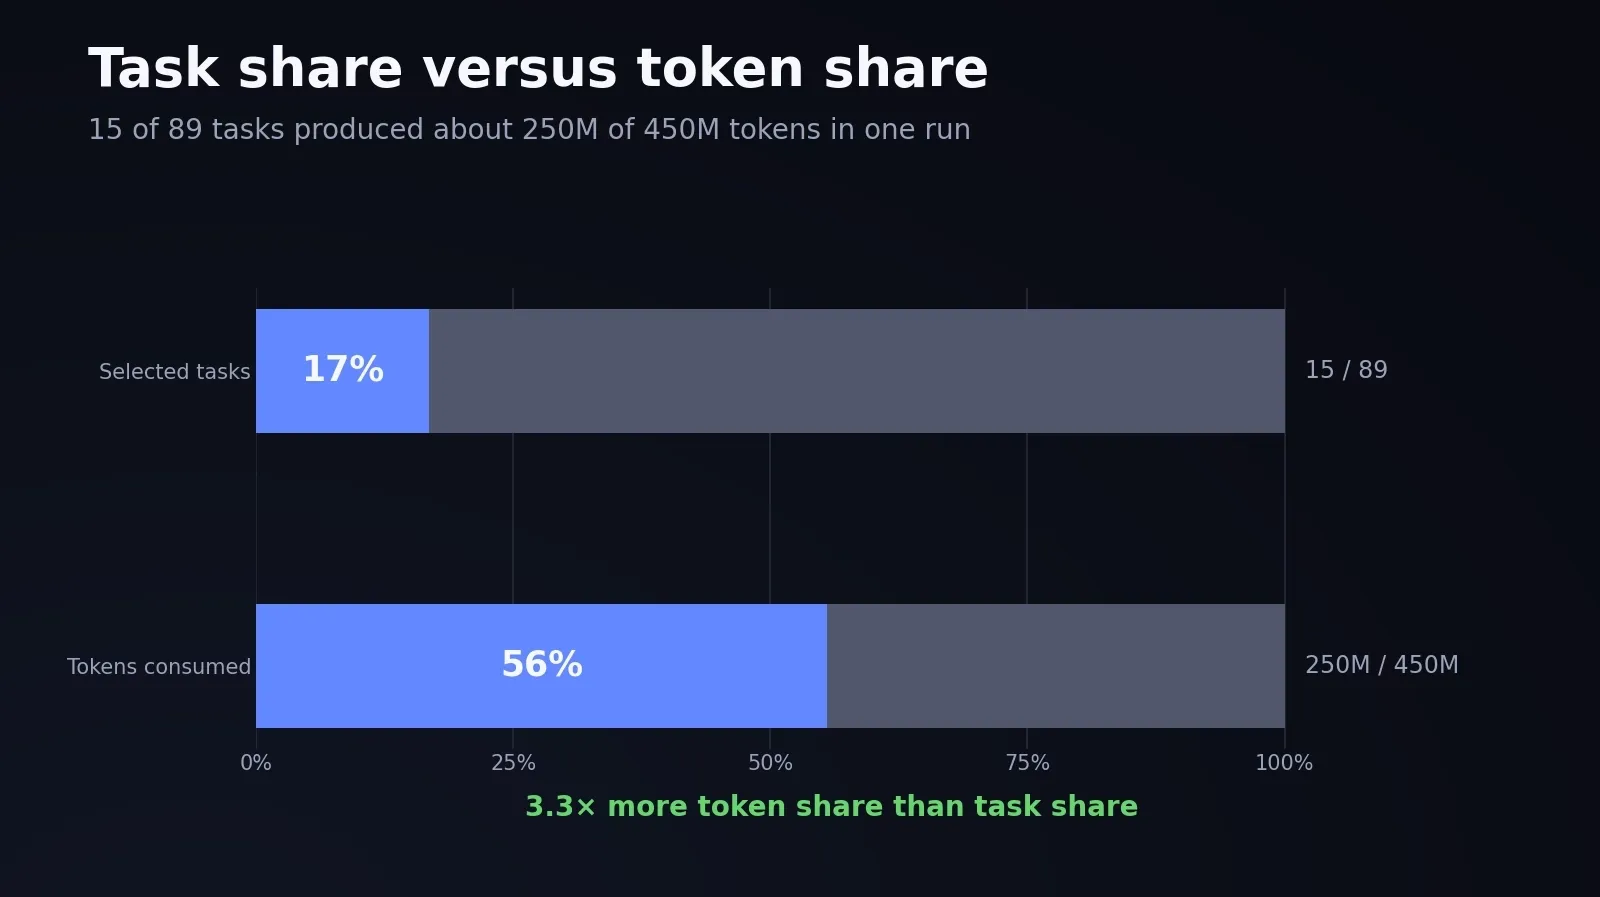
特定のタスク群だけ失敗する原因を特定するのは、往々にして難しいものです。トークンの出力を確認するだけでなく、その失敗パターンに焦点を当てて分析することも有効です。
手動で一つひとつチェックする代わりに、エージェントハレスに複数のサブエージェントを通じてトレースを追わせ、要約を取得させることができます。これなら、自分の目でトレースを精査するよりもはるかに効率的でしょう。
したがって、89 個の全タスクでトークンの肥大化(bloat)に対処しようと試みるのではなく、問題のあるタスクだけを抽出し、エージェントがどのように振る舞っていたかを精査します。そして修正を加えた後、すべてのタスクに対して最終的な健全性チェック(sanity check)を実施すればよいのです。
具体的な手順は以下の通りです。
- 問題のあるタスクを特定する。
- 選択したタスクに対してのみ改善を行い、再実行する。
- 改善が確認できたら、他のタスクを壊していないかを確認するために、全規模での再実行(sanity check)を行う。
モデルについて
共通のハレスを開発している場合、すべてのモデルごとに完全に異なるコードパスやシステムプロンプトフローを維持することは現実的ではありません。ハレスの大部分は共有されており、コンパクションロジック、ツール呼び出し、コンテキスト処理、コンピュータ操作、およびサブエージェントなどは、基本的に類似したロジックで動作します。
共通ハレスを採用する代償として、あるモデル向けの改善が他のモデルのパフォーマンスを低下させる可能性があります。
ミニマックスモデルにおけるトークン爆発を解消するために、ツールの肥大化(ツール・ブロー)を制限するトリックを試みた実験が典型的な例です。
Model
Before → with the fix → final stack
Direction
minimax-m2.7
32.6% → 41.6% → 46.1%
+13.5 points ▲
glm-5.1
48.3% → 52.8% → 57.3%
+9.0 points ▲
deepseek-v4-pro
47.2% → 47.2% → 42.7%
−4.5 points ▼
deepseek-v4-flash
48.3% → 43.8% → 41.6%
−6.7 points ▼
このトリック一つで、MiniMax M2.7 は 13.5 ポイント、GLM-5.1 は 9 ポイント向上しました。しかし一方で、DeepSeek Flash は 6.7 ポイント、DeepSeek Pro は 4.5 ポイント低下してしまいました。同じ変更が、モデルによって正反対の効果をもたらしたのです。
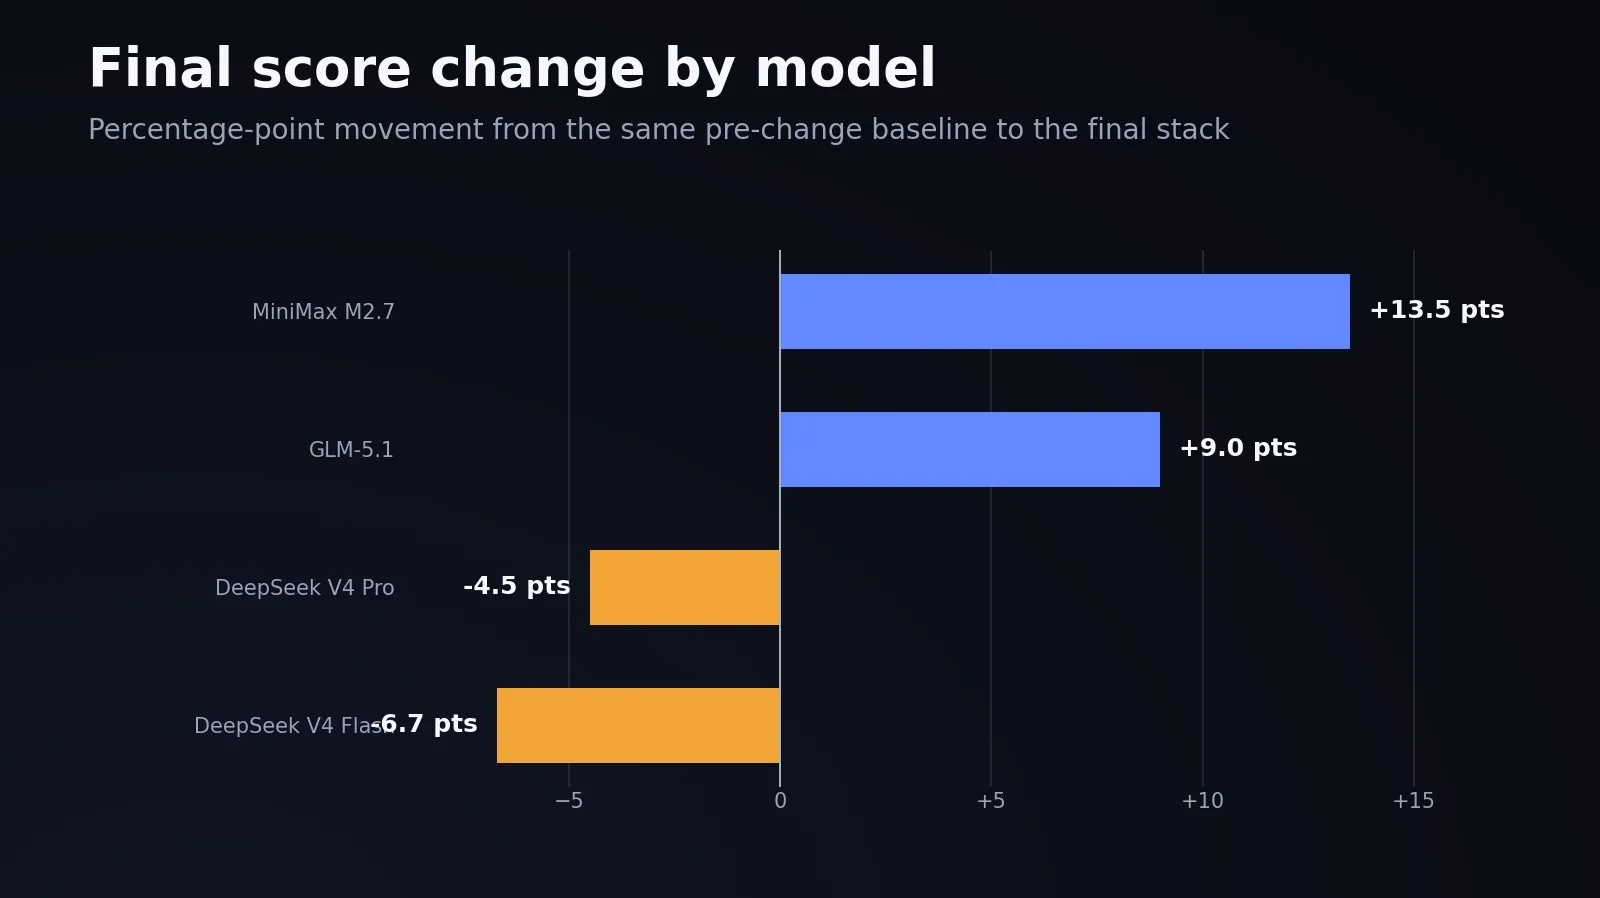 imageこのカット処理自体は単純でした。50K を超えるツール出力を、先頭と末尾を残して中間部分を削除し、8K に制限するものです。これは圧縮ではなく純粋な削除なので、削除された部分の要約は一切行われません。同じファイルを再読しても、トリミングされた状態がそのまま表示されるため、モデルは欠落した中間部分を復元することができません。それでも効果があったのは、エージェントがターンごとに履歴全体を再送信する仕組みだからです。巨大な観測結果が未来のすべてのリクエストで支払われることになるため、それを切り詰めることで会話の形状を整え、キャッシュの局所性を保ち、コストを削減できたのです。
特定のモデルに効果があるかどうかは、そのモデルが長いコンテキストをどのように処理するかによって異なります。GLM や MiniMax は、ノイズの多い長い出力の中間部分で混乱するため、中間部分を削除すると性能が向上し(それぞれ +13.5 ポイントと +9 ポイント)、DeepSeek のように長いツール出力の本文や末尾から推論を行うモデルでは、削除された中間部分がまだ保持されている状態だったため、それを復元する手段がないまま 6.7 ポイントと 4.5 ポイント低下しました。つまり、同じ調整項目がモデルによって正反対の効果をもたらすことがわかりました。
これを解決するには、2 つの選択肢があります。
A. ほとんどのモデルで汎用的に機能するように、変更を包括的に行うこと。
B. モデルごとに完全に異なるアルゴリズムの経路を使用すること。ただし、この方法には、モデルとメカニズムのマッピングを永続的に維持しなければならないという欠点があります。
私たちは多くの場合、B のアプローチを採用してきました。異なるモデルファミリーに対して最適な部分を最適化できるよう、モデルごとのプロンプトファミリを活用してきたのです。ただし、これは慎重な再設計の後に行われたことです。
あなたのケースでは、トレードオフの検討が必要です。どのモデルが改善し、どのモデルが悪化したのか。そして、実際に重視しているユースケースにおいて、その性能低下は許容範囲内でしょうか?普遍的に優れた評価枠組みなど存在しません。重要なのは、特定のモデル、プロバイダー、およびユースケースにとって何が最適かを見極めることです。それはあなた自身が探り出す必要があります。
プロバイダー
信じられないかもしれませんが、同じモデルでもプロバイダーによって実態は異なります。多くの最先端のオープンウェイトモデルは、CoreWeave、Baseten、Fireworks など複数のプロバイダーを通じて提供されています。人々はプロバイダー間の違いが単なる量子化(quantization)によるものだと考えがちですが、それは物語のごく一部に過ぎません。
異なるプロバイダーではキャッシュヒット率や量子化の精度、TTFT(Time To First Token)、レイテンシ、価格設定などが異なり、これらすべてが評価指標(eval metrics)に影響を与えます。新しいプロバイダーをトラフィックルーティング先に追加する際は、必ず他のプロバイダーと同等の評価スコアであることを確認します。良い評価スコアを持ちながらキャッシュヒット率が悪いという状況も起こり得ます。もし評価テストを行わなければ、何が問題なのかを知る術はありません。
同じビルドを 2 つのプロバイダーで実行した GLM-5.2 の具体的な事例をご紹介します。
CoreWeave(中程度の推論): 89 タスク中 66 成功、成功率 74.2%
OpenRouter 一般ルーティング(中程度の推論): 89 タスク中 55 成功、成功率 61.8%
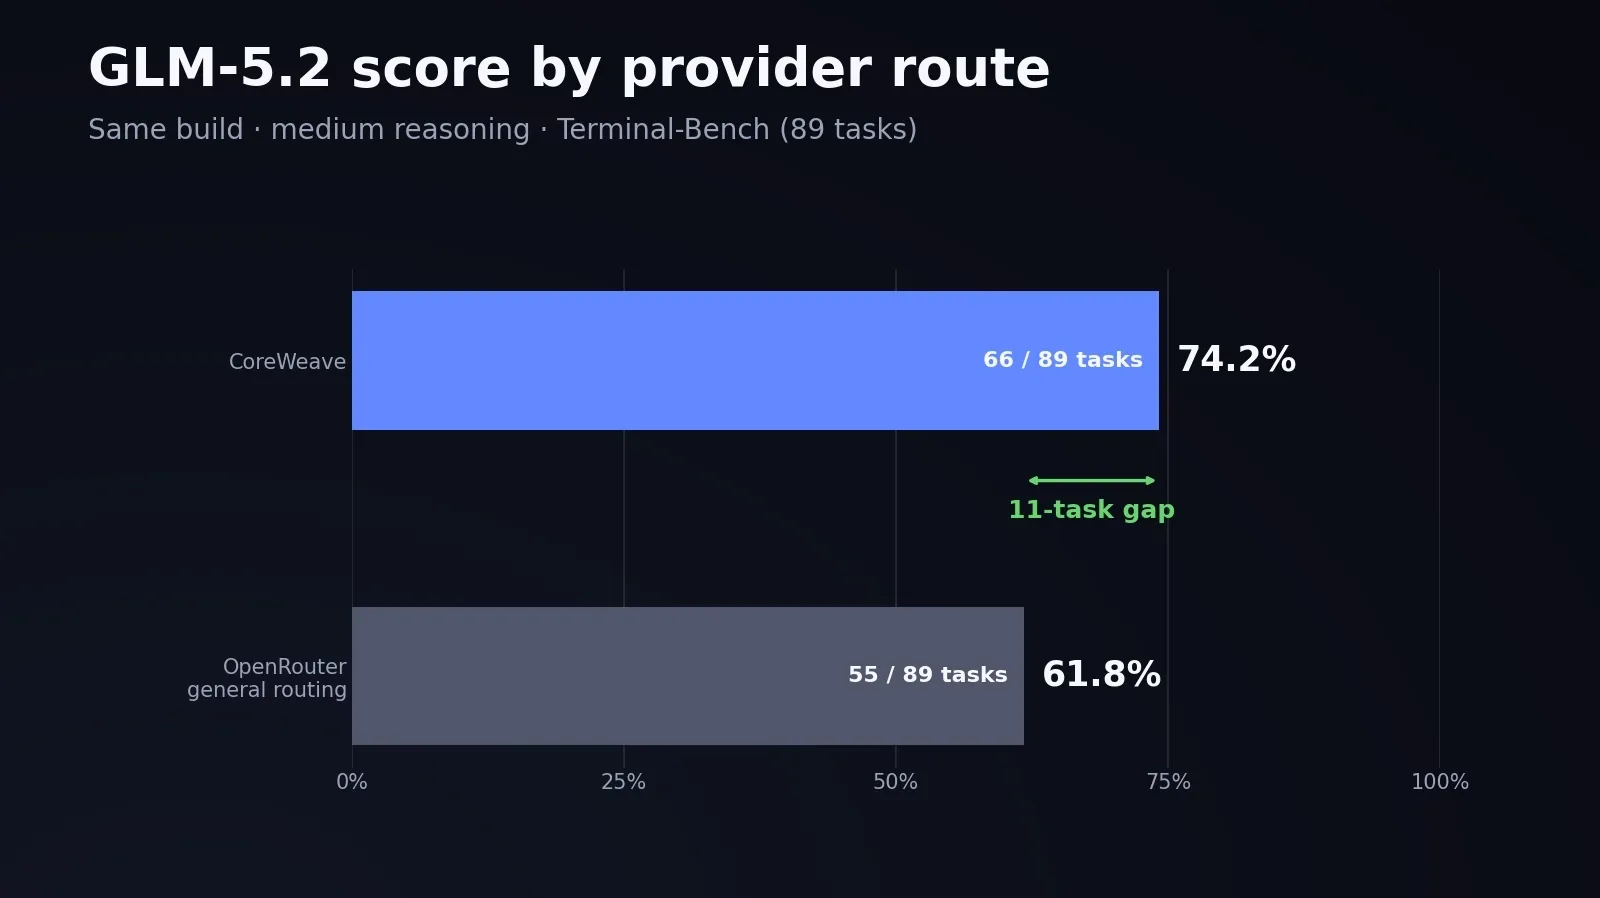 imageルーティングの違いだけで 11 タスク分の差が生じたため、各プロバイダーの経路を個別のエントリとして追跡するようになりました。また、プロバイダー間ではネットトークン数やキャッシュヒット率に最大で 2 倍の開きがあることも確認されており、同じ評価テストでもコストが$20 から$43 に跳ね上がるケースさえあります。
この話から得られる教訓は、異なるオープンウェイトプロバイダーを扱う際は注意が必要であり、トラフィックの切り替え前に必ず評価テストを行うべきだということです。
思考量を増やすことが自動的に性能向上につながるわけではない
思考において「多ければ多いほど良い」というのが一般的な通念ですが、必ずしもそうとは限りません。推論に投入するリソースは、知能を調整するための無料のノブではありません。コストがかかるだけでなく、場合によってはスコアを下げる要因にもなり得ます。
Opus 5 の FrontierCode の結果は、「思考量を増やせば結果が良くなる」という考えに対する典型的な反例です。
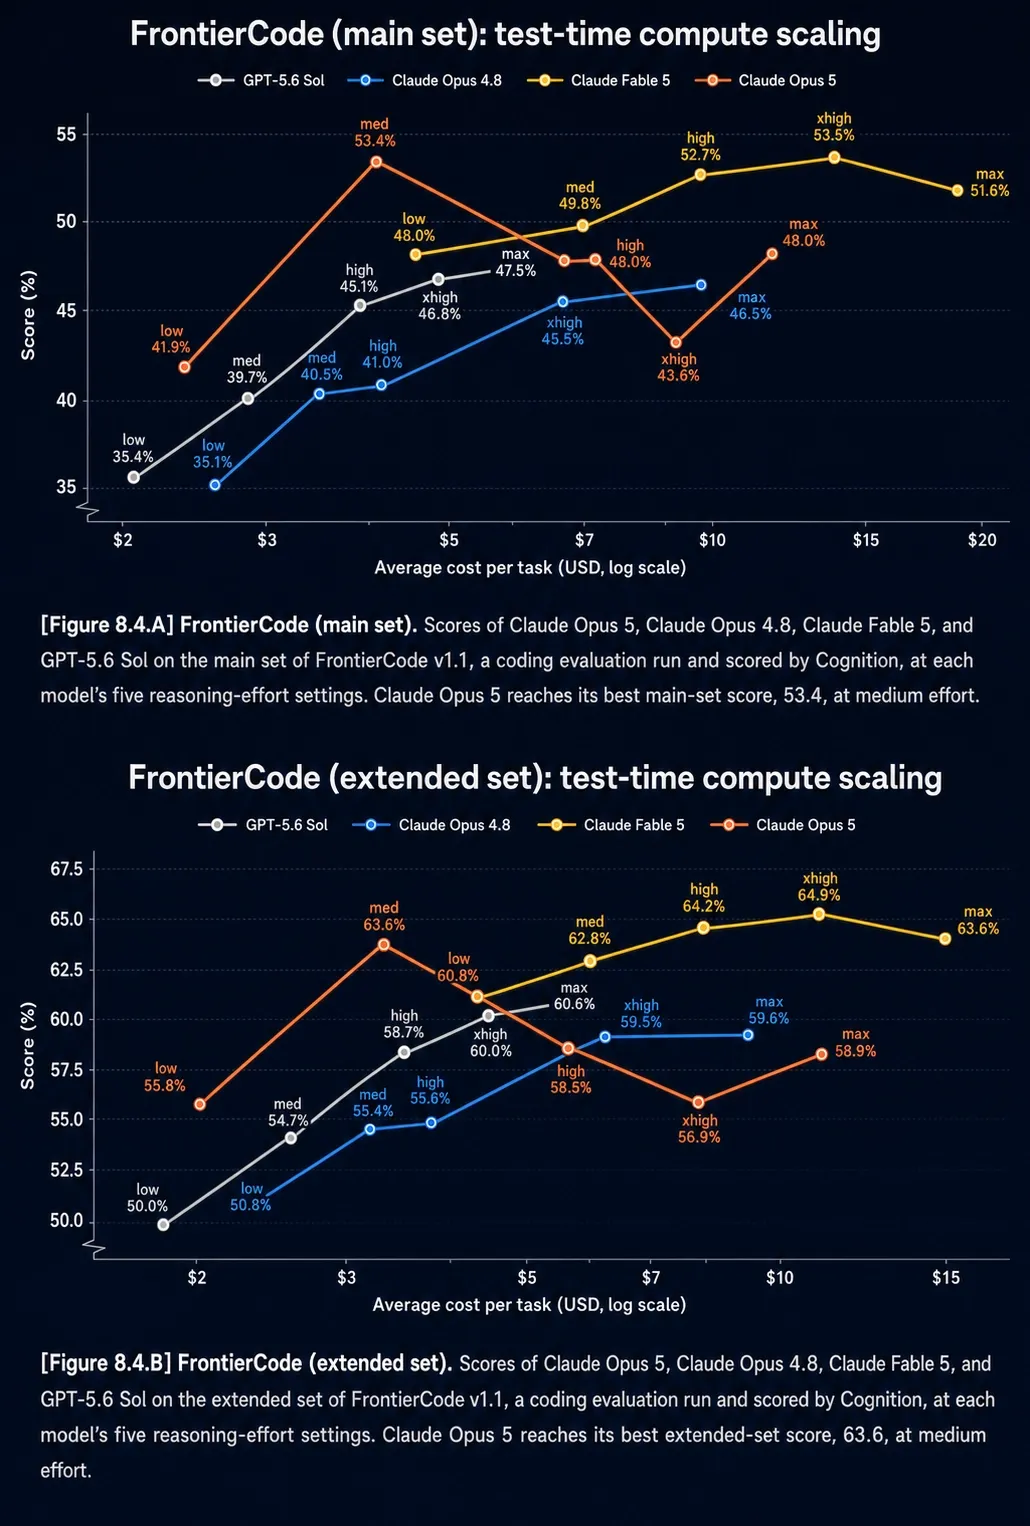 imageグラフを見ると、メインの分割データにおいて「中程度の思考」が、「高い」「非常に高い」「最大」の推論量よりも優れたパフォーマンスを示していることがわかります。
つまり、最適な推論予算を見極めるためには、モデル、プロバイダー、評価ハネス、タスク分布といった要素を総合的に検証する必要があります。思考量を増やすことはコスト増につながり、必ずしも効果的とは限りません。場合によっては、推論トークンが非常に高価な出力トークンであるため、追加のスコア向上が価格の上昇に見合わないこともあります。
独自の評価セットを保持する
多くの企業が独自の評価(evals)を開発していますが、可能であればあなたもそうすべきです。多くの評価手法には、「モデルがインターネット上で答えを検索してしまう」といった報酬ハッキングのリスクや、評価セットが「偶然にも」トレーニングデータに含まれてしまう問題があります。
検証機能に優れた有意義な問題からなる独自のセットを持つことが、モデルをテストする最良の方法です。もし自分で良いベンチマークを作成したいのであれば、Terminal-Bench チームによる素晴らしいブログ記事が参考になります。
結びの言葉
評価(evals)の実践こそ、AI 開発において最も価値のある学習の場です。これを通じて、エージェントがなぜ誤作動を起こすのかを理解し、モデルから最大限のパフォーマンスを引き出す方法や、チームの目標に合致するトレードオフを体得できます。
評価は究極的には試行錯誤のプロセスです。実際に試し、反復し、多くの失敗を経験しなければ、その本質的なやり方を習得することはできません。約束通り、Cline が異なるモデルでどのように動作するかを確認できるよう、数十件の評価実行のトレースデータを添付しました。これらのデータを使ってエージェントを実行し、失敗モードを把握して学ぶことも歓迎します。
評価は難しいものですが、今回紹介したヒューリスティック(経験則)は優れた出発点となります。これを十分に繰り返せば、最終的には再帰的に自己改善するプロンプトを作成し、評価の改善ループから自らを解放することも夢ではありません。
原文を表示
Preface
imageWith new model releases like Fable and Gpt-5.6 Sol, it's becoming increasingly clear that closed-weight models are becoming a very expensive commodity, leaving us at the mercy of frontier labs to tell us what to use and how much.
imagehttps://x.com/levelsio/status/2075530242186166519Most coding-agent subscription plans lack pricing transparency, and the credit limits could have different token values depending on the day. Even the most pro-AI-usage, token-maxxing companies are now finding that their options are either to default to open-weight models or simply to make their own harness for efficiency.
At Cline, we noticed an unusual rise in the token usage of open-weight models in the last few months for obvious reasons, such as price and quality improvements that make open-weight models on par with or better than closed-weight models.
After stack-ranking our usage, we saw that the five most-used models in Cline right now are all open-weight models.
imageSo we started digging into how Cline performs on open-weight models. Most Cline users are spoiled SOTA token-maxxers who burn billions of tokens on the latest frontier models. But all of us are experimenting more with open-weight models, learning how to work with them and how to improve them.
Our new SDK lets us measure the average token size of Cline requests, and the conclusion was damning: our requests ran 20–30% heavier than the publicly advertised averages of the most efficient harnesses. While we did have SOTA eval scores on most open-weight models, the extra token costs didn't make that acceptable.
Promise of this blog
I have read dozens of eval blogs and learned that they are mostly about self-congratulation and benchmark-maxxing. This will be a different blog. I will walk you through the Hill Climber's Checklist: five heuristics for hill climbing and how to approach them depending on your goals. In the end, I will leave you with over a thousand dollars worth of hill-climbing scores and traces. You can download and explore those traces to find nuanced findings by letting your agents go through them.
How do we run evals?
We use Harbor. It is a widely adopted agent-evaluation framework built by the creators of Terminal-Bench. It abstracts away sandbox management, the agent loop, and rollout monitoring to run evals.
Harbor lets you run tons of parallelized evals using Modal on the same 89-problem coding dataset, Terminal Bench, so you can do long eval runs across different coding agent harnesses and quickly figure out aggregate eval run metrics like input tokens, cached tokens, output tokens, net price, tool calls used, etc.
imageWhat do we optimize for evals?
When doing eval runs, you must think of them as multi-objective optimization problems in which you are balancing different, conflicting axes. The goal is to figure out the right mix of targets to optimize for.
Here are a few examples of conflicting targets:
Cost vs Intelligence
Thinking level vs Token Efficiency
Time to Solve vs Eval score
Token efficiency vs Eval score
All the above are scenarios in which you would like to optimize both parts of a conflicting goal, but you must pick the right balance. I can easily score 91% on Terminal Bench if I use Fable's max mode, but it will cost 10 times as much as Kimi K3. So, is an extra 3% really worth 10 times the net run cost?
imageMost eval optimizations involve this type of conflict, in which you can pick your battles. Sometimes you are improving one thing at the expense of another, and you must diligently choose what works best for your use case. For us at Cline, SOTA performance is always a very high priority, but right after that, we care about giving our users the best value for money so they can solve the maximum number of problems with the minimum amount of money. We do things like caching and token-management optimizations, as well as bulk deals like Cline Pass, where we offer you bundled inference at a cheap cost.
Now for the heuristics. There are five, and together they make up the Hill Climber's Checklist.
Get a North Star metric
A North Star metric protects you from two main failure modes of hill climbing:
Doing too much: There's only so much you can squeeze out of a model, and beyond that point you are just running in circles.
Doing too little: You left improvement on the table because your harness was limiting the model.
The purpose of a North Star metric is to find the sweet spot: a score that's reasonably high without spending too much time and effort on over-optimization. Most models perform best in their own harness because the model and the harness are intertwined through both tool-call usage and post-training optimizations.
Cline is building a common harness for everyone, and if you are reading this, you are probably building an agent that works with any model. So when a new model's eval score comes in far below the number in its system card, we need to optimize. If it's off by 1-3%, it's usually not worth chasing a better score. But if it's far below SOTA, you know it's time to get to work. We generally aim to score as high as the best publicly available harness for that model.
Quantify the noise
One measure of a good eval is variance. For meaningful problems, the same model, harness, and configuration should show some variance in the number of eval tests passed. Hard, well-posed tasks put models near the pass/fail boundary, so identical reruns show a real score spread. That spread is what makes the eval discriminative and what gives GRPO-style RL a training signal. But you must first rule out flakiness as the source, which is why we often rerun the eval and report the distribution.
Here are a few examples of variance on Cline's end
Model
Setup
Spread
minimax-m3
Same build, 5 reruns
43.8% to 56.2% (±11 tasks); two back-to-back runs flipped 11 tasks up and 18 down
deepseek-v4-pro
Same build, 2 runs
44.9% vs 53.9% (22 tasks flipped some positive some negative)
glm-5.1
Same build, 3 reruns
46.1% / 47.2% / 49.4% (24% of tasks flipped)
deepseek-v4-flash
Same build, 3 reruns
38.2% / 44.9% / 48.3% (±5 tasks, error count went 20/17/9)
glm-5.2
Same build, many reruns
56.2% to 74.2% (~16 tasks)
Note that the cause of variance must be identified. If there's infrastructure flakiness on your end, that's a problem you must solve. It could be anything from using a low-performance provider to flaky VMs. You must do everything possible to iron out variance in the eval runs and be confident that identical configuration values are respected.
Break down the failure mode
When the net eval score looks wrong, you must slice and dice it until you find where the problem lies. In Terminal-Bench, which has 89 tasks, you can often narrow down potential improvements by breaking down the problem in certain ways.
There are three ways to break it down, in order of priority: task, model, and provider.
Task
The best first method for breaking down failure patterns is by task. We had a token-bloat problem where some models were using a ridiculous number of tokens, and the first instinct was to treat it like a global problem where Cline uses too many tokens, so we need to fix token usage everywhere. In hindsight, that was the wrong frame.
When we compared our traces with those of agents that did not have the same bloat, the gap was not spread evenly across the benchmark. It was confined to a small set of tasks. In one run, about 250K tokens came from just 15 of 89 tasks, and the net token total was 450 million tokens, so roughly 55% of the tokens came from just 17% of the tasks.
imageIt's often very hard to figure out what is wrong with only a certain set of tasks and not others. Aside from looking at tokens, you can also specifically examine their failures.
Instead of manually looking at them, you can ask your agentic harness to go through the traces with different subagents and then give you a summary. I think that is much better than looking at traces with your own eyes.
So, instead of trying to fix token bloat across all 89 tasks, we could isolate those tasks, inspect what the agent was doing differently, and then, once the fixes were made, do a final sanity check across all tasks.
So the way to go about this is:
Begin by identifying problematic tasks.
Selectively improve and rerun your fixes on the selected tasks.
Once improvement is confirmed, do a full-scale run as a sanity check to make sure the fix doesn't break other tasks.
Model
If you are building a common harness, you are not going to maintain a completely different code path and system-prompt flow for every model. Most of the harness is shared: compaction logic, tool calls, context handling, computer use, and subagents usually work using similar logic. The tradeoff that comes with a common harness is that improvements for one model can make other models worse.
A classic example was an experiment in which we added tool-bloat truncation to solve token bloat in MiniMax models.
Model
Before → with the fix → final stack
Direction
minimax-m2.7
32.6% → 41.6% → 46.1%
+13.5 points ▲
glm-5.1
48.3% → 52.8% → 57.3%
+9.0 points ▲
deepseek-v4-pro
47.2% → 47.2% → 42.7%
−4.5 points ▼
deepseek-v4-flash
48.3% → 43.8% → 41.6%
−6.7 points ▼
With one truncation clamp, we saw that it improved MiniMax M2.7 by 13.5 points and GLM-5.1 by 9 points. But it also hurt DeepSeek Flash by 6.7 points and DeepSeek Pro by 4.5. So the same change had opposite effects on different models.
imageThe cut itself was simple: any tool output over 50K got clamped to 8K by keeping the head and tail and deleting the middle. That was pure deletion without compression, so nothing summarized what was removed. Rereading the same file returned the same truncated view, so the model had no way to recover the missing middle. It still helped because an agent resends its entire history on every turn. One giant observation gets paid for on every future request, so trimming it kept the conversation shape sane, preserved cache locality, and cut the cost.
Whether it helps a specific model depends on how that model reads long context. GLM and MiniMax get lost in the middle of long noisy output, so deleting the middle sharpened them: +13.5 and +9 points. DeepSeek reasons over the body and tail of long tool outputs, so the deleted middle held state it was still using, and with no way to get it back it dropped 6.7 and 4.5 points. So it turns out that the same knob had opposite effects depending on the model.
To fix this, you have two options:
A. Make changes comprehensive enough to work generically for most models.
B. Use completely different algorithmic routes for different models. This comes with the drawback of having to maintain mappings between models and mechanisms indefinitely.
We have pursued option B in many ways, using prompt families for different models to optimize for the best parts of different model families, but only after a carefully considered refactor.
In your case, you are looking for the tradeoff. Which models got better? Which ones got worse? And is the regression acceptable for the use case you actually care about? There is no universally better harness. There is only what is better for a particular model, provider, and use case, and you must find that out for yourself.
Providers
Believe it or not, the same model is not the same model on every provider. Many frontier open-weight models are served by multiple providers, such as CoreWeave, Baseten, and Fireworks. People assume the difference between providers is just quantization, but that is only a small part of the story.
Different providers differ in cache hit ratios, quantization, TTFT, latency, and pricing, and every one of those moves your eval metrics. Whenever we onboard a new provider to route traffic to, we make sure its eval score is on par with the others. You can have a good eval score and a bad cache hit rate at the same time. If you don't run evals, you won't know what went wrong.
Here is one concrete example from our GLM-5.2 runs using the same build on two providers:
CoreWeave at medium reasoning: 66/89 tasks, 74.2%.
OpenRouter general routing at medium reasoning: 55/89 tasks, 61.8%.
imageThe route alone was worth 11 tasks, so we learned to track each provider route as its own entry. We have also observed up to a 2x difference in net tokens and cache hit rates between providers, which can turn a $20 run into a $43 run for the same eval.
The moral of the story is that you must be careful when dealing with different open-weight providers and test them with evals before shifting traffic.
More thinking is not automatically better
When it comes to thinking, the general belief is that more is better. This is not necessarily true. Reasoning effort is not a free intelligence knob. It costs more, and sometimes it lowers the score.
Opus 5's FrontierCode result is a classic counterexample to the idea that more thinking leads to better results.
imageYou can see that medium thinking outperformed high, extra-high, and maximum on the main split.
This means you have to run the matrix. The model, provider, harness, and task distribution decide where the useful reasoning budget is. More thinking can be more expensive and less effective, and sometimes the extra score gains from more thinking don't justify the increase in price because thinking tokens are very expensive output tokens.
Keep a private set
Tons of companies are making their own evals, and you should make them too if you can. Many eval methods suffer from reward-hacking behaviors in which models simply look up the answers on the internet; alternatively, eval sets “accidentally” enter the training set.
Having a private set of worthwhile problems with good verifiers is the best way to test models. If you would like to make a good benchmark yourself, this is an incredible blog post from the Terminal-Bench team.
Parting Note
There's no better applied AI exercise than working through evals. It will help you understand why your agents are going wrong and how to squeeze the best possible performance out of a model and expose you to the tradeoffs that align with your teams goals.
Evals are ultimately a trial-and-error mechanism. Unless you try, iterate, and make plenty of mistakes, you'll never really learn how to do it well. As promised, I am attaching dozens of eval run traces so that you can see how Cline’s runs on different models, you are welcome to run agents on these runs to see the failure modes and learn from that.
Evals are hard and these heuristics are a great place to start. If you do it enough, you might even be able to write recursive self-improving prompts to automate yourself out of the eval improvement loop altogether.
関連記事
今日のまとめ
AIデイリーブリーフで今日の重要ニュースをまとめ読み