遅延から即時へ:GitHub Issues のナビゲーションパフォーマンス近代化
GitHub は開発者のフローを阻害する遅延を解消するため、IndexedDB と Service Worker を活用したクライアントサイドキャッシングと予熱戦略を導入し、Issues のナビゲーションパフォーマンスを劇的に改善した。
キーポイント
クライアントサイドへの負荷分散と即時レンダリング
サーバー側の最適化に頼らず、ローカルデータから即座にレンダリングし、バックグラウンドで再検証を行うアーキテクチャへ転換した。
高度なキャッシング戦略の実装
IndexedDB を基盤としたキャッシュレイヤーと、リクエストスパムを防ぎつつヒット率を高める「予熱(preheating)」戦略を導入した。
Service Worker によるナビゲーション高速化
ハードな遷移時でもキャッシュデータが利用可能になるよう Service Worker を導入し、従来の遅延が発生するパスを短縮した。
開発者体験(DX)の向上とフロー維持
Issue 処理中の小さな遅延がコンテキストスイッチを生みフローを阻害するという課題に対し、「瞬時に感じる」速度を実現して生産性を高めた。
HPC ベースの速度評価指標の導入
Web Vitals の LCP に類似した HPC(Highest Priority Content)を用いて、主要コンテンツがレンダリングされるまでの時間を計測し、200ms 未満を「Instant」、1000ms 未満を「Fast」と定義してユーザー知覚速度を評価している。
測定哲学の転換:最悪値から分布品質へ
従来の p90/p99 の改善(最悪ケースの排除)に注力するだけでなく、全セッションの中で「Fast」や「Instant」カテゴリに入る割合を高めることで、大多数のユーザーにとって速度がデフォルトになることを目指している。
ナビゲーションタイプの細分化とボトルネック特定
ハードナビゲーション(完全再読み込み)、Turbo ナビゲーション(部分更新)、ソフトナビゲーション(クライアントサイド遷移)の 3 つに分類し、それぞれのコスト構造を明確化することで真のボトルネックを特定した。
影響分析・編集コメントを表示
影響分析
このアプローチは、単なる速度向上を超えて、開発者の認知負荷を減らしフロー状態を維持するための設計思想の転換を示しています。特に、サーバーサイドのリソース消費を抑えつつユーザー体験を最大化する「ローカルファースト」なアーキテクチャは、大規模 Web アプリケーションのパフォーマンス最適化における新たな標準となる可能性があります。
編集コメント
サーバーサイドの最適化に固執せず、クライアント側のインテリジェントなキャッシュ戦略へ舵を切った事例は、現代の Web パフォーマンス最適化において極めて示唆に富んでいます。開発者の「フロー」を守るという視点は、AI ツールを含むあらゆる生産性ツールの設計において重要な指針となります。
バックログを処理している際、イシューを開いてリンクされたスレッドに移動し、再びリストに戻るという作業において、レイテンシは単なる数値指標ではありません。それはコンテキストスイッチそのものです。わずかな遅延でも蓄積され、開発者がフロー状態を維持しようとしているまさにその瞬間に最も大きな影響を与えます。GitHub Issues が孤立して「遅い」わけではなく、多くのナビゲーションで冗長なデータ取得のコストを支払わされており、それがフローを何度も分断していたのです。
今年初め、私たちはこの問題を解決するために取り組みました。単なるバックエンドの微細な改善を追うのではなく、イシューページの読み込み方法をエンドツーエンドで見直すことで対応しました。私たちのアプローチは、処理をクライアント側にシフトし、知覚されるレイテンシを最適化することです。ローカルで利用可能なデータから即座にレンダリングし、背景で再検証を行うという手法です。これを実現するために、IndexedDB をバックエンドとしたクライアントサイドのキャッシング層を構築し、リクエストのスパムを防ぎつつキャッシュヒット率を向上させるプリヒーティング戦略を追加しました。さらに、ハードナビゲーション時でもキャッシュされたデータが利用可能となるよう、サービスワーカーを導入しました。
本稿では、システムがどのように動作し、実際には何が変更されたのかを順を追って解説します。最適化の対象とした指標、キャッシュとプリヒーティングのアーキテクチャ、かつて遅かったナビゲーション経路を高速化するサービスワーカーの仕組み、そして実世界での利用における結果について取り上げます。また、このアプローチが無料ではないというトレードオフについても掘り下げ、すべての Issues へのアクセス経路において「高速」をデフォルトとするためにまだ何を行う必要があるかについても考察します。データ集約型の Web アプリを開発中の方にとって、これらのパターンはそのまま転用可能です。フルリファクタリングを待たずに、ご自身のシステムでも同様のモデルを適用して知覚される遅延を削減できます。
思考の速度:2026 年の Web パフォーマンス
2026 年において、「十分速い」ことは競争上の基準ではありません。開発者ツールにとって、レイテンシは製品品質そのものです。複数のイシューをトリアージしたり、機能リクエストをレビューしたり、バグを報告したりする際、避けられる待機時間はすべてフローを分断します。
モダンなローカルファーストのツールと徹底的に最適化されたクライアントにより、基準は「1 秒で読み込まれる」から「瞬時に感じる」へと移行しました。この世界では、ユーザーは私たちを古い Web アプリと比較しません。彼らは、毎日経験してきた中で最も高速な体験と比較します。
GitHub Issues は小規模な機能領域ではありません。世界中の数百万人の人々が毎週、コードベースを円滑に稼働させるために Issues に依存しています。Issues が AI 支援ワークの計画層としても役割を果たすようになるにつれ、知覚されるパフォーマンスはさらに重要になります:意図とフィードバックの間のループが遅ければ、システム全体が遅く感じられてしまいます。
私たちは内部チームとコミュニティの両方から同じ問題を聞きました:Issues は速度を第一原則として構築されたツールと比較して重すぎると感じられました。ボトルネックは機能の深さや正確性ではありませんでした。それはアーキテクチャとリクエストライフサイクルでした。データが実質的に以前に見られた場合でも、多くの共通パスで依然としてサーバーレンダリング、ネットワークフェッチ、クライアント起動の完全なコストを支払っていました。
私たちの Issues パフォーマンスチームの役割は、このギャップを埋めることでした。目的は明確かつ技術的でした:製品がデフォルトですぐに動作するように見えるように、データフローとナビゲーション行動を再設計することです。
アーキテクチャを変更する前に、ユーザーの観点で「高速」が何を意味するのか、そしてそれをどのように測定すべきかを合意する必要がありました。一般的なページメトリクスは有用ですが、Issues のような複雑な製品領域には不十分です。
私たちは、Web Vitals の LCP に密接に連動する内部指標である HPC(Highest Priority Content)を使用して、ページ上の主要コンテンツ(ユーザーが関心を持つコンテンツ)が最初にレンダリングされるタイミングを測定します。LCP と同様に、これはブラウザによって選択された単一の HTML 要素に基準が置かれており、イシューページにおいては主にイシュータイトルまたはイシュー本文となります。この要素が迅速にレンダリングされれば、非クリティカルなページ領域の読み込み中であっても、体験は応答性があると感じられます。
運用上、私たちは HPC の閾値を用いてナビゲーションをカテゴリ化しています:
Instant: HPC < 200 ms
Fast: HPC < 1000 ms
Slow: HPC >= 1000 ms
これらの閾値は、単なるバックエンドのレイテンシではなく、ユーザーが知覚する速度に対する実用的なモデルを提供します。200 ミリ秒未満のカテゴリは、実際のワークフローで即座に感じられるインタラクションに対応し、1000 ミリ秒未満のカテゴリは依然として許容可能だが、もはやユーザーの知覚から隠れているわけではない体験を捉えます。
これはまた、私たちの測定哲学が変化した時点でもあります。歴史的には、私たちは HPC の p90 および p99 を追跡し、分布の最悪のテール部分を最小化することに多大な努力を捧げてきました。この取り組みは依然として重要ですが、それが本質的に製品の大多数のユーザーにとって高速であると感じさせることを保証するものではありません。HPC の p99 を向上させつつも、中央値における体験が鈍重に感じられるままとなる可能性があります。
この取り組みにおいて、私たちは焦点を「配信の質」へとシフトしました。つまり、全ユーザー層の中で、どの程度のナビゲーションが高速かつ即座に完了するカテゴリに属しているのかという点です。目標は単に最悪のアウトライヤー(外れ値)を減らすことではなく、速度を大多数のセッションにおけるデフォルトの経路とすることにあります。
ベースライン:変更前のナビゲーションミックス
最適化を実施する前に、ユーザーが実際に issues#show(Issue を表示するためのルート)に到達している方法を明確なモデルとして把握する必要がありました。すべてのナビゲーションを一つの交通クラスとして扱うと、真のボトルネックが見え隠れしてしまいます。
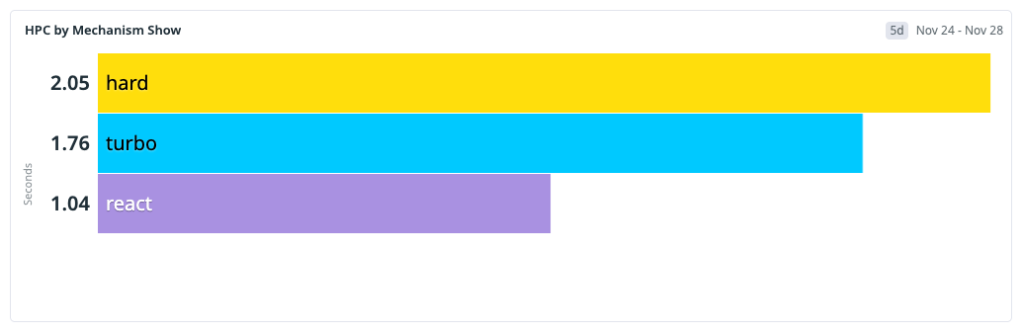
私たちは3 つの主要なナビゲーションタイプを特定しました。
ハードナビゲーション:ネットワークコスト、サーバーレンダリング、アセット読み込み、JavaScript の起動、React の水やり(hydratation)など、すべてのコストを負担する完全なブラウザロード(コールドスタートまたはリフレッシュ)です。
ターボナビゲーション:Rails Turbo による遷移で、ページの一部のみを更新し、完全な再読み込みを回避します。ハードナビゲーションのオーバーヘッドの一部を排除しますが、依然としてサーバーレンダリングされたレスポンスに大きく依存しています。
ソフトナビゲーション(React):既存の React ランタイム内でのクライアントサイド遷移であり、ここでは多くの場合、完全なページブートストラップコストを回避できます。
作業開始時点での測定された分布は以下の通りです。
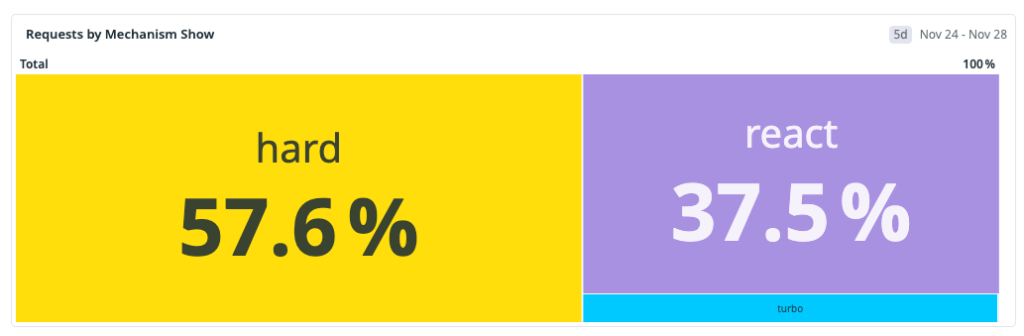
この分布から明らかになったのは、主要な経路こそが遅い経路だったということです。React のソフトナビゲーションに焦点を当てた戦略であれば体験の一部は改善できますが、それだけでは全体的な知覚パフォーマンスを十分に向上させることはできません。
このベースラインが次のアーキテクチャ上の意思決定に反映されました。高速経路を改善し、ハードナビゲーションによるペナルティを減らすことです。なぜなら、そこで多くのユーザーが最も大きなレイテンシを感じていたからです。
注意すべき点があります。GitHub はまだ Rails でレンダリングされたページから React フロントエンドへの移行の最中にあります。この移行期間中、多くのユーザーのジャーニーが Rails と React の境界をまたぐことになります。例えば、Rails ページから Issues へナビゲートする場合など、その境界を越える際にはブラウザは完全なハードナビゲーションとコールドブートを余儀なくされることがよくあります。この境界を越える行為こそが、ハードナビゲーションがベースラインの最大の割合を占めるようになった大きな理由の一つです。
より多くのサーフェスが React ネイティブになるにつれて、ハードナビゲーションの割合は時間とともに減少すると予想しています。しかし、プラットフォーム移行を待つだけでは問題を解決できません。まずは即座にアーキテクチャ上のレバレッジが効き、迅速に改善をリリースできる React のソフトナビゲーションの最適化から始めました。
ターゲットに合意したことで、戦略は明確になりました:スタイル・ウィズ・リバリデート(stale-while-revalidate)を採用したローカルファーストのアプリケーションモデルを構築することです。これは、ユーザーが認識する遅延を最小限に抑えるために、利用可能なローカルデータから即座にレンダリングし、非同期でサーバーに対して再検証を行い、より新しいデータが存在する場合は UI を整合させることを意味します。
ステップ 1:IndexedDB を用いたクライアントサイドキャッシング
最も影響力があり、将来多くのトラフィックを移動させたい場所である「React ソフトナビゲーション」から始めました。このパスではランタイムは既に稼働しているため、主要なコストは通常、データ取得の遅延であり、アプリケーションの起動ではありません。ネットワークを繰り返しの訪問から排除できれば、大量のトラフィックを即座に処理できるカテゴリへ移行できます。
事前のワークストリーム分析では、強い反復アクセスパターンが示されました:ユーザーはトリアージやコラボレーションのループ中に同じイシューを頻繁に再開きます。この行動に基づき、issues#show における潜在的なキャッシュヒット率を約 30% と見積もり、これを初期の実現可能性の閾値として使用しました。
実装は、現在のメモリ内ストアに永続的なクライアントキャッシュ(IndexedDB)を追加することでした。
このレイヤーで IndexedDB を選んだ理由:
メモリのみのストアとは異なり、タブの閉じやブラウザの再起動後も存続する耐久性のあるブラウザストレージです。
効率的なキーベースの検索をイシュークエリペイロードに提供する、インデックス付きオブジェクトストアモデルです。
localStorage よりも実用的に大きなクォータを提供するため、実際の作業セットに適しています。
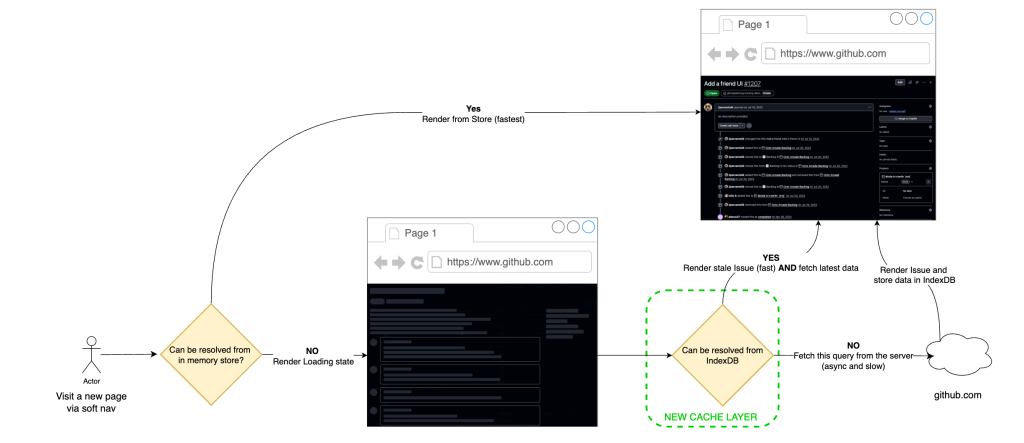
このストレージ層の上に、stale-while-revalidate(古いデータを保持しつつ再検証する)のセマンティクスを実装しました。
読み込みパス:ソフトナビゲーション時には、まずローカルキャッシュからデータを読み込んで即時レンダリングを試みます。
再検証パス:鮮度を保つためにバックグラウンドでネットワークリクエストを発行し、データが変更されていればメモリ内のストアを整合させます。
障害時の動作:ネットワーク環境が悪化した場合でも、ユーザーはキャッシュから利用可能なページを受け取り、接続が回復した時点で鮮度の整合性を再確認します。これにより、新しいグレースフル・デグラデーション(段階的機能低下)モデルを導入しました。
アーキテクチャ上のポイントは、「キャッシュか正しさか」の二者択一ではないことです。これは、同じナビゲーション処理の中で非同期な整合性チェックを伴う、レイテンシ最優先のレンダリングです。
初期の生産環境での結果がこのモデルを検証しました。全ユーザーへの広範な展開後、React のナビゲーションのうち約 22% が瞬時(インスタント)になりました。これはリリース前の 4% からの上昇であり、総リクエストボリュームの約 15% に相当します。観測されたキャッシュヒット率は約 3 分の 1(〜33%)に落ち着き、以前の再訪問分析と一致していました。
主なトレードオフは、制御された古さ(stale-ness)です。サーバーとキャッシュの乖離率は約 4.7% と測定され、これを明示的な運用範囲として扱いました。ソフトナビゲーションにおける知覚される速度向上に対して許容可能であり、ユーザーが視認できる不整合を制限するためのセーフガードも用意されています。
キャッシュヒット率に効果をもたらすことへ
キャッシュの良し悪しは、そのキャッシュヒット率にかかっています。IndexedDB をバックエンドとする SWR(Stale-While-Revalidate)レイヤーは強力な第一歩となりましたが、3 分の 1 のヒット率は、次の限界も露呈させました:ほとんどのナビゲーションで、データよりも先に画面遷移が行われてしまうことです。
素朴な答えは明白でした:ありそうな次のイシューをできるだけ早くプリフェッチする。この方向性を探索しましたが、すぐに実装の複雑さではなく、容量という真の制約に直面しました。イシューリストやダッシュボード、プロジェクトといった高ファンアウトの表面では、積極的なプリフェッチがリクエスト量を増幅し、N+1 型のアクセスパターンを生み出し、ユーザーが開く可能性のないページに対して不必要な計算リソースをシステムに負荷させます。
そこで目標を変更しました。プリフェッチしたデータを常に最新にするのではなく、より安価でスケーラブルな条件を最適化することを目指しました:ユーザーがクリックする時点で、すでに利用可能なデータがローカルに存在するようにすることです。
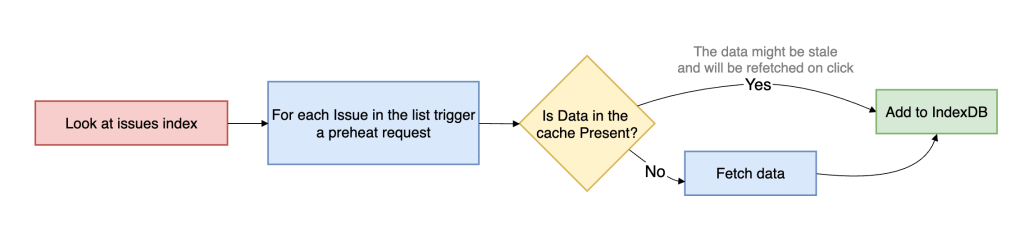
それが「プリヒーティング」です。プリヒーティングは、意図の高いイシュー参照を能動的にトレースし、ナビゲーションの前にキャッシュエントリを準備しますが、イシューがすでにクライアントキャッシュ内に存在しない場合にのみネットワークにアクセスします。もし利用可能なデータが既に存在すれば、プリヒーティングは停止します。これにより、従来のプレロードとは根本的に異なるものとなります。これは鮮度維持のロジックではなく、キャッシュの充填(ポピュレーション)ロジックです。
これは鮮度と容量使用率の間の明示的なトレードオフです。ナビゲーション自体をほぼ瞬時に完了させることができる場合、わずかに古いデータを配信することを受け入れます。なぜなら、ユーザーがイシューを開いた後にバックグラウンドで再検証を行い、最新のサーバー状態に収束させることができるからです。
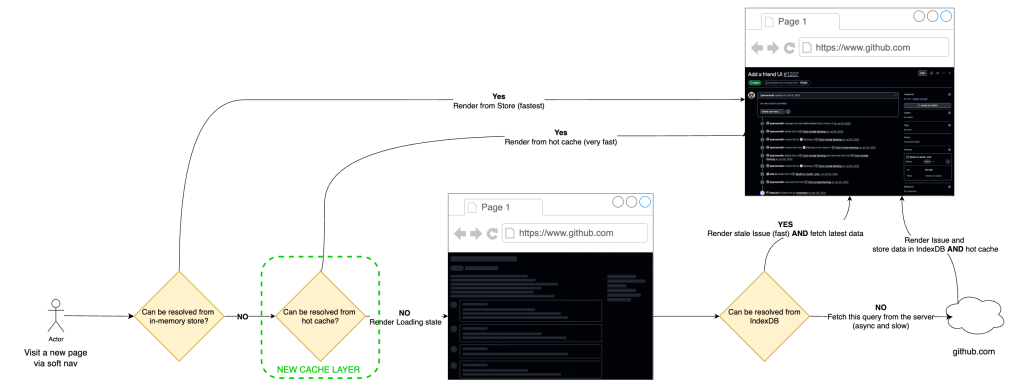
このモデルを効率的にサポートするために、IndexedDB の前にインメモリキャッシュ版を導入しました。IndexedDB はタブやセッションを超えて永続性を提供しますが、依然として非同期であり、クリティカルパス上でコストがかかるわけではありません。インメモリ層はアクティブなインメモリストアと永続ストレージの間に位置し、ホットなイシューペイロードを IndexedDB の読み取りコストを支払うことなく同期的に配信することを可能にします。実際には、これによりソフトナビゲーションから別の非同期境界が除去され、メモリからの直接レンダリングの可能性が大幅に向上します。
運用面では、プリヒーティングはイシューリスト、ダッシュボード、プロジェクト、依存関係ビューといった高意図の表面からトリガーされます。リクエストは低優先度のワーカーで実行され、厳格なレート制限がかけられ、サーキットブレーカーによって保護されているため、負荷が高まった際にはバックオフします。ユーザーが開始した作業は、予測的なフェッチよりも常に優先され、これによりノイジー・ネイバー問題(近隣からの干渉)を回避し、システムを安定させながら、実際のユーザーのナビゲーションに対するキャッシュヒット率を向上させることができます。
その結果、分布に大きな変化が生じました。プリヒーティングを広く展開したことで、issues#show における即時ナビゲーションは全体で約 30% に増加しました。特に React によるナビゲーションに限れば、最大で約 70% が即時化されました。キャッシュヒット率も約 96% に上昇しました。
このトレードオフは許容範囲内でした。私たちは制御されたバックグラウンド容量をわずかに投入するだけで、実ユーザーのナビゲーションの大部分をネットワーク依存パスから外すことに成功したのです。
高速経路の拡大:ターボおよびハードナビゲーションの最適化
React によるナビゲーションでの成果には満足していましたが、ソフトナビゲーションだけが全てではありません。GitHub の移行が Rails から React へと進んでも、ハードナビゲーションは常に存在し続けます。リフレッシュ、新しいタブの開き、直接 URL へのアクセス、外部からのインバウンドリンクなどです。これらのコールドスタートも依然として重要であるため、キャッシュデータによる支援をそこにも提供したかったのです。
私たちが選んだ仕組みがサービスワーカーです。
サービスワーカーは、ページ自体の外側で実行されるブラウザ管理スクリプトであり、リクエストがサーバーに到達する前にネットワークリクエストをインターセプト(中継)することができます。概念的には、ブラウザとオリジンの間に位置し、プログラム可能な仲介役として機能します。これにより、ページの JavaScript ランタイムが既にアクティブである必要なくハードナビゲーションに影響を与えられる、ウェブプラットフォームの少数のプリミティブの一つとなっています。
issues#show において、当社のサービスワーカーは React ナビゲーションのために構築したのと同じローカルファーストモデルを拡張しています。ブラウザが issue ページへのナビゲーションリクエストを開始すると、サービスワーカーがそれをインターセプトし、issue データがすでにローカルキャッシュに存在するかを確認します。もし存在する場合、ワーカーはサーバーに対して大量の処理をスキップできることを示す特定のヘッダーを出力リクエストに付加します。
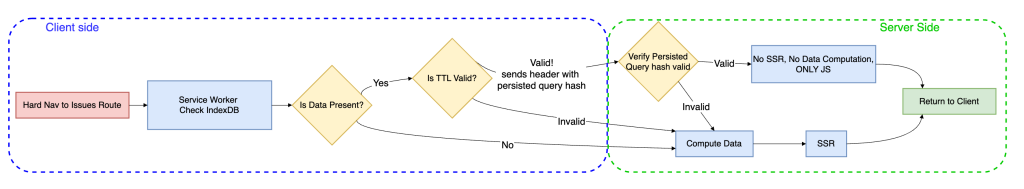
サービスワーカーがキャッシュヒットを検知すると、リクエストヘッダーを通じてサーバーにシグナルを送ります。ここからナビゲーションは 2 つのパスに分岐します。
キャッシュヒットパス:薄い HTML シェル(レイアウト+最小限のマークアップ+JS)を返し、React がローカルキャッシュされた issue ペイロードからレンダリングを行います。
キャッシュミスパス:通常のレスポンスを返す(サーバーがデータをロードし、ページを SSR する)。
これは厳格な最適化であり、キャッシュが冷えている場合や陳腐化している場合、あるいはサービスワーカーが利用できない場合は、標準的なサーバーレンダリングパスにフォールバックします。
この手法は Turbo ナビゲーションにおいて特に顕著な効果をもたらしました。なぜなら Turbo パスは依然としてサーバー応答時間に大きく制約されているからです。サービスワーカーが issue データがすでに存在することをシグナルできるようになると、サーバーはアプリケーションフラグメントの計算に要する時間が大幅に短縮され、Turbo はバックエンド作業の削減から即座に恩恵を受けます。
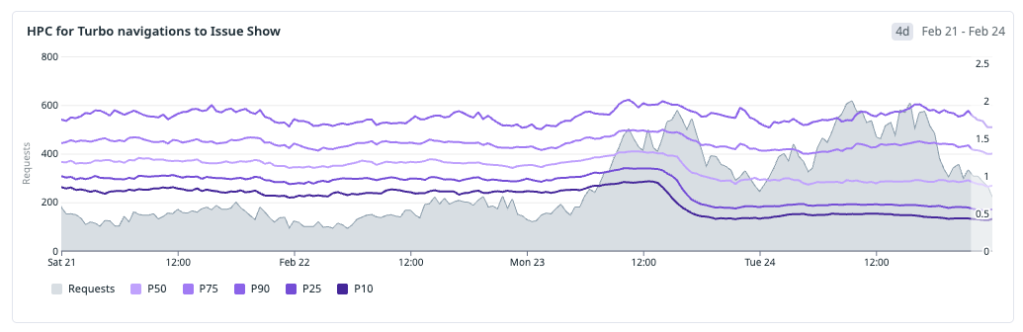
ハードナビゲーションの改善効果は確かに存在しますが、Turbo の改善効果ほど即座には目立ちません。キャッシュヒット時のハードナビゲーションでは、サーバーサイドレンダリング(SSR)の時間をクライアントサイドレンダリングに置き換えているためです。これにより、クリティカルパスは JavaScript のダウンロードと実行へと移行しました。
このコストを削減するため、React.lazy と動的なルートプリローディングを用いてコードをルートごとに分割し、現在のルートに必要なコードのみを事前にフェッチするようにしています。同様の原則をコンポーネントレベルでも適用し、初期ビューに必要なものだけをロードし、非クリティカルなモジュールは遅延読み込みします。例えば、ユーザーが編集モードに入った際にのみ issue エディタのバンドルを取得し、ホバーなどの意図ベースのプリフェッチ(intent-based prefetching)を用いてそのレイテンシを隠蔽しつつ、初期バンドルの肥大化を防いでいます。
結果
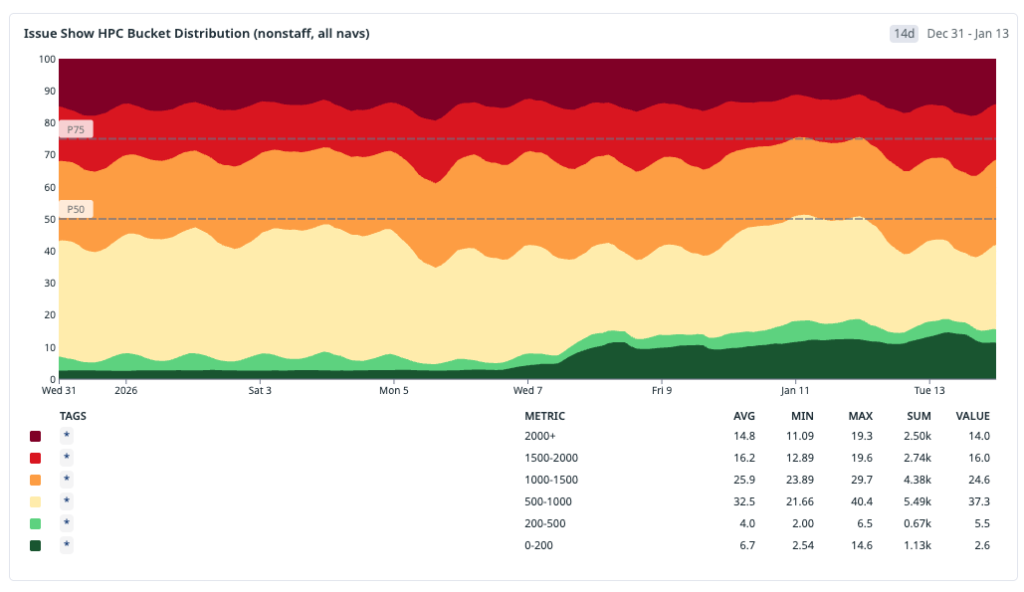
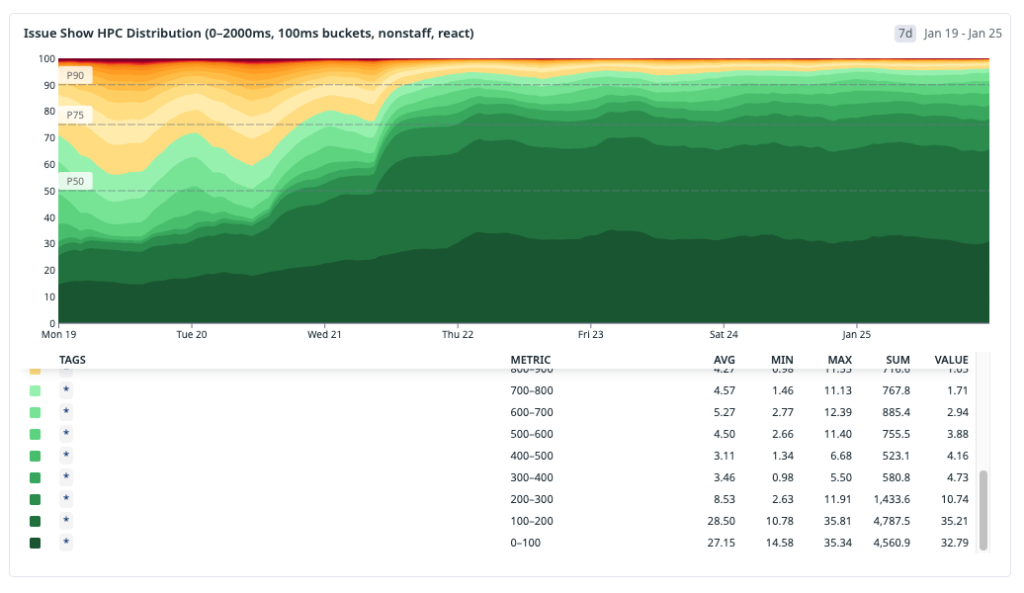
これらの変更をデプロイした後、私たちは一歩引いて累積的な影響を確認したくなりました。初期の IndexedDB キャッシュからプリヒーティング、メモリ内レイヤリング、そしてサービスワーカーに至るまでの全展開期間を通じて HPC(高速ページ読み込み)指標を分析しましたが、その傾向は明確かつ持続的であり、分布が高速側へとシフトしていることがわかります。
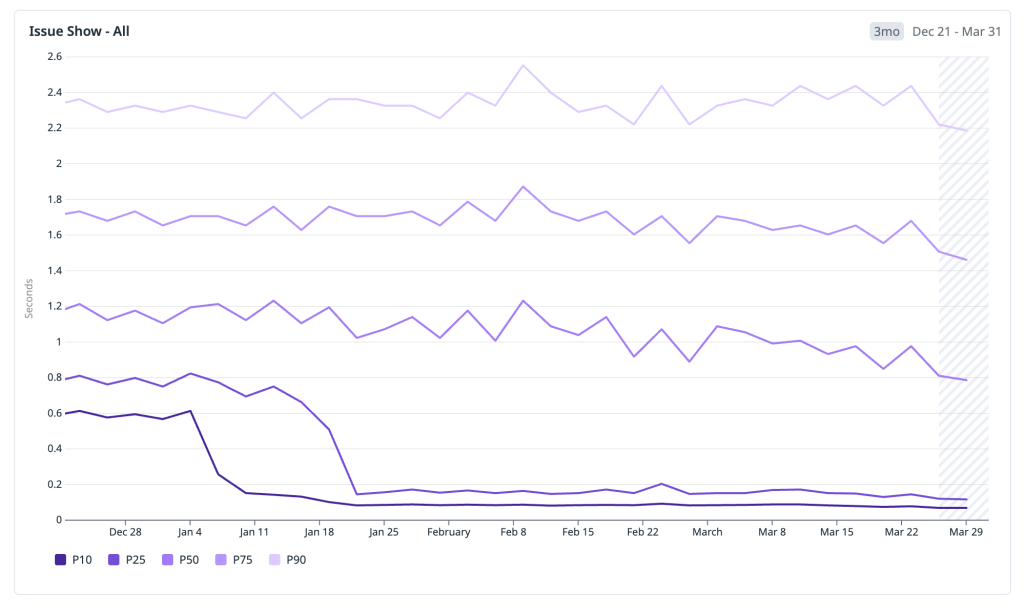
単に良い週を一つ選び出すのではなく、完全な期間を対象として分析し、直近の数ヶ月における具体的な成果を共有します。以下は、すべての issues#show トラフィックにおける HPC のパーセンタイル値です:
P10: ~600 ms → 70 ms — 最速のナビゲーションは明確に「瞬時」カテゴリに移行し、200 ms を大きく下回りました。
P25: ~800 ms → 120 ms — すべてのナビゲーションの四分の一が現在 120 ms 未満で完了しており、ほぼ 1 秒かかっていた時代から大幅に短縮されました。
P50: ~1,200 ms → 700 ms — メディアン(中央値)の体験が 1 秒の閾値を下回り、「遅い」カテゴリから「速い」カテゴリへ移行しました。
P75: 1,800 ms → 1,400 ms — 第 3 四分位数は 400 ms を超えて低下し、知覚可能なレイテンシの長い尾が縮小されました。
P90: 2,400 ms → 2,100 ms — 最も遅いナビゲーションでさえ改善しましたが、この尾(テール)はさらに作業が必要な領域を明確に示す指標として残っています。
際立ったパターンは、低いパーセンタイルにおける異常なまでの改善です。P10 と P25 が劇的に圧縮されたのは、キャッシュ済みおよびプリヒート済みのナビゲーションがその分布の大部分を占めるようになったためです。メディアンも意味のある改善を見せましたが、依然としてコールドスタート(初期起動)トラフィックの影響を受けています。また、上部の尾は以前より良くなっていますが、JavaScript のブートとクライアントレンダリングがボトルネックとなっている難易度の高いナビゲーションパスを反映しており、まさに次に取り組むべき領域です。
数値は最適化の物語を語りますが、最終的に重要なのはユーザーへの影響です。以下の動画では、これらの変更が実際のセッションで課題間を全速力で移動する際にどのような体感をもたらすかを示しています:
今後の取り組み
GitHub Issues はこれまでで最も高速化されています。ソフトナビゲーション、プリヒートパス、サービスワーカーによる加速フロー全体を通じて、ユーザーが知覚するレイテンシの分布を大幅に変え、より多くのトラフィックを「即時」カテゴリに移動させることに成功しました。
同時に、完了したわけではありません。SSR に依存するコールドスタートは依然として大きな障壁であり、特にサーバー側の処理が削減された後にクライアントの起動や JavaScript 実行が主要なコストとなる場合、その課題は顕著です。
次のフェーズでは、より大きな課題に取り組みます。低レイテンシ配信を明示的に最適化したバックエンドスタックの一部を対象としたリファクタリングを計画しており、ラウンドトリップ数を削減し応答時間をさらに改善するために、エッジに近いモダンな UI 配信層への投資も進めています。
パフォーマンスは一度きりのプロジェクトではなく、継続的なシステム投資です。アーキテクチャは改善されつつあり、ボトルネックも変化しています。すべてのナビゲーションパスで高速さがデフォルトの体験となるまで、私たちは継続的に改良を続けていきます。
GitHub Issues のクイックスタートガイドはこちら >
本記事「From latency to instant: Modernizing GitHub Issues navigation performance」は、The GitHub Blog に最初に掲載されました。
原文を表示
When you’re working through a backlog—opening an issue, jumping to a linked thread, then back to the list—latency isn’t just a metric. It’s a context switch. Even small delays add up, and they hit hardest at the exact moments developers are trying to stay in flow. It’s not that GitHub Issues was “slow” in isolation; it’s that too many navigations still paid the cost of redundant data fetching, breaking flow again and again.
Earlier this year, we set out to fix that—not by chasing marginal backend wins, but by changing how issue pages load end-to-end. Our approach was to shift work to the client and optimize perceived latency: render instantly from locally available data, then revalidate in the background. To make that work, we built a client-side caching layer backed by IndexedDB, added a preheating strategy to improve cache hit rates without spamming requests, and introduced a service worker so cached data remains usable even on hard navigations.
In this post, we’ll walk through how the system works and what changed in practice. We’ll cover the metric we optimized for; the caching and preheating architecture; how the service worker speeds up navigation paths that used to be slow; and the results across real-world usage. We’ll also dig into the tradeoffs—because this approach isn’t free—and what still needs to happen to make “fast” the default across every path into Issues. If you’re building a data-heavy web app, these patterns are directly transferable: you can apply the same model to reduce perceived latency in your own system without waiting for a full rewrite.
The speed of thought: Web performance in 2026
In 2026, “fast enough” is not a competitive bar. For developer tools, latency is product quality. When someone is triaging multiple issues, reviewing a feature request or reporting a bug, every avoidable wait breaks flow.
Modern local-first tools and aggressively optimized clients have moved the standard from “loads in a second” to “feels instant.” In this world, users do not benchmark us against old web apps. They benchmark us against the fastest experience they have ever had every day.
GitHub Issues is not a small surface area. Every week millions of people around the world rely on Issues to keep their codebase running smoothly. As Issues also becomes the planning layer for AI-assisted work, perceived performance becomes even more critical: if the loop between intent and feedback is slow, the entire system feels slow.
We heard the same problems from both internal teams and the community: Issues felt too heavy compared to tools built with speed as a first principle. The bottleneck was not feature depth or correctness. It was architecture and request lifecycle. Too many common paths still paid the full cost of server rendering, network fetches, and client boot, even when data had effectively been seen before.
Our Issues Performance team’s job was to close that gap. The objective was straightforward and technical: redesign data flow and navigation behavior so the product feels instant by default.
Before changing architecture, we needed to align on what “fast” means in user terms and how to measure it. Generic page metrics are useful, but they are not sufficient for a complex product surface like Issues.
We use HPC (Highest Priority Content), an internal metric closely aligned with Web Vitals LCP, to measure when the primary content (the content users care about) on the page is first rendered. Like LCP, this is anchored to a single HTML element selected by the browser, which on issue pages is most often the issue title or the issue body. If that element is rendered quickly, the experience feels responsive even if non-critical page regions are still loading.
Operationally, we bucket navigations using HPC thresholds:
Instant: HPC < 200 ms
Fast: HPC < 1000 ms
Slow: HPC >= 1000 ms
These thresholds give us a practical model for user-perceived speed, not just raw backend latency. The <200 ms bucket maps to interactions that feel immediate in real workflows, while the <1000 ms bucket captures experiences that are still acceptable but no longer invisible to users.
This is also the point at which our measurement philosophy evolved. Historically, we dedicated significant effort to tracking the p90 and p99 of the HPC and minimizing the worst tail of the distribution. While this work remains important, it does not inherently ensure that the product feels fast for the majority of users. It is possible to enhance the p99 of the HPC while still leaving the median experience feeling sluggish.
For this initiative, we shifted focus toward distribution quality: how many navigations land in our fast and instant buckets across the whole population? The goal is not just fewer terrible outliers. It’s to make speed the default path for the majority of sessions.
The baseline: Navigation mix before we changed anything
Before implementing optimizations, we needed a clear model of how users were actually reaching issues#show (the route for viewing an issue). Treating all navigations as one class of traffic would hide the real bottlenecks.
We identified three primary navigation types:
Hard navigation: a full browser load (cold start or refresh) where we pay the full cost of network, server rendering, asset loading, JavaScript boot and React hydration.
Turbo navigation: a Rails Turbo transition that updates targeted page regions without a full reload. It avoids some hard-navigation overhead but still depends heavily on server-rendered responses.
Soft navigation (React): a client-side transition inside the existing React runtime, where we can often avoid full page bootstrap costs.
Our measured distribution at the start of the workstream was:
That distribution made one thing obvious: the dominant path was also the slowest. Any strategy focused only on React soft navigations could improve part of the experience, but it could not move overall perceived performance enough on its own.
This baseline shaped our next architecture decisions: improve the fast paths and reduce the hard-navigation penalty, because that’s where most users were seeing the most latency.
One thing to note: GitHub is still in the middle of moving from Rails-rendered pages to a React frontend. During that transition, many user journeys cross the Rails/React boundary. When that happens—for example, navigating from a Rails page into Issues—the browser often has to do a full hard navigation and cold boot. That boundary crossing is a big reason hard navigations made up the largest share of our baseline.
We expect that share of hard navigations to decrease over time as more surfaces become React-native. But we could not wait for platform migration alone to solve our problem. We started by optimizing React soft navigations first, where we had immediate architectural leverage and could ship improvements quickly.
Once we aligned on the target, our strategy became clear: build a local-first application model with stale-while-revalidate. That means rendering immediately from locally available data to minimize user-visible latency, then asynchronously revalidating against the server and reconciling the UI if newer data exists.
Step 1: Client-side caching with IndexedDB
We started where we had the most leverage and where we want to move most traffic in the future: React soft navigations. In this path, the runtime is already alive, so the dominant cost is usually data fetch latency, not application boot. If we could remove network from repeated visits, we could move a large slice of traffic into the instant bucket.
Our pre-workstream analysis showed a strong repeated-access pattern: users reopen the same issues frequently during triage and collaboration loops. Based on that behavior, we estimated a potential cache-hit ratio of roughly 30% for issues#show and used that as the initial viability threshold.
The implementation was to extend our current in-memory store with a persistent client cache in IndexedDB.
Why we chose IndexedDB for this layer:
Durable browser storage that survives tab closes and browser restarts, unlike memory-only stores.
Indexed object-store model, which gives efficient key-based lookups for issue query payloads.
Larger practical quota than localStorage, making it appropriate for real working sets.
On top of that storage layer, we implemented stale-while-revalidate semantics:
Read path: on soft navigation, attempt to hydrate from local cache first and render immediately.
Revalidation path: issue a background network request for freshness and reconcile the in-memory store if data changed.
Failure behavior: when network is degraded, users still get a usable page from cache, with freshness reconciled once connectivity recovers, introducing a new graceful-degradation model.
The architectural point is that this is not “cache or correctness.” It is latency-first rendering with asynchronous consistency checks on the same navigation.
Initial production results validated the model. After broad rollout to all users, approximately 22% of React navigations became instant—up from 4% pre-launch—representing about 15% of total request volume. Observed cache-hit ratio landed around one-third (~33%), which was consistent with the earlier revisit analysis.
The main tradeoff is controlled staleness. We measured server/cache divergence at about 4.7% and treated that as an explicit operating envelope: acceptable for the perceived speed gains on soft navigations, with safeguards to limit user-visible inconsistency.
Moving the needle on cache-hit ratios
Caching is only as good as its cache-hit ratio. The IndexedDB-backed SWR (Stale-While-Revalidate) layer gave us a strong first step, but a one-third hit rate also exposed the next limitation: most navigations still arrived before the data did.
The naive answer was obvious: prefetch every likely next issue as early as possible. We explored that direction and quickly ran into the real constraint, which was not implementation complexity but capacity. On high-fanout surfaces such as issue lists, dashboards, and projects, eager prefetching amplifies request volume, creates N+1-style access patterns and pushes unnecessary compute onto the system for pages a user may never open.
So we changed the objective. Instead of trying to make prefetched data always fresh, we optimized for a cheaper and more scalable condition: make sure some usable data is already local by the time the user clicks.
That is preheating. Preheating proactively walks high-intent issue references and prepares cache entries ahead of navigation, but it only hits the network when the issue is not already present in the client cache. If usable data already exists, preheating stops. This makes it fundamentally different from traditional preloading. It is cache-population logic, not freshness-enforcement logic.
This is an explicit tradeoff between freshness and capacity usage. We are willing to serve data that may be slightly stale if that allows the navigation itself to complete near instantaneous, because once the user opens the issue, we can still revalidate in the background and converge to the latest server state.
To support that model efficiently, we introduced an in-memory cache version in front of IndexedDB. IndexedDB gives persistence across tabs and sessions, but it is still asynchronous and therefore not free on the critical path. The in-memory layer sits between the active in-memory store and persistent storage, allowing hot issue payloads to be served synchronously without paying even the IndexedDB read cost. In practice, this removes another async boundary from soft navigation and materially increases the probability of rendering directly from memory.
Operationally, preheating is triggered from high-intent surfaces such as issue lists, dashboards, projects, and dependency views. Requests run on low-priority workers, are strictly rate-limited and are guarded by circuit breakers, so the mechanism backs off under pressure. User-initiated work always takes precedence over speculative fetches, allowing us to avoid the noisy-neighbor problem and keep the system stable while still improving cache-hit ratios for real user navigations.
The result was a large shift in distribution. After rolling out preheating broadly, instant navigations for issues#show increased to roughly 30% overall. For React navigations specifically, up to ~70% became instant. Cache-hit ratio rose to roughly 96%.
That tradeoff was acceptable. We spent a small amount of controlled background capacity to move a large percentage of real user navigations out of the network-bound path.
Expanding the fast path: Optimizing turbo and hard navigations
We were happy with the React navigation gains, but soft navigations aren’t the whole story. Even as more of GitHub moves from Rails to React, hard navigations will always exist—refreshes, new tabs, direct URLs, and inbound links. Those cold starts still matter, so we wanted cached data to help there too.
The mechanism we chose was a service worker.
A service worker is a browser-managed script that runs outside the page itself and can intercept network requests before they reach the server. Conceptually, it sits between the browser and the origin as a programmable middleman. That makes it one of the few web platform primitives that can influence hard navigations without requiring the page’s JavaScript runtime to already be active.
For issues#show, our service worker extends the same local-first model we built for React navigations. When the browser starts a navigation request for an issue page, the service worker intercepts it and checks whether the issue data is already available in local cache. If it is, the worker annotates the outgoing request with a specific header that tells the server it can skip a substantial amount of work.
When the service worker detects a cache hit, it signals to the server via a request header. From there, the navigation splits into two paths:
Cache hit path: return a thin HTML shell (layout + minimal markup + JS), and let React render from the locally cached issue payload.
Cache miss path: return the normal response (server loads data and SSRs the page).
This is a strict optimization: if the cache is cold, stale, or the service worker isn’t available, behavior falls back to the standard server-rendered path.
This had an especially strong effect on Turbo navigations, because Turbo paths are still heavily constrained by server response time. Once the service worker can signal that issue data is already present, the server spends much less time computing the application fragment, and Turbo benefits almost immediately from that reduction in backend work.
Hard-navigation gains are real, but they are less immediately visible than Turbo gains: on cache-hit hard navigations, so we trade SSR time for client-side rendering. The critical path now becomes JavaScript download and execution.
To reduce that cost, we split code by route using React.lazy and dynamic route preloading, so only the code required for the current route is fetched up front. We apply the same principle at the component level, loading only what’s necessary for the initial view and deferring non-critical modules. For example, we only fetch the issue editor bundle when a user enters edit mode, and use intent-based prefetching (like hover) to hide that latency without bloating the initial bundle.
The results
After deploying these changes, we wanted to step back and look at the cumulative impact. We analyzed the HPC metric across the entire rollout period—from the initial IndexedDB cache through preheating, in-memory layering, and the service worker—and the trend is clear and sustained: the distribution is shifting toward fast.
Rather than cherry-pick a single good week, we looked at the full window to share some concrete wins from recent months. Below are the HPC percentiles across all issues#show traffic:
P10: ~600 ms → 70 ms — the fastest navigations moved firmly into the instant bucket, well below 200 ms.
P25: ~800 ms → 120 ms — a quarter of all navigations now complete in under 120 ms, down from nearly a full second.
P50: ~1,200 ms → 700 ms — the median experience crossed below the one-second threshold, moving from the slow bucket into fast.
P75: 1,800 ms → 1,400 ms — the upper quartile dropped by over 400 ms, shrinking the long tail of perceptible latency.
P90: 2,400 ms → 2,100 ms — even the slowest navigations improved, though this tail remains the clearest signal of where further work is needed.
The pattern that stands out is the outsized improvement in the lower percentiles. P10 and P25 compressed dramatically because cached and preheated navigations now dominate that part of the distribution. The median improved meaningfully but is still shaped by cold-start traffic. And the upper tail, while better, reflects the hard-navigation paths where JavaScript boot and client rendering are now the bottleneck—exactly the area we are targeting next.
Numbers tell the optimization story, but what ultimately matters is the user impact. The video below shows what these changes feel like in practice—navigating between issues at full speed in a real session:
The work ahead
GitHub Issues is faster today than it has ever been. Across soft navigations, preheated paths, and service-worker-accelerated flows, we have materially changed the distribution of user-perceived latency and moved a much larger share of traffic into the instant bucket.
At the same time, we are not done. Cold starts that rely on SSR are still a real hurdle, especially when client boot and JavaScript execution become the dominant cost after server work is reduced.
The next phase is about moving bigger rocks. We are planning targeted rewrites of parts of our backend stack optimized explicitly for low-latency delivery and are investing in a modern UI delivery layer closer to the edge to reduce round trips and improve response time further.
Performance remains a continuous systems investment, not a one-time project. The architecture is improving, the bottlenecks are changing, and we will keep iterating until fast is the default experience across all navigation paths.
Check out the Quickstart guide for GitHub Issues >
The post From latency to instant: Modernizing GitHub Issues navigation performance appeared first on The GitHub Blog.
関連記事
今日のまとめ
AI日報で今日の重要ニュースをまとめ読み