自然言語プロンプトからダッシュボードを生成する Amazon Quick の新機能
Amazon Quick が自然言語プロンプトから多シートダッシュボードを自動生成する機能を実装し、BI プロフェッショナルの作業時間を劇的に短縮した。
キーポイント
自然言語による自動ダッシュボード生成
単一または複数のデータセットに対して自然言語で指示を出すだけで、視覚化された分析結果を数分で生成する機能を提供する。
高度な分析要素の自動実装
生成されるダッシュボードには、ステークホルダー向けのフィルタ制御や、年次対比・月次対比などの計算フィールドが自動的に組み込まれる。
インタラクティブな計画レビュー機能
生成前に提案された構造の「インタラクティブプラン」を確認・編集できるため、最終出力に対するユーザーの制御権を維持できる。
影響分析・編集コメントを表示
影響分析
この機能は、データ分析の民主化を加速させる重要な転換点であり、専門的な BI ツール操作スキルを持たない層でも高度な分析レポートを作成可能にする。企業内での意思決定プロセスが迅速化し、データドリブンな文化の浸透がさらに進むことが期待される。
編集コメント
自然言語によるデータ分析ツールの進化は、組織全体のデータ活用効率を底上げする可能性が高く、特に中小規模のチームや非専門的なビジネスユーザーにとって画期的なツールと言えます。
意味のあるダッシュボードを構築するには、熟練した BI プロフェッショナルであっても数時間の手動設定が必要です。Amazon Quick は、自然言語のプロンプトから完全な複数シート構成のダッシュボードを生成し、1 つ以上のデータセットから本番環境での分析まで数分で完了させます。定期的な運用レポートを作成するデータアナリスト、経営層レビューの準備をするプログラムマネージャー、新しいデータセットを検索するエンジニアは、自分が望むものを記述するだけでよく、Amazon Quick が*整理された複数のシート*を生成し、データの特性に合わせたビジュアルや、ステークホルダーが異なる次元で探索できる*フィルターコントロール*、年対年成長率や月対月比較などの*計算フィールド*を提供します。生成前には、提案された構造の*インタラクティブなプラン*を確認・編集でき、最終出力に対する制御権を維持できます。
Amazon Quick において、「分析(Analysis)」は、複数のシートにわたってビジュアル、フィルター、計算フィールドを構築・配置する作成画面です。共有する準備ができたら、この分析をダッシュボードとして公開します。今回の新しい生成 AI 機能では、分析が自動的に作成されるため、ワンクリックでこれを精査し、ダッシュボードとして公開できます。
本稿では、プロンプトから分析を生成し、プランを確認し、完成した出力を検索する手順を追跡します。
前提条件
以下の前提条件が必要です:
- AWS アカウント
- Amazon Quick Enterprise Edition のサブスクリプション
仕組み
分析を生成するには、まず分析対象のデータを選択します。Amazon Quick では、データは データセット に保存されており、これらは Amazon Redshift や Amazon Simple Storage Service (Amazon S3)、またはアップロードされたファイルなどのソースに接続されています。データセットの準備が整ったら、表示したい内容を記述し、計画を確認して生成します。
データセットの選択
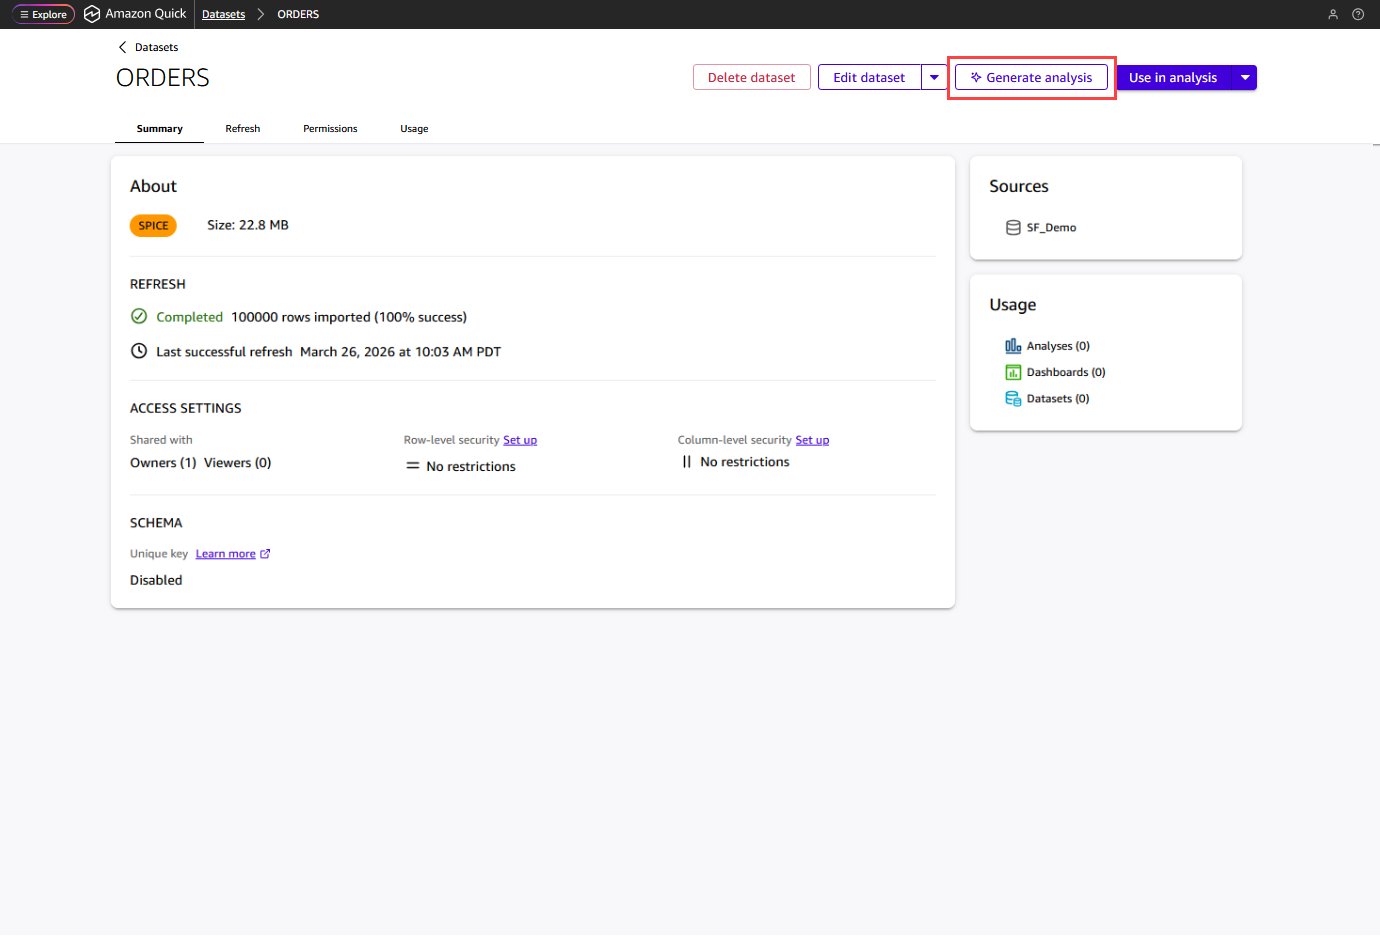
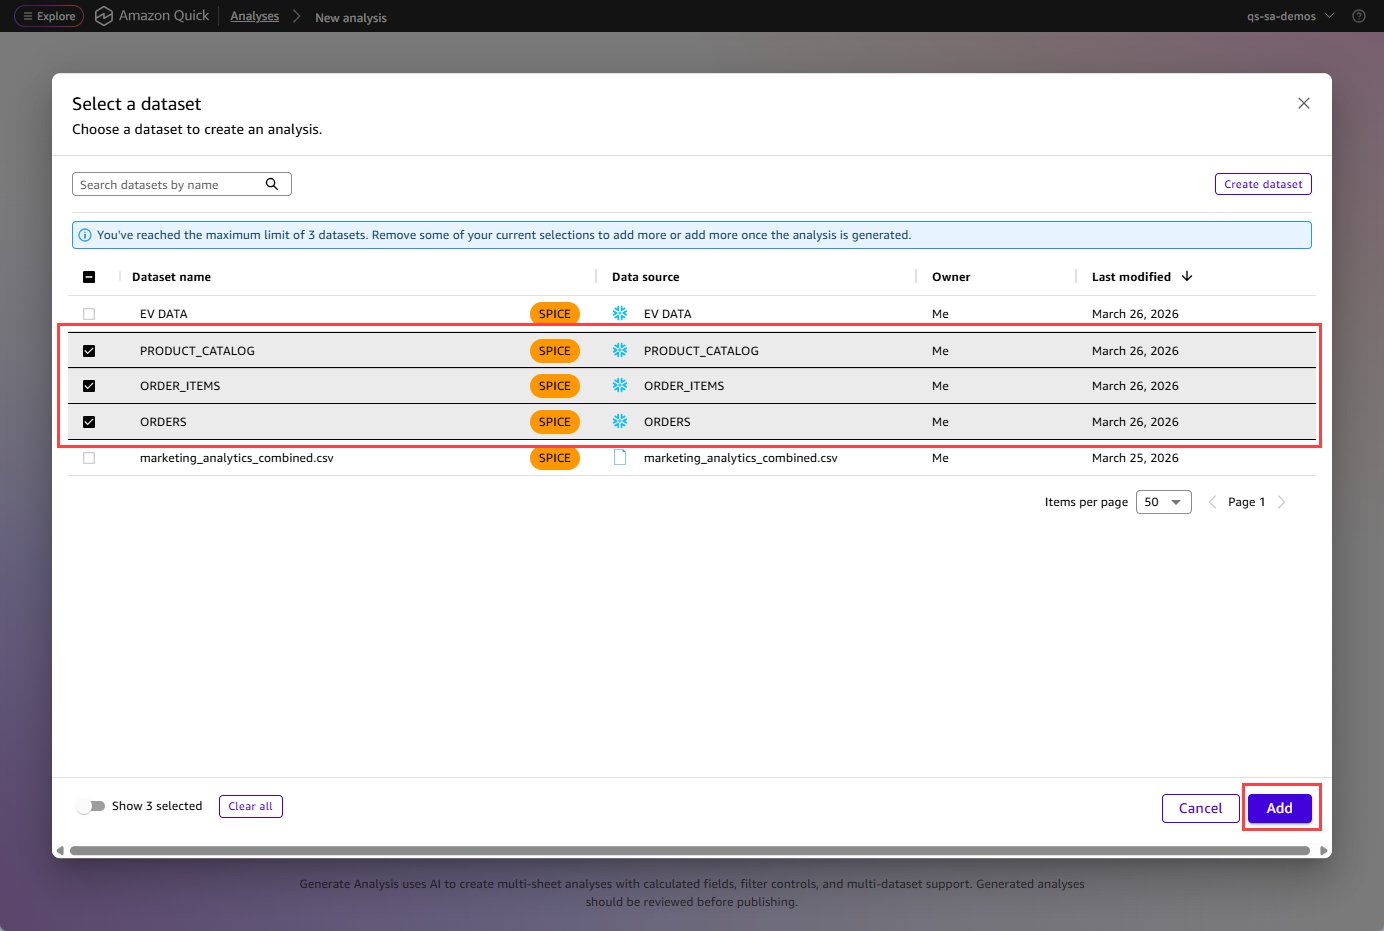
Amazon Quick でデータセットを開き、分析を生成を選択してください。また、「分析」ページから始めることもできます。分析には 1〜3 のデータセットを選択します。データが複数のテーブルにわたっている場合(例:あるデータセットに注文データ、別のデータセットに製品データがある場合)は、それらをまとめて選択できます。
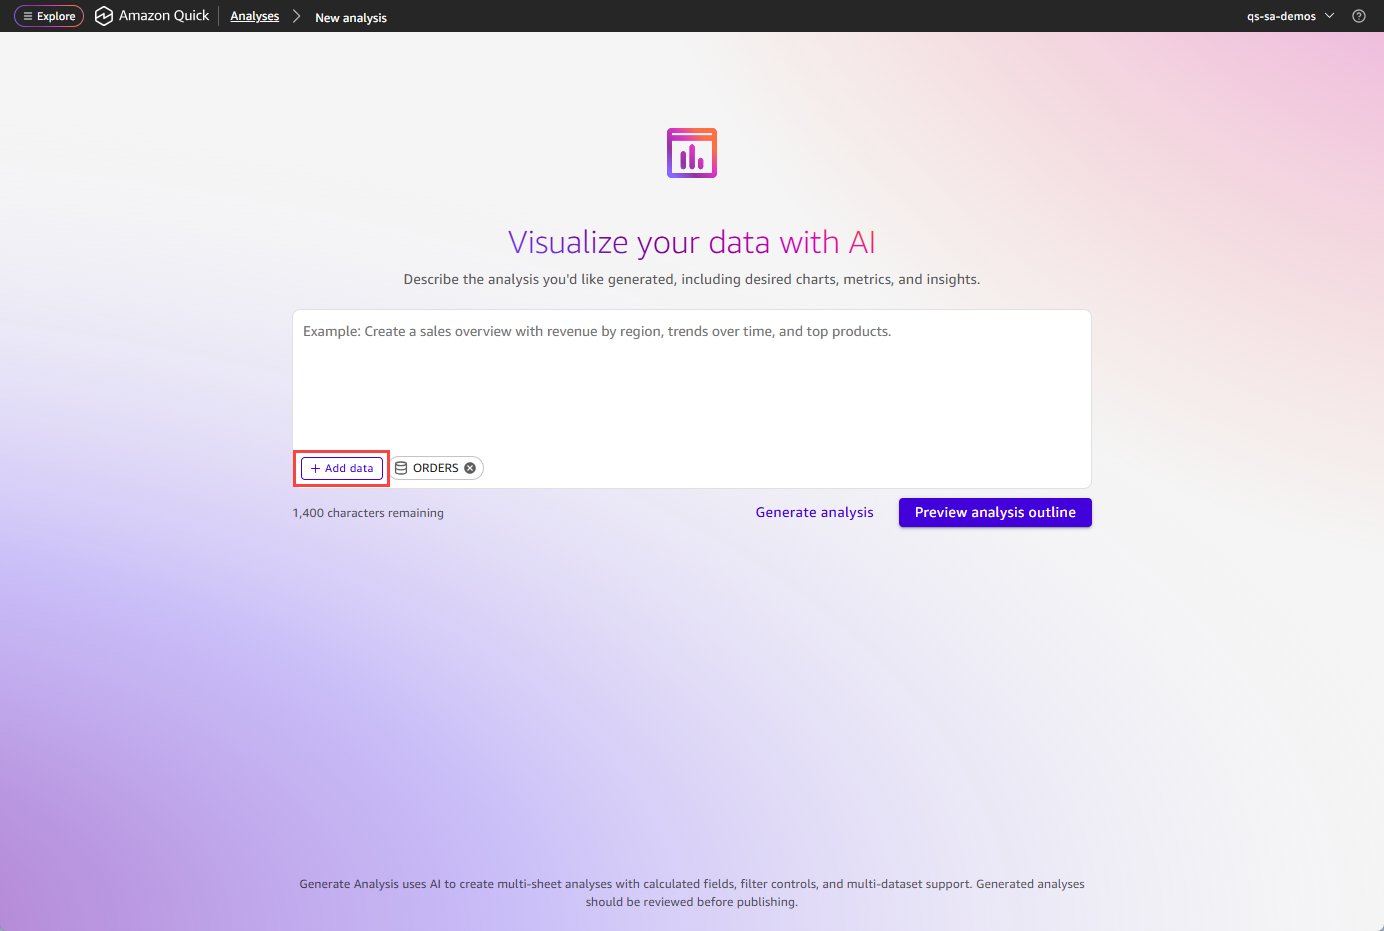
必要に応じて、データの追加を選択してさらにデータセットを追加できます。
分析/ダッシュボードに何を求めているか記述する
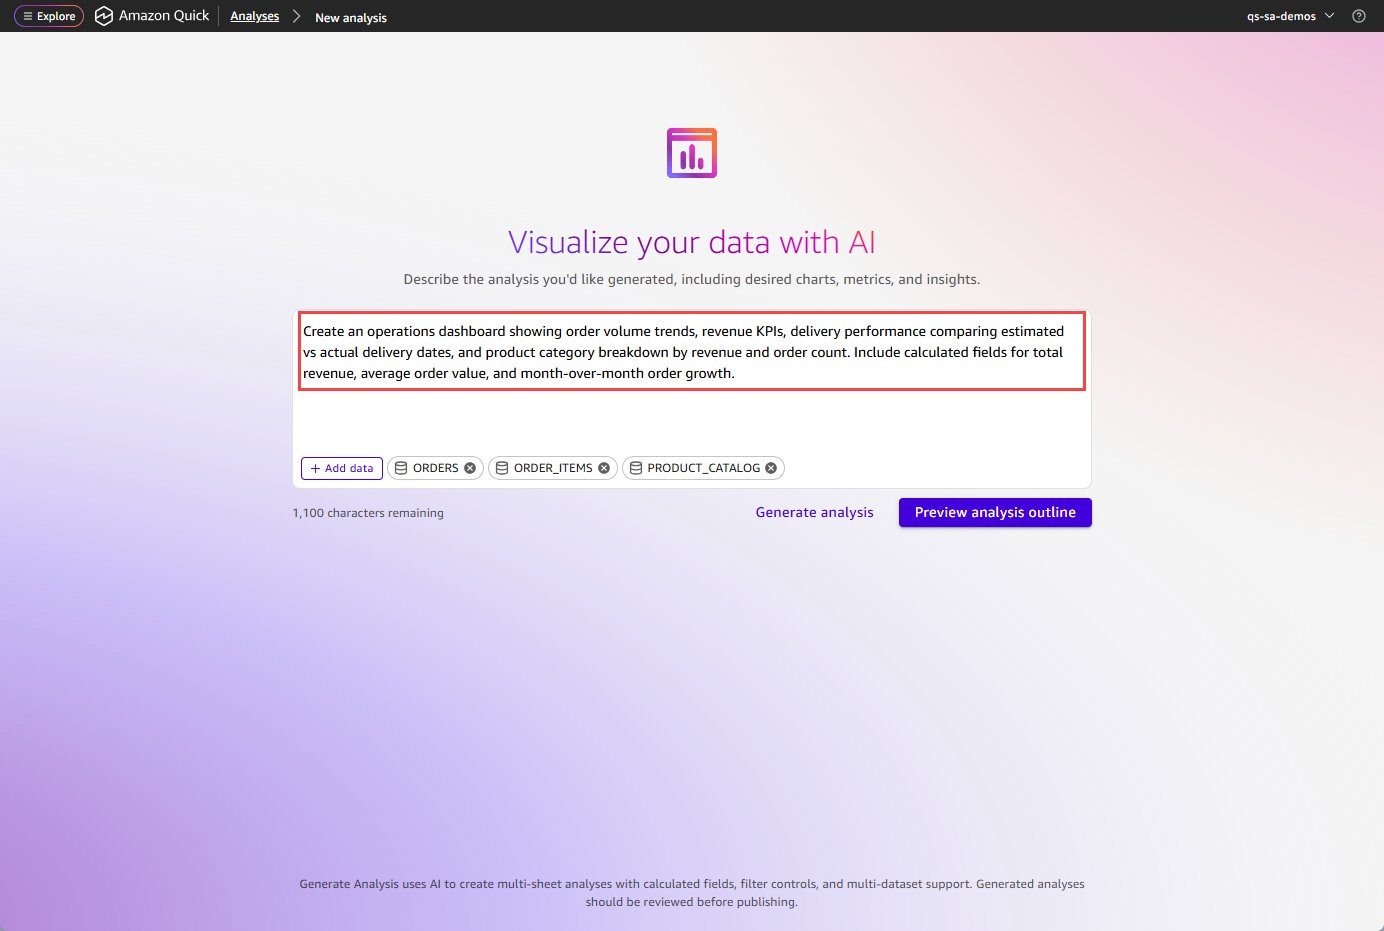
Analysis で作成したいインサイトについて、自然言語のプロンプトを記述してください。ビジネス上の質問、あなたが重視する指標、そして情報をシート間でどのように整理してほしいかを記述します。例:*「注文数の推移、収益 KPI、推定配送日と実際の配送日の比較による配送パフォーマンス、および収益と注文数に基づく製品カテゴリ別の内訳を示す運用ダッシュボードを作成してください。総収益、平均注文額、前月比注文成長率の計算フィールドを含めてください。」*
Amazon Quick がデータを分析します
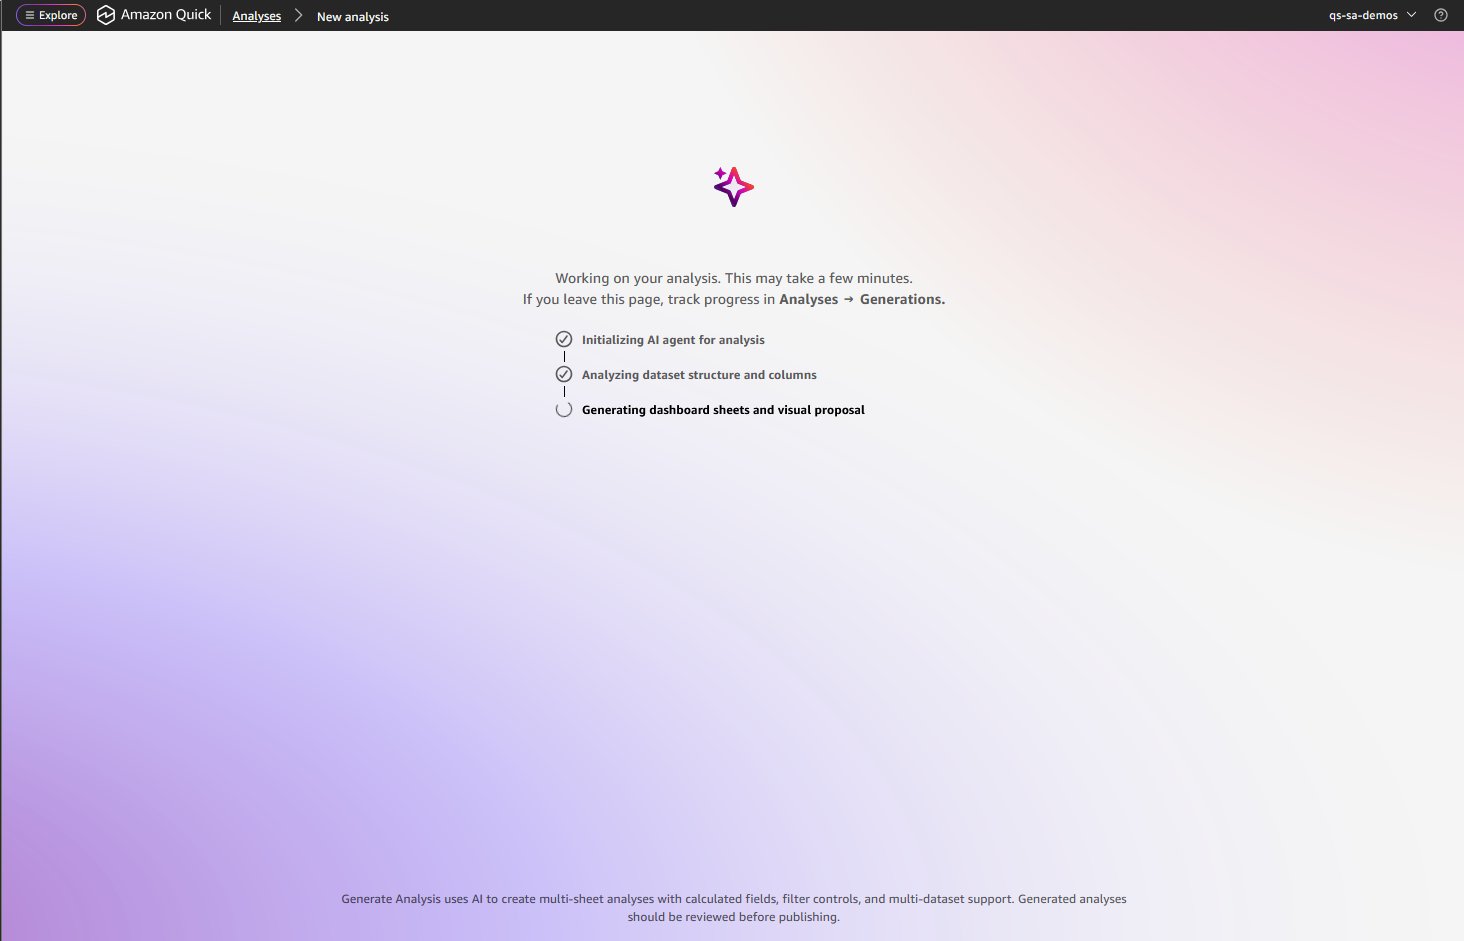
Amazon Quick は、データセットの構造と列の統計情報を精査します。処理が進むにつれて、リアルタイムで進捗状況が更新されます:データセットの列の分析、列の統計情報の分析、分析プランの作成。
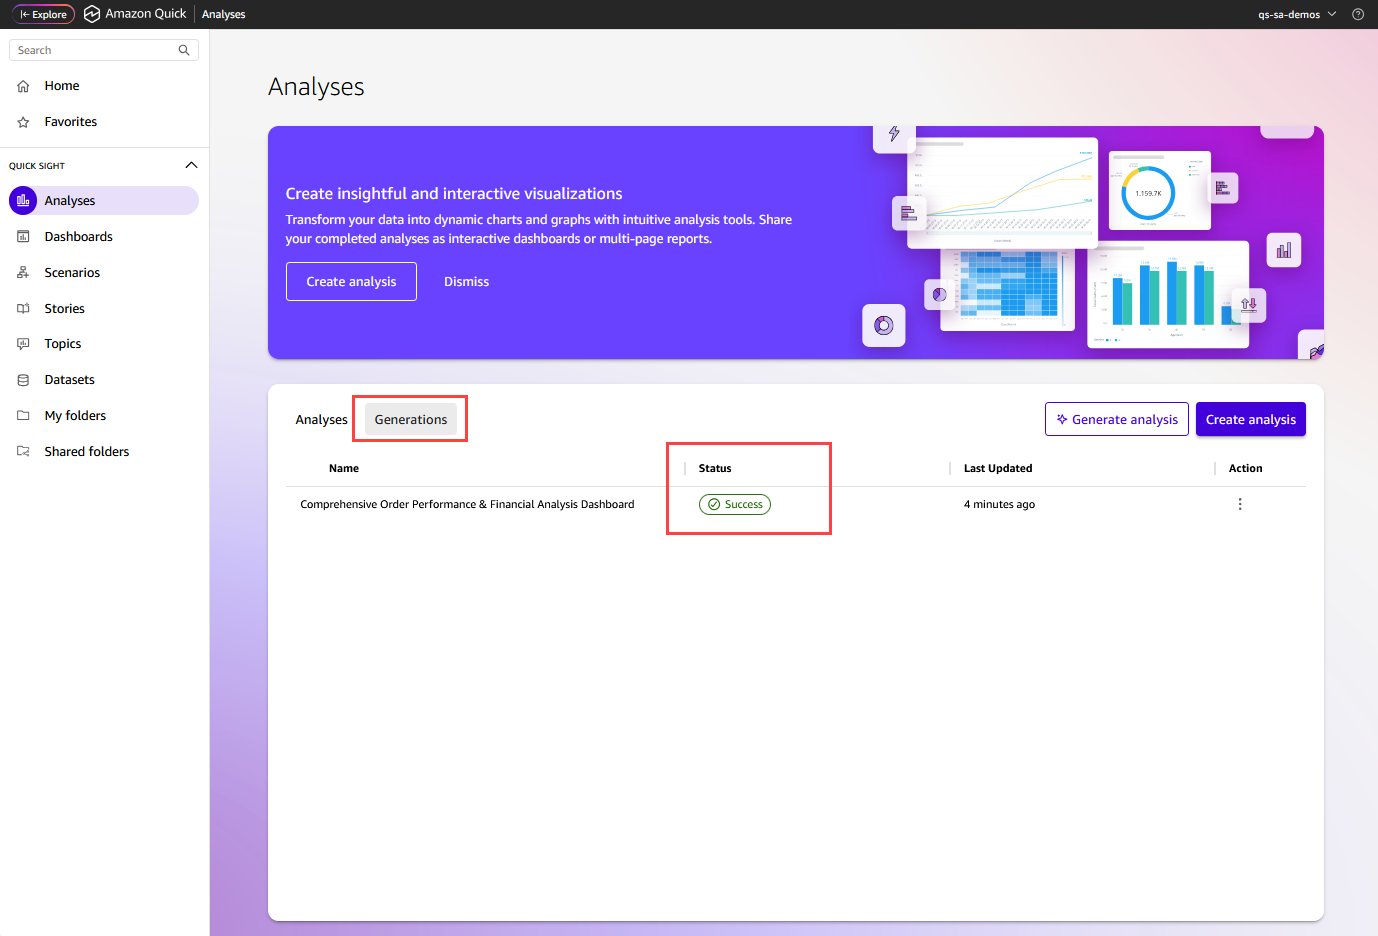
もしその間に他の画面へ移動してしまった場合は、分析 → 生成 (Analyses → Generations) タブにアクセスしてステータスを確認し、進捗画面に戻ることができます。
プランのレビューと編集
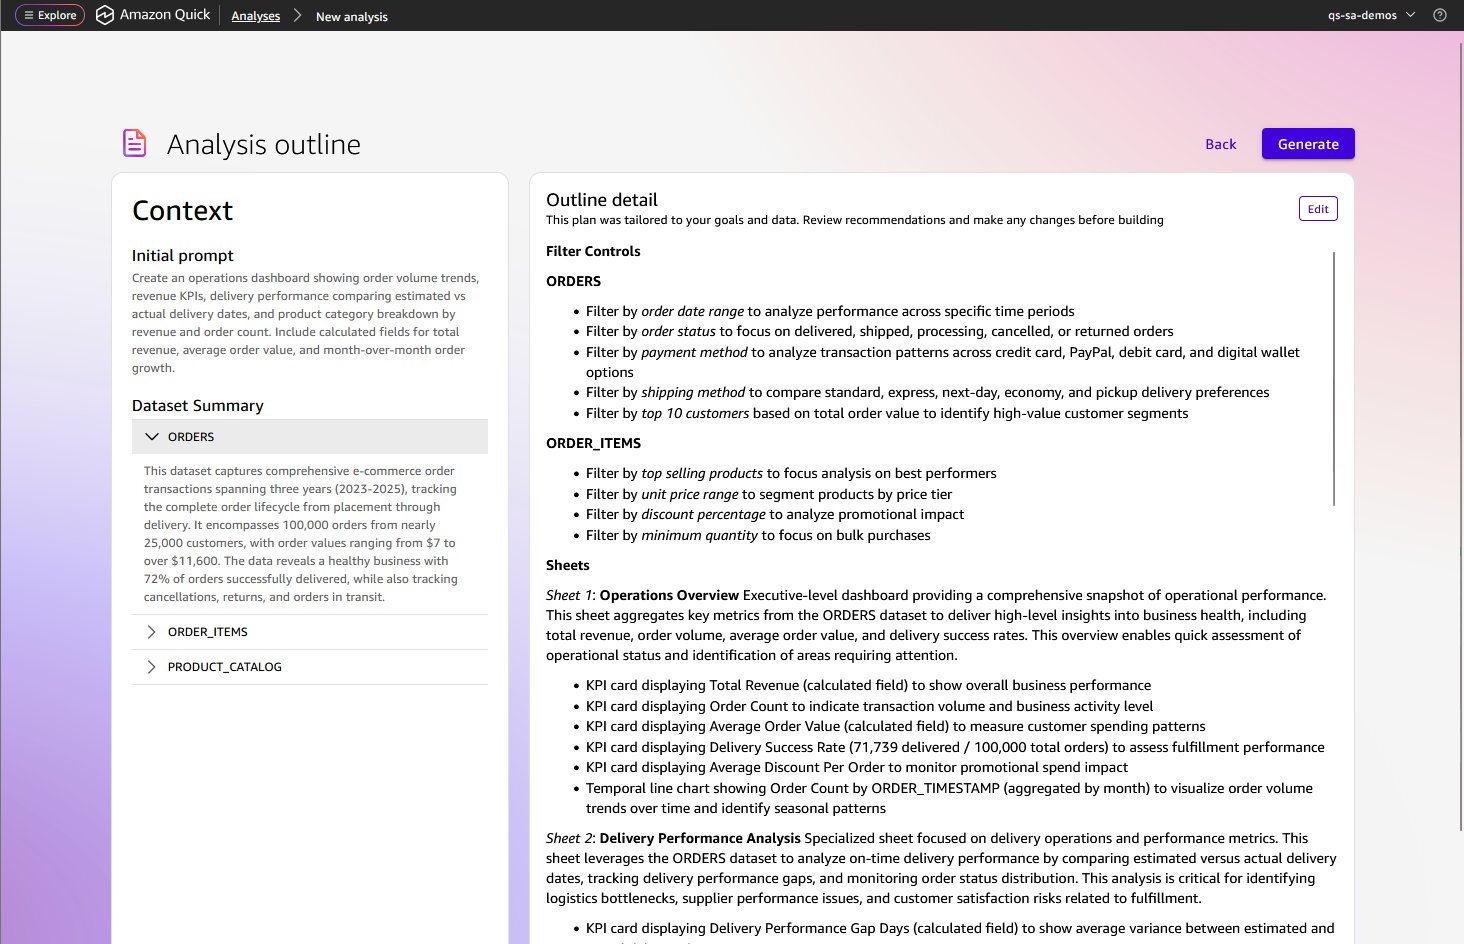
Amazon Quick は、分析プランを 2 つのパネル表示で提示します。左側のパネルには、最初のプロンプトと選択されたデータセットの要約が表示されます。右側のパネルには、提案された構造(フィルターコントロール、シート、各シートのビジュアル)が表示されます。すぐに生成することもできますが、まずは編集を選択してプランを洗練させることも可能です — シート名の調整、ビジュアルの追加または削除、レイアウトの再編成などを行います。
分析の生成
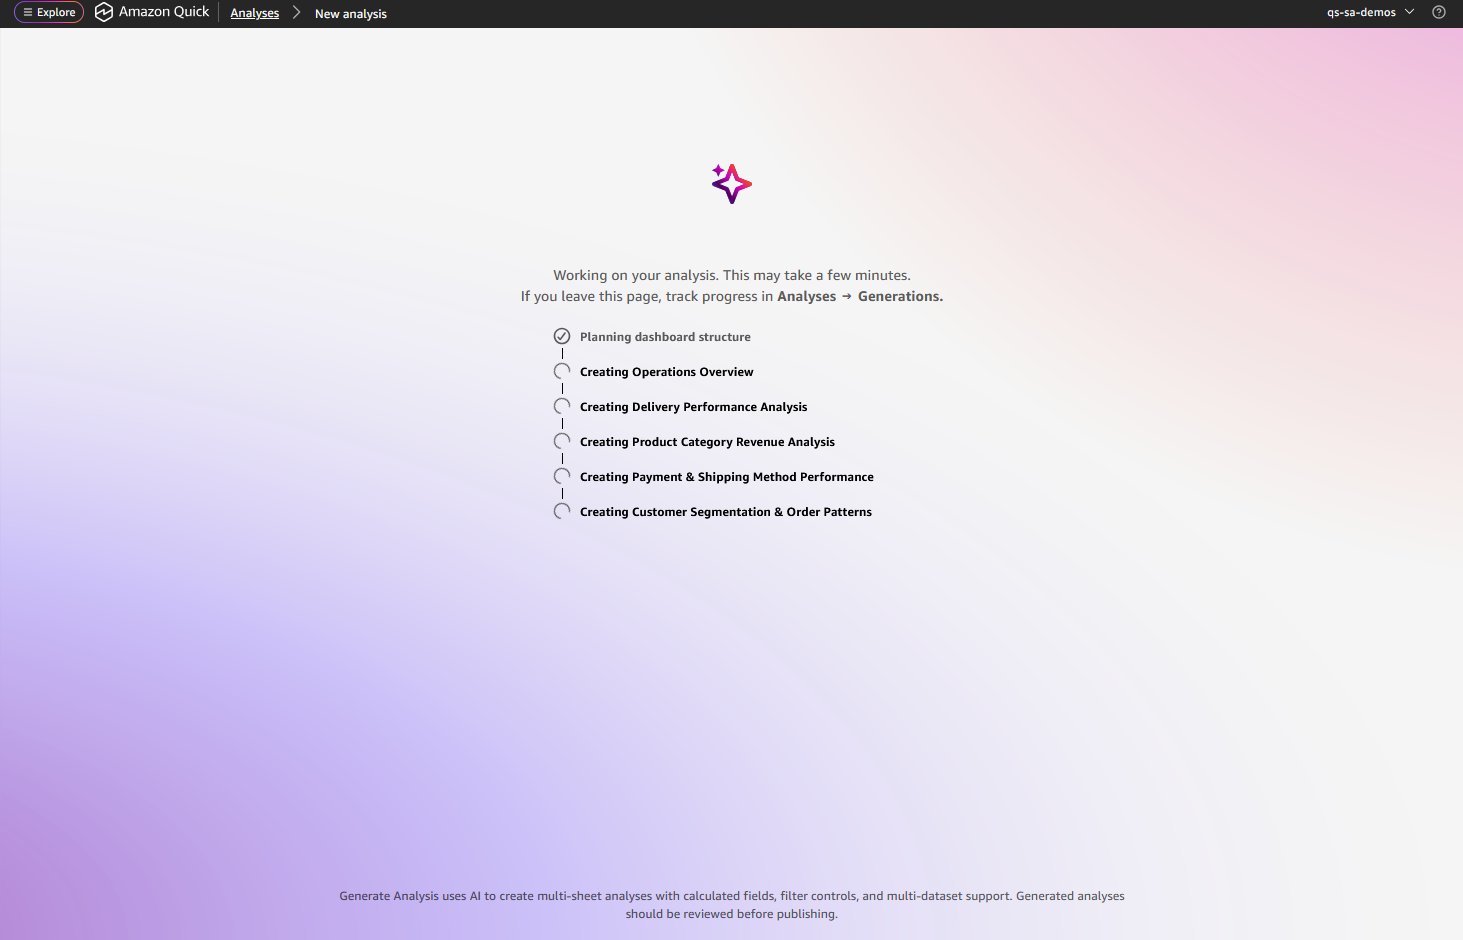
生成を選択します。リアルタイムの進行状況更新により、計算フィールド、フィルター、各シートが順次作成される様子が表示されます。
運用、エンジニアリング、データサイエンス分野の早期アクセス参加者たちは、この機能により大幅な時間の節約が可能になったと評価しています。以前は手動設定に数時間を要していた作業が、ガイド付き生成によって数分で完了するようになりました。
早期アクセス期間中、AI 分析をこれまで一度も使用したことがない著者が、最初のデータセットでこの機能をテストしました:*「結果は素晴らしいです。AI が分析を実行しダッシュボードを作成するまでの時間と、人間がそれを行う時間の比較には比べ物になりません。」* — Jeff Sondic 氏(GES Ops Construction, Amazon, Ontario Canada のプレコンストラクションマネージャー)
出力結果は、ネイティブな Quick 分析です。既存のパブリッシングワークフロー、埋め込みパターン、継続的インテグレーションおよび継続的デリバリー(CI/CD)パイプライン、Analysis サーフェスにおけるポイント&クリック編集と連携します。生成された後でも、すべてのビジュアルを微調整できます。これは静的な画像ではなく、データに接続されたライブでインタラクティブな分析です。
ダッシュボードとしてパブリッシュして共有する
分析内容に満足したら、Publish(パブリッシュ)を選択してダッシュボードを作成します。作成したダッシュボードは他のユーザーと共有したり、1 クリック埋め込みなどの機能を使って数分以内にアプリケーション内に埋め込んだり、メール配信をスケジュール設定したりできます。パブリッシュされたダッシュボードには、生成された分析からすべてのシート、ビジュアル、フィルターコントロール、計算フィールドがすべて保持されます。受信者は、基盤となる分析へのアクセス権限を持たずにダッシュボードと対話することができます。
はじめに
ローンチ時点では、Generate Analysis は Enterprise サブスクリプション/Author Pro ユーザー向けに利用可能です。Amazon Quick Enterprise の一部として、組織がアクセスを制限していない限り、著者らは 2026 年 12 月までこの機能へのプロモーションアクセス権を有しています。利用可能な AWS リージョンは以下の通りです:US East (N. Virginia)、US West (Oregon)、Asia Pacific (Sydney)、Asia Pacific (Tokyo)、Europe (Frankfurt)、Europe (Ireland)、および Europe (London)。
結論
Amazon Quick の Generate Analysis は、自然言語のプロンプトから完全な複数シート分析を生成し、ダッシュボード作成にかかる時間を数時間から数分に短縮します。早期アクセス期間中、運用、エンジニアリング、データサイエンス分野の著者らは、ダッシュボード作成時間を 90% 以上削減したと報告しています。
ある著者は次のように述べています:*「新規ユーザーとしてこのダッシュボードを作成するには、少なくとも丸一日かかったでしょう。実際には 5 分で完了しました。」* — Prabhakant Rasal、SDE-III、PXT DLS Tech、Amazon、Dallas TX
AI がスタート地点を構築します。著者はそれを洗練させ、ダッシュボードとして公開します。ダッシュボードは、チームが繰り返し回答する必要がある質問をエンコードしたものです。その間のフォローアップ調査や一時的な質問については、Dataset Q&A を使用して自然言語で直接データを照会してみてください。
執筆者について

Sindhu Chandra
Sindhu Chandra は、AWS のシニア・テックプロダクトマーケティングマネージャーとして、Amazon Quick の市場投入戦略を主導しています。アマゾン、ウーバー、グーグルで 15 年以上にわたり活動し、技術マーケティングを実際の顧客価値に基づき、親しみやすく、包括的なものにすることに情熱を注いでいます。仕事以外では、愛犬と遊んだり、さまざまな産地のコーヒーを淹れることを楽しんでいます。

Rushabh Vora
Rushabh Vora は、Amazon Web Services の Amazon Quick におけるシニアプロダクトマネージャーで、データ分析および可視化のための生成 AI(Generative AI)機能を主導しています。Rushabh は、自然言語を通じて生データを行動可能なインサイトへ変換し、データから意思決定までの時間を数時間から数分に短縮することを組織に可能にすることに注力しています。技術的な専門知識の有無にかかわらず、すべてのビジネスユーザーがデータの探索やダッシュボード作成にアクセスできるようにすることに対して情熱を持っています。

Salim Khan
Salim Khan は、AWS の Amazon Quick におけるシニア・グローバル生成 AI ソリューションアーキテクトです。彼は企業向けビジネスインテリジェンス(BI)ソリューションの実装において、16 年以上の経験を持っています。AWS では、Salim は世界中の顧客と協力し、Amazon Quick 上で AI を活用した BI および生成 AI の機能を設計・実装しています。AWS 以前には、自動車、ヘルスケア、エンターテインメント、消費財、出版、金融サービスなど様々な業界で BI コンサルタントとして働き、ビジネスインテリジェンス、データウェアハウス、データ統合、マスターデータ管理のソリューションを提供してきました。
原文を表示
Building meaningful dashboards demands hours of manual setup, even for experienced BI professionals. Amazon Quick now generates complete multi-sheet dashboards from natural language prompts, taking you from one or more datasets to a production-ready analysis in minutes. Data analysts building recurring operations reports, program managers preparing a leadership review, or engineers exploring a new dataset can describe what they want, and Amazon Quick produces *multiple organized sheets* with visuals selected for your data, *filter controls* for stakeholders to explore by different dimensions, and *calculated fields* such as year-over-year growth and month-over-month comparisons. Before generating, you review and edit an *interactive plan* of the proposed structure, keeping you in control of the final output.
In Amazon Quick, Analysis is the authoring surface where you build and arrange visuals, filters, and calculated fields across multiple sheets. When you’re ready to share, you publish the analysis as a dashboard. This new generative AI capability creates the analysis and you refine and publish it as a dashboard with a single click.
In this post, we walk through generating an analysis from a prompt, reviewing the plan, and exploring the completed output.
Prerequisites
You need the following prerequisites:
- An AWS account
- An Amazon Quick Enterprise Edition subscription
How it works
To generate an analysis, start by selecting the data that you want to analyze. In Amazon Quick, your data is stored in datasets, which connect to sources such as Amazon Redshift, Amazon Simple Storage Service (Amazon S3), or uploaded files. With your dataset ready, you describe what you want to see, review a plan, and generate.
Select your datasets
Open a dataset in Amazon Quick and choose Generate analysis. You can also start from the Analyses page. Select 1–3 datasets for the analysis. If your data spans multiple tables—orders in one dataset and products in another—you can select them together.
Choose Add data to add more datasets if required.
Describe what you want in the analysis / dashboard
Write a natural language prompt describing the insights you want to author in the Analysis. Describe the business questions, the metrics that you care about, and how you want the information organized across sheets. For example: *“Create an operations dashboard showing order volume trends, revenue KPIs, delivery performance comparing estimated vs actual delivery dates, and product category breakdown by revenue and order count. Include calculated fields for total revenue, average order value, and month-over-month order growth.”*
Amazon Quick analyzes your data
Amazon Quick examines your dataset structure and column statistics. You see real-time progress updates as it works: analyzing dataset columns, analyzing column statistics, creating the analysis plan.
If you navigate away, use the Analyses → Generations tab to check status and return to the progress screen.
Review and edit the plan
Amazon Quick presents the Analysis outline in a two-pane view. The left pane shows your initial prompt and a summary of the selected datasets. The right pane shows the proposed structure: filter controls, sheets, and the visuals planned for each sheet. You can generate immediately or choose Edit to refine the plan first — adjusting sheet names, adding or removing visuals, or reorganizing the layout.
Generate the analysis
Choose Generate. Real-time progress updates show each component being created: calculated fields, filters, and each sheet sequentially.
Early access authors across operations, engineering, and data science found this capability a significant time saver, turning what previously took hours of manual configuration into minutes of guided generation.
During early access, an author who had never used AI analytics before tested the feature with his first dataset: *“The results are awesome and there is no comparison in the time it takes AI to perform analysis and create dashboards vs. a human being.”* — Jeff Sondic, Pre-Construction Manager, GES Ops Construction, Amazon, Ontario Canada
The output is a native Quick analysis. It works with existing publishing workflows, embedding patterns, continuous integration and continuous delivery (CI/CD) pipelines, and point-and-click editing in the Analysis surface. You can refine every visual after generation. This isn’t a static image. It’s a live, interactive analysis connected to your data.
Publish and share as a dashboard
When you’re satisfied with the analysis, choose Publish to create a dashboard. You can share the dashboard with other users, embed it in applications within minutes with features like 1-click embedding, or schedule email deliveries. The published dashboard retains all the sheets, visuals, filter controls, and calculated fields from the generated analysis. Recipients interact with the dashboard without access to the underlying analysis.
Getting started
At launch, Generate Analysis is available to Enterprise subscription/Author Pro users. Authors also have promotional access to this capability through December 2026 as part of Amazon Quick Enterprise, provided their organization has not restricted access. Available in the following AWS Regions: US East (N. Virginia), US West (Oregon), Asia Pacific (Sydney), Asia Pacific (Tokyo), Europe (Frankfurt), Europe (Ireland), and Europe (London).
Conclusion
Generate Analysis in Amazon Quick creates complete multi-sheet analyses from natural language prompts, reducing dashboard creation from hours to minutes. During early access, authors across operations, engineering, and data science reported reducing their dashboard creation time by 90% or more.
One author said: *“As a new user, creating this dashboard would have taken at least a full day. It took 5 minutes.”* — Prabhakant Rasal, SDE-III, PXT DLS Tech, Amazon, Dallas TX
AI builds your starting point. You refine and publish it as a dashboard. Dashboards encode the questions your team needs to answer repeatedly. For the follow-up explorations and one-off questions that arise in between, try Dataset Q&A to query your data directly in natural language.
About the authors
Sindhu Chandra
Sindhu Chandra is a Senior Tech Product Marketing Manager at AWS, leading go-to-market strategy for Amazon Quick. With 15+ years across Amazon, Uber, and Google, she’s passionate about making tech marketing relatable, inclusive, and grounded in real customer value. Outside work, she enjoys playing with her dog, and brewing coffee from different origins.
Rushabh Vora
Rushabh Vora is a Principal Product Manager for Amazon Quick at Amazon Web Services, where he leads generative AI capabilities for data analysis and visualization. Rushabh focuses on enabling organizations to transform raw datasets into actionable insights through natural language, reducing the time from data to decision from hours to minutes. He is passionate about making data exploration and dashboard creation accessible to every business user, regardless of technical expertise.
Salim Khan
Salim Khan is a Senior Worldwide Generative AI Solutions Architect for Amazon Quick at AWS. He has over 16 years of experience implementing enterprise business intelligence solutions. At AWS, Salim works with customers globally to design and implement AI-powered BI and generative AI capabilities on Amazon Quick. Prior to AWS, he worked as a BI consultant across industry verticals including Automotive, Healthcare, Entertainment, Consumer, Publishing, and Financial Services, delivering business intelligence, data warehousing, data integration, and master data management solutions.
関連記事
今日のまとめ
AI日報で今日の重要ニュースをまとめ読み