Amazon Bedrock AgentCore、オンプレミス・マルチクラウド AI エージェントの監視
本文の状態
日本語全文を表示中
詳細モードで約13分の本文を読めます。
同じ出来事の情報源
この情報源を基点に整理
AWS Machine Learning Blog
AWS は Amazon Bedrock AgentCore Observability の拡張機能を発表し、オンプレミスや他クラウド環境で動作する AI エージェントの可視化を可能にする設定手順と ADOT の活用方法を詳述した。
Continue in AI NEW LAB
このニュースを、実務の判断につなげる
AI NEW LABで、試したことや先に確認したい条件を共有できます。まずはログインなしで読めます。
AI NEW LABで論点を見るAI深層分析を開く2026年8月14日 01:13
AI深層分析
キーポイント
非 AWS 環境での可視化要件の明確化
Amazon Bedrock AgentCore Observability はネイティブに AWS クラウド上のエージェントのみをサポートしており、オンプレミスや他クラウド(GCP, Azure)で動作するエージェントには追加設定が必要であると明記している。
ADOT を活用した自動計測の実装
AWS Distro for OpenTelemetry (ADOT) をエージェントアプリケーション内で実行し、フレームワークを自動計測して生成 AI のセマンティックなスパンを取得する仕組みが提案されている。
CloudWatch OTLP エンドポイントへの送信
取得したテレメトリデータを SigV4 認証と IAM クレデンシャルを用いて Amazon CloudWatch OpenTelemetry Protocol (OTLP) エンドポイントへ直接転送する構成が示されている。
エンドツーエンドの検証プロセス
非 AWS 環境での設定手順に加え、テレメトリの流れを可視化する図解と共に、セットアップの最終確認方法を段階的に説明している。
クロスプラットフォーム可観測性のアーキテクチャ
Amazon CloudWatch、Amazon Bedrock AgentCore Observability、AWS Distro for OpenTelemetry (ADOT)、IAM を統合し、オンプレミスおよびマルチクラウド環境の AI エージェントのテレメトリを収集・管理する。
重要な引用
Although Amazon Bedrock AgentCore Observability... provides native tracing, monitoring, and analytics that local cloud monitoring tools don't offer out of the box, it natively supports only agents deployed on AgentCore runtime in the AWS Cloud.
The solution uses the AWS Distro for OpenTelemetry (ADOT) running in-process with the agent application.
Observability is a foundational pillar of responsible AI.
This allows you to detect hallucinations, monitor for harmful or off-topic responses, track token usage for cost governance, and audit agent behavior across environments.
編集コメントを表示
編集コメント
AWS は自社の Bedrock エコシステムを拡張し、他クラウドやオンプレミス環境との連携を強化することで、企業におけるハイブリッドな AI エージェント運用の障壁を下げる動きを示している。開発者は既存の監視ツールに依存せず、ADOT を活用して標準的なプロトコルで可視化を実現できるため、アーキテクチャの柔軟性が向上する。
Source Article
元記事を日本語で読む
本文に関係しない購読案内、埋め込み通知、サイト内プロモーションは除いています。
Strands Agents、LangGraph、CrewAI といったフレームワークで構築した AI エージェントをデプロイする際、そのパフォーマンスを可視化する「観測性(observability)」が不可欠です。これは、Amazon Elastic Kubernetes Service (Amazon EKS) や Amazon Elastic Container Service (Amazon ECS)、AWS Lambda 上で動作する場合に限らず、オンプレミス環境や Google Cloud Platform (GCP)、Microsoft Azure といった他クラウドプロバイダーを利用している場合にも同じことが言えます。
Amazon Bedrock AgentCore は、あらゆるフレームワークやモデルに対応し、大規模なエージェントの構築・接続・最適化を可能にするプラットフォームです。同社の機能である Amazon Bedrock AgentCore Observability には、一般的なクラウド監視ツールでは標準で提供されていない独自のアプローチによるトレーシング、モニタリング、分析機能が備わっています。ただし、この機能をネイティブにサポートするのは AWS クラウド上で AgentCore ランタイム上にデプロイされたエージェントに限られます。
もしエージェントがそれ以外の場所で動作している場合、ダッシュボードへテレメトリデータを送信するための追加設定が必要です。本記事では、AWS 外で稼働するエージェントの観測性をセットアップする方法をご紹介します。具体的には、非 AWS 環境における AWS Distro for OpenTelemetry (ADOT) の自動インストルメンテーションの設定方法や、テレメトリを AgentCore Observability ダッシュボードへルーティングする方法、そして設定が正しく機能しているかエンドツーエンドで検証する手順について解説します。
以下の図は、エンドツーエンドの観測パイプラインと、エージェントから AgentCore Observability ダッシュボードへテレメトリが流れる仕組みを示しています。
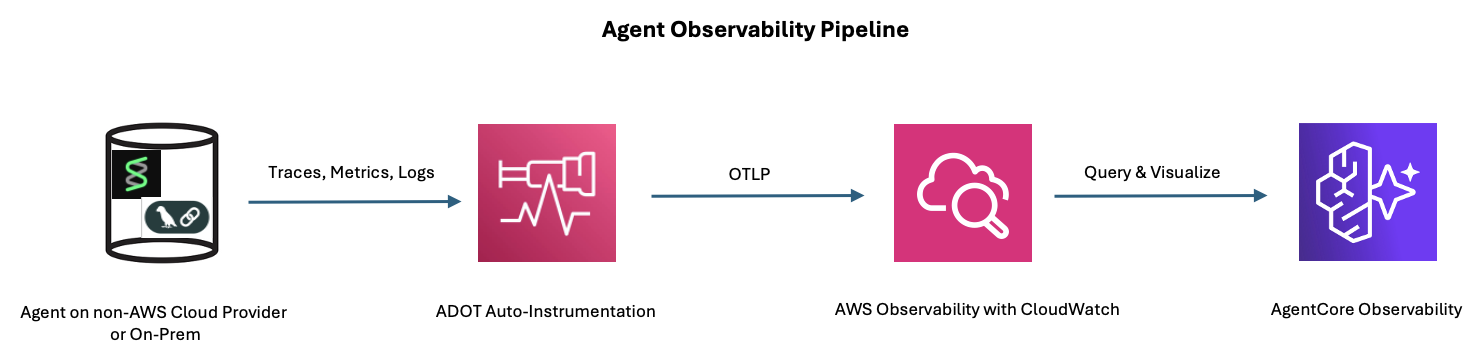
図 1: エージェントから AgentCore Observability ダッシュボードまでのエンドツーエンド観測パイプライン
ソリューションの概要
本ソリューションでは、エージェントアプリケーション内で動作する AWS Distro for OpenTelemetry (ADOT) を活用します。ADOT はエージェントフレームワークを自動的にインストルメントし、生成 AI のセマンティック規約に基づくスパンを取得した後、AWS Identity and Access Management (IAM) 認証情報を用いた SigV4 認証で Amazon CloudWatch OpenTelemetry Protocol (OTLP) エンドポイントへ直接テレメトリをエクスポートします。
AI エージェントから Amazon Bedrock AgentCore Observability へテレメトリを送信するには、以下の 3 つの主要コンポーネントが必要です。
- ADOT の自動インストルメント: AWS Distro for OpenTelemetry が、AWS 環境外からのテレメトリエクスポートに伴う複雑な処理を担います。
- IAM クレデンシャル: ADOT はこれらのアクセスキーを使用して CloudWatch と認証し、エージェントのテレメトリ(トレース、メトリクス、ログ)を AgentCore Observability ダッシュボードへ転送します。
- 環境変数: ルーティングと認証に関連する特定の OpenTelemetry 設定が含まれています。
以下の図に示すように、このクロスプラットフォーム型観測ソリューションは複数の AWS サービスを統合しています。基盤となるのは Amazon CloudWatch で、テレメトリの取り込みと保存を担当します。Amazon Bedrock AgentCore Observability は AI エージェント向けの専門的な監視ダッシュボードを追加し、AWS Distro for OpenTelemetry (ADOT) がクロスプラットフォームでの計測機能を担います。また、IAM により外部環境と AWS の間の認証を保護します。
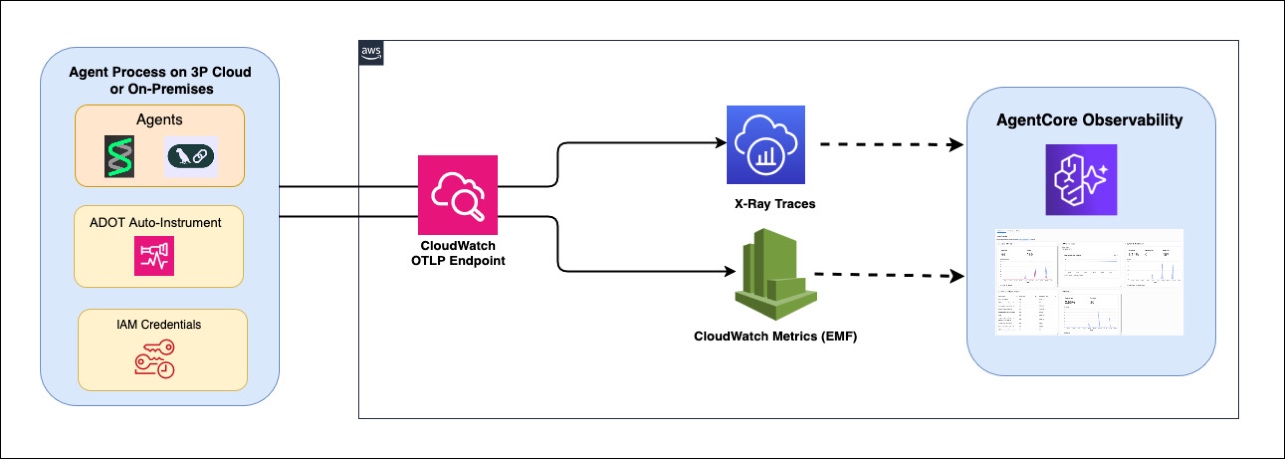
図 2: Amazon CloudWatch、Amazon Bedrock AgentCore Observability、ADOT、AWS IAM を統合したクロスプラットフォーム型観測アーキテクチャ
責任ある AI の実現には、観測性が不可欠な柱です。テレメトリを AgentCore Observability にルーティングすることで、エージェントの推論連鎖やツール呼び出し、モデル出力を可視化できます。これにより、ハルシネーション(幻覚)の検出、有害または無関係な回答の監視、コスト管理のためのトークン使用量の追跡、および環境横断的なエージェント行動の監査が可能になります。これは特に AWS 外で動作するエージェントにおいて重要で、中央集権型の観測機能がないと問題のある出力を見逃すリスクが高まります。
前提条件
開始前に、以下の項目が準備されていることを確認してください:
AWS アカウントを用意し、Amazon Bedrock のモデルアクセス権限を設定してください(本チュートリアルでは Claude Haiku を使用します)。利用可能なモデルは AWS リージョンによって異なりますので、AWS リージョン別のサポート対象モデル をご確認ください。
AgentCore Observability の設定と、対象となるロググループが必要です。
アカウントで CloudWatch Transaction Search がオンになっていることを確認してください(初回のみセットアップが必要)。
非 AWS 環境に Python 3.10 以降がインストールされている必要があります。
IAM ユーザーの認証情報(アクセスキー ID とシークレットアクセスキー)には、以下の権限が必要です。
bedrock:InvokeModel
logs:CreateLogGroup、logs:CreateLogStream、logs:PutLogEvents
・xray:PutTraceSegments、xray:PutTelemetryRecords、xray:GetSamplingRules、および xray:GetSamplingTargets
・cloudwatch:PutMetricData
環境から AWS エンドポイントへのアウトバウンド HTTPS アクセスが必要です。
CloudWatch トランザクション検索を有効にする
まだトランザクション検索を有効にしていない場合は、以下のコマンドを実行してください(アカウントごとに一度限り)。
aws xray update-trace-segment-destination --destination CloudWatchLogs --region us-east-1有効化を確認するには:
aws xray get-trace-segment-destination --region us-east-1
# Expected: {"Destination": "CloudWatchLogs", "Status": "ACTIVE"}
仕組みについて
ADOT の自動インストルメンテーション(aws-opentelemetry-distro)が、AWS 環境以外の場所から CloudWatch へテレメトリデータをエクスポートする複雑な処理を肩代わりします。
自動インストルメンテーション:opentelemetry-instrument コマンドは、Python ランタイムに ADOT を注入します。これにより、Amazon Bedrock への呼び出しを扱う boto3 や、エージェントの推論スパンを生成する Strands フレームワークが自動的にパッチ適用され、OpenTelemetry のトレースが発行されるようになります。
- SigV4 認証:
aws_configuratorは、boto3の認証チェーンを使用して、OTLP エクスポートリクエストを SigV4 で署名します。
非 AWS 環境では、この機能は AWS_ACCESS_KEY_ID および AWS_SECRET_ACCESS_KEY という環境変数を利用します。
- CloudWatch OTLP エンドポイント: ADOT は、トレースとログを CloudWatch のネイティブな OTLP 取り込みエンドポイントへエクスポートします。
OTEL_EXPORTER_OTLP_LOGS_HEADERSヘッダーにより、ログは特定の AgentCore ロググループに送信されます。これによって、CloudWatch は生成 AI 用観測ダッシュボードの下でデータをインデックス付けます。CloudWatch OTLP エンドポイントの URL がどのように決定され、設定されるかについては、CloudWatch OTLP endpoint をご覧ください。
生成 AI のセマンティック・コベントション:Strands の [otel] パッケージは、エージェントの推論ステップ、ツール呼び出し、トークン使用量を伴うモデル呼び出しなど、OpenTelemetry 生成 AI セマンティック・コベントション(OpenTelemetry generative AI semantic conventions)に準拠してスパンを出力します。
以下の図は、非 AWS 環境から CloudWatch へ ADOT の自動インストゥルメンテーションを通じてテレメトリがエクスポートされる仕組みを示しています。
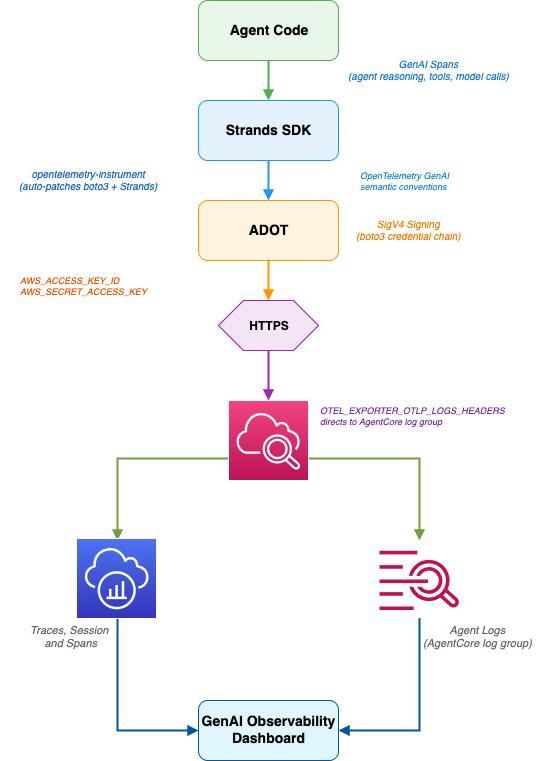
図 3: 非 AWS 環境から CloudWatch へ ADOT 自動インストルメンテーションを介してエクスポートされるテレメトリ
ウォークスルー
AgentCore Observability へテレメトリを転送しながら、非 AWS 環境で Strands エージェントを設定して実行するための手順は以下の通りです。
ステップ 1: 依存関係のインストール
非 AWS 環境(オンプレミスのサーバー、GCP VM、Azure VM、またはインターネットにアクセス可能な計算リソース)で以下を実行してください。
pip install "aws-opentelemetry-distro>=0.10.0" boto3 "strands-agents[otel]"aws-opentelemetry-distro パッケージには、AWS に特化した OTLP エクスポート機能を備えた ADOT 自動インストルメンテーションと、SigV4 認証を処理する aws_configurator が含まれています。また、strands-agents[otel] パッケージは、Strands フレームワークからの OpenTelemetry トレース発行機能を提供します。
ステップ 2: AWS クレデンシャルの設定
IAM ユーザーの認証情報を環境変数として設定してください。
export AWS_ACCESS_KEY_ID=
export AWS_SECRET_ACCESS_KEY=
export AWS_REGION=us-east-1セキュリティ上の注意: 本番環境へのデプロイでは、長期の有効期限を持つアクセスキーを使用するのではなく、IAM Roles Anywhere の利用を検討してください。IAM Roles Anywhere を使用すれば、オンプレミスのワークロードは X.509 証明書を用いて一時的な認証情報を取得できます。
ステップ 3: OpenTelemetry 環境変数の設定
これらの環境変数は、ADOT を AgentCore Observability のダッシュボードへテレメトリを送信するように設定 するためのものです。
export AGENT_OBSERVABILITY_ENABLED=true
export OTEL_PYTHON_DISTRO=aws_distro
export OTEL_PYTHON_CONFIGURATOR=aws_configurator
export OTEL_RESOURCE_ATTRIBUTES="service.name=my-external-agent,aws.log.group.names=/aws/bedrock-agentcore/runtimes/my-external-agent"
export OTEL_EXPORTER_OTLP_LOGS_HEADERS="x-aws-log-group=/aws/bedrock-agentcore/runtimes/my-external-agent,x-aws-log-stream=runtime-logs,x-aws-metric-namespace=bedrock-agentcore"
export OTEL_EXPORTER_OTLP_PROTOCOL=http/protobuf
export OTEL_TRACES_EXPORTER=otlp
主要な設定の詳細は以下の通りです。
AGENT_OBSERVABILITY_ENABLED=trueを設定すると、ADOT 内で生成 AI に特化したテレメトリ処理が有効になります。OTEL_PYTHON_DISTRO=aws_distroとOTEL_PYTHON_CONFIGURATOR=aws_configuratorを指定すると、AWS 固有の OpenTelemetry 設定が有効化されます。これには、CloudWatch の OTLP エンドポイントに対する SigV4署名も含まれます。
OTEL_RESOURCE_ATTRIBUTESにaws.log.group.namesを設定すると、CloudWatch がテレメトリを AgentCore Observability ダッシュボードの下にインデックスします。これを設定しないと、トレースは汎用的な Amazon CloudWatch Logs へ送られます。
OTEL_EXPORTER_OTLP_LOGS_HEADERS に x-aws-metric-namespace=bedrock-agentcore を設定すると、埋め込みメトリクス形式(embedded metric format)のメトリクスが、正しい CloudWatch ネームスペースに転送されます。
ステップ 4: エージェントアプリケーションを作成する
agent_test.py という名前のファイルを作成し、Strands エージェントを実装します。
#
from strands import Agent
from strands.models.bedrock import BedrockModel
from opentelemetry import baggage
from opentelemetry.context import attach
import time
Configure the Bedrock model
model = BedrockModel(
model_id="us.anthropic.claude-haiku-4-5-20251001-v1:0",
region_name="us-east-1"
)
Create the agent
agent = Agent(
model=model,
system_prompt="You are a helpful travel assistant."
)
Set session ID for AgentCore session tracking
All agent calls after attach() share same session ID for multiple requests/responses
session_id = f"external-session-{int(time.time())}"
ctx = baggage.set_baggage("session.id", session_id)
attach(ctx)
Run the agent
response = agent("What are the top 3 things to do in Tokyo?")
print(response)
ステップ 5: ADOT の自動インストルメンテーションで実行する
opentelemetry-instrument コマンドは、Python プロセスを ADOT でラップし、Amazon Bedrock の呼び出しや Strands フレームワークの操作を自動的にインストルメントします。
opentelemetry-instrument python3.12 agent_test.pyエージェントの応答はターミナルに表示されます。裏側では、ADOT がトレース、スパン、ログを収集し、CloudWatch へエクスポートします。
ステップ 6: AgentCore Observability で確認する
実行から 2〜3 分以内にテレメトリデータが表示されます。Amazon CloudWatch コンソールを開いてください。
- GenAI Observability を選択し、Bedrock AgentCore に移動します。
- Agents タブで
my-external-agentを探してください。 - エージェントを選択すると、セッション、トレース、スパンのメトリクスを確認できます。
以下のスクリーンショットは、AWS 環境外で実行されている Strands エージェント(my-external-agent)からのテレメトリデータを、CloudWatch の AgentCore Observability ダッシュボードから見たものです。
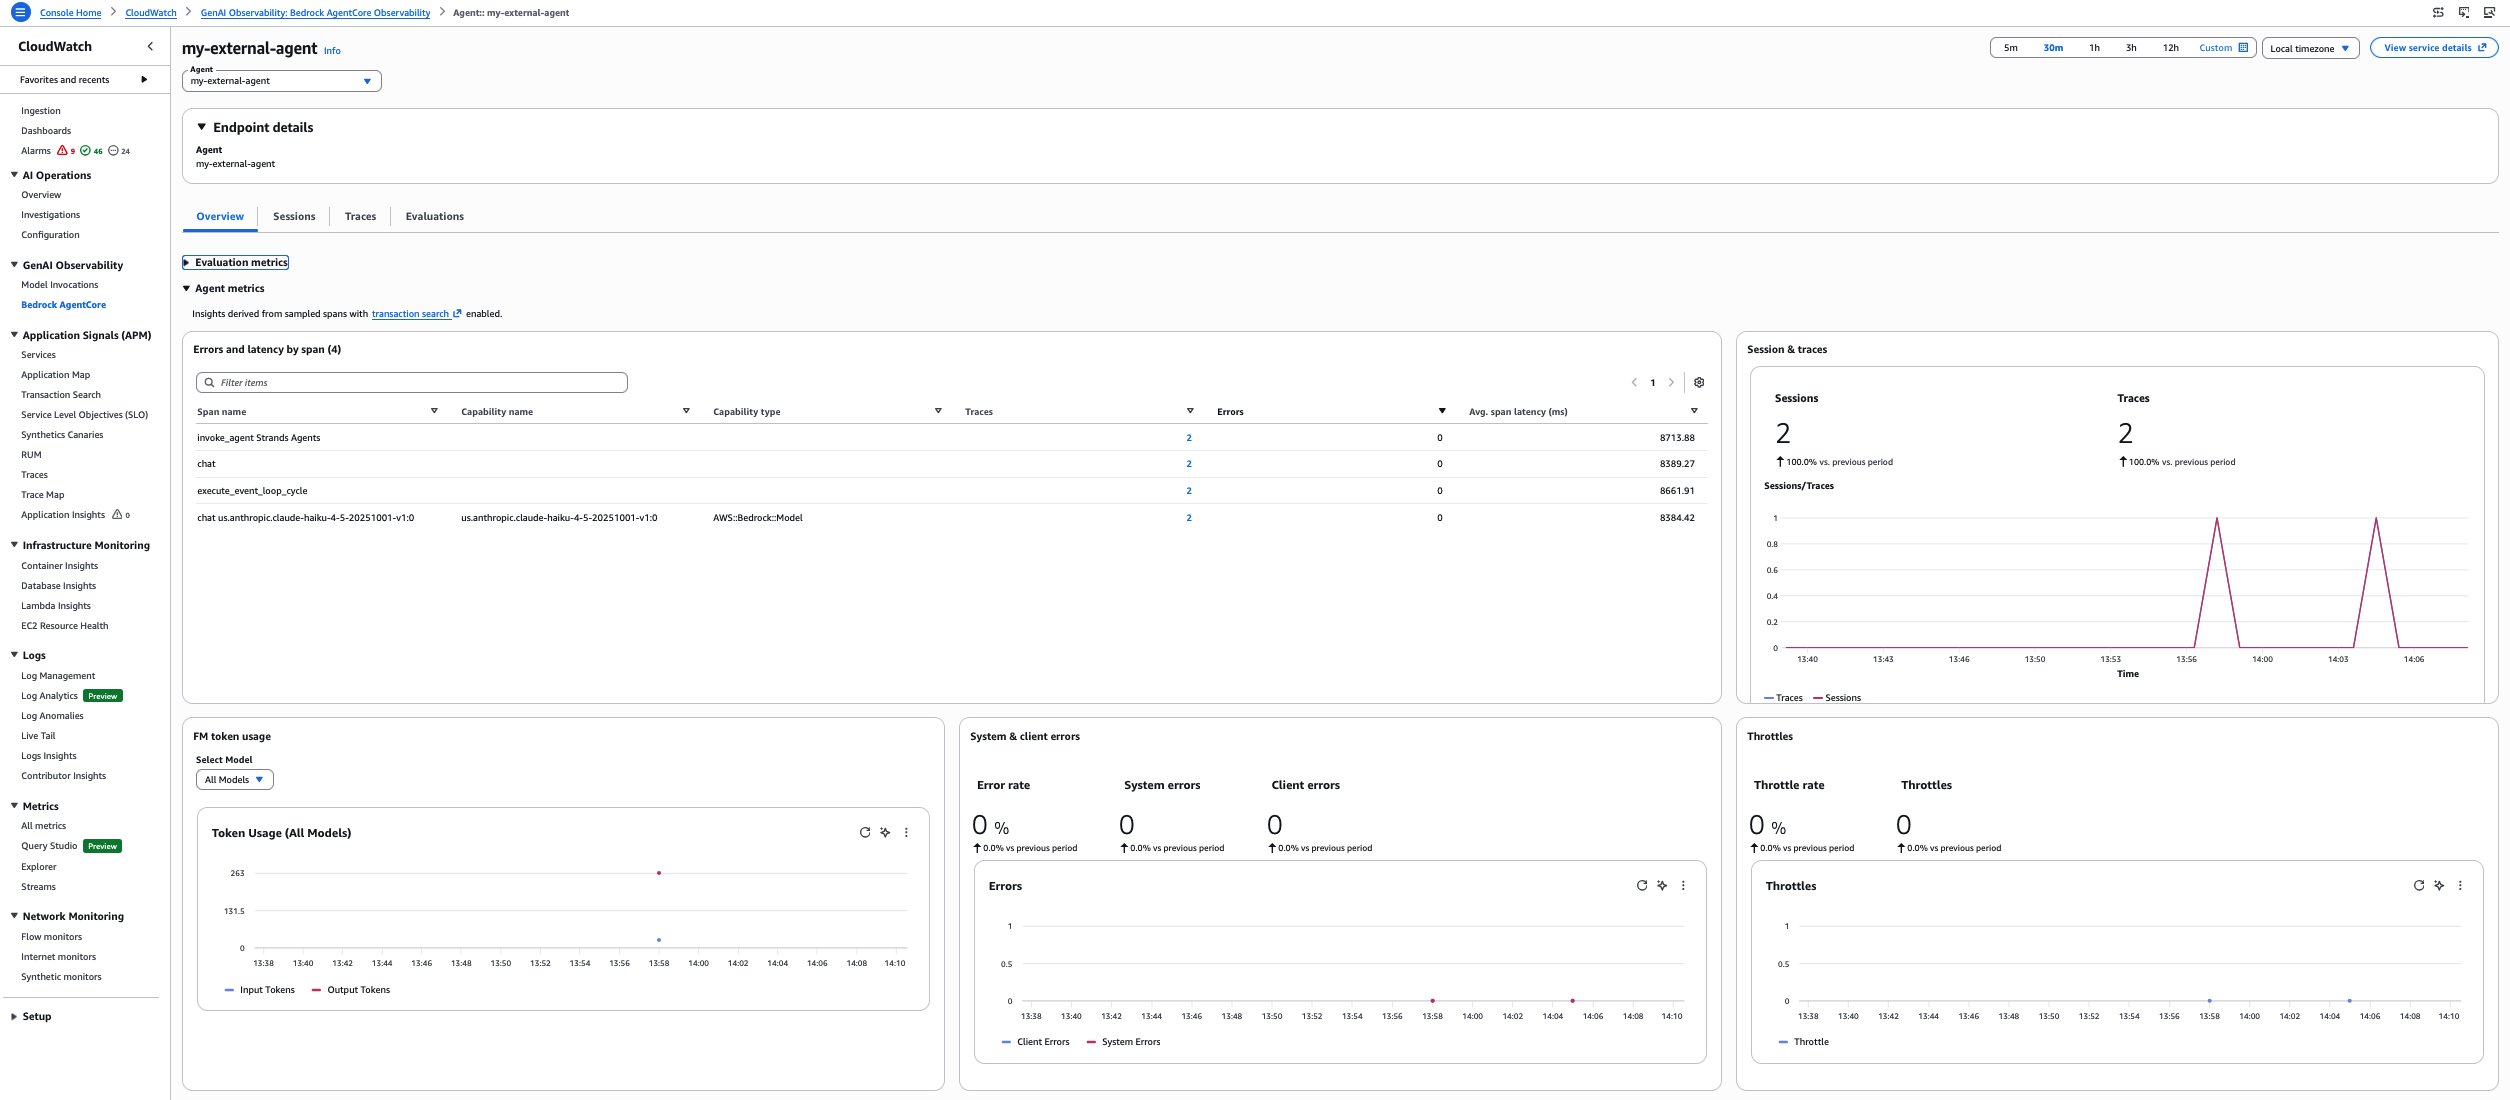
図 4: AgentCore Observability ダッシュボードにおける my-external-agent のテレメトリデータ
コンソールに表示される内容:
- エージェント名:
my-external-agent。
- セッション: 少なくとも 1 つのセッションが存在します。
- トレース: エージェントの推論プロセスと Amazon Bedrock モデルへの呼び出しを示すトレーススパンが含まれます。
- スパンの詳細:
invoke_agent、chat、execute_event_loop_cycle、およびchat.us.anthropic.claude-haikuの各スパンにおけるレイテンシとトークン数のメトリクス。
AgentCore Observability ダッシュボードに表示された、4 つのスパンとモデル情報、レイテンシおよびトークン詳細を含む Strands エージェント(my-external-agent)の成功したトレースのスクリーンショットを以下に示します。
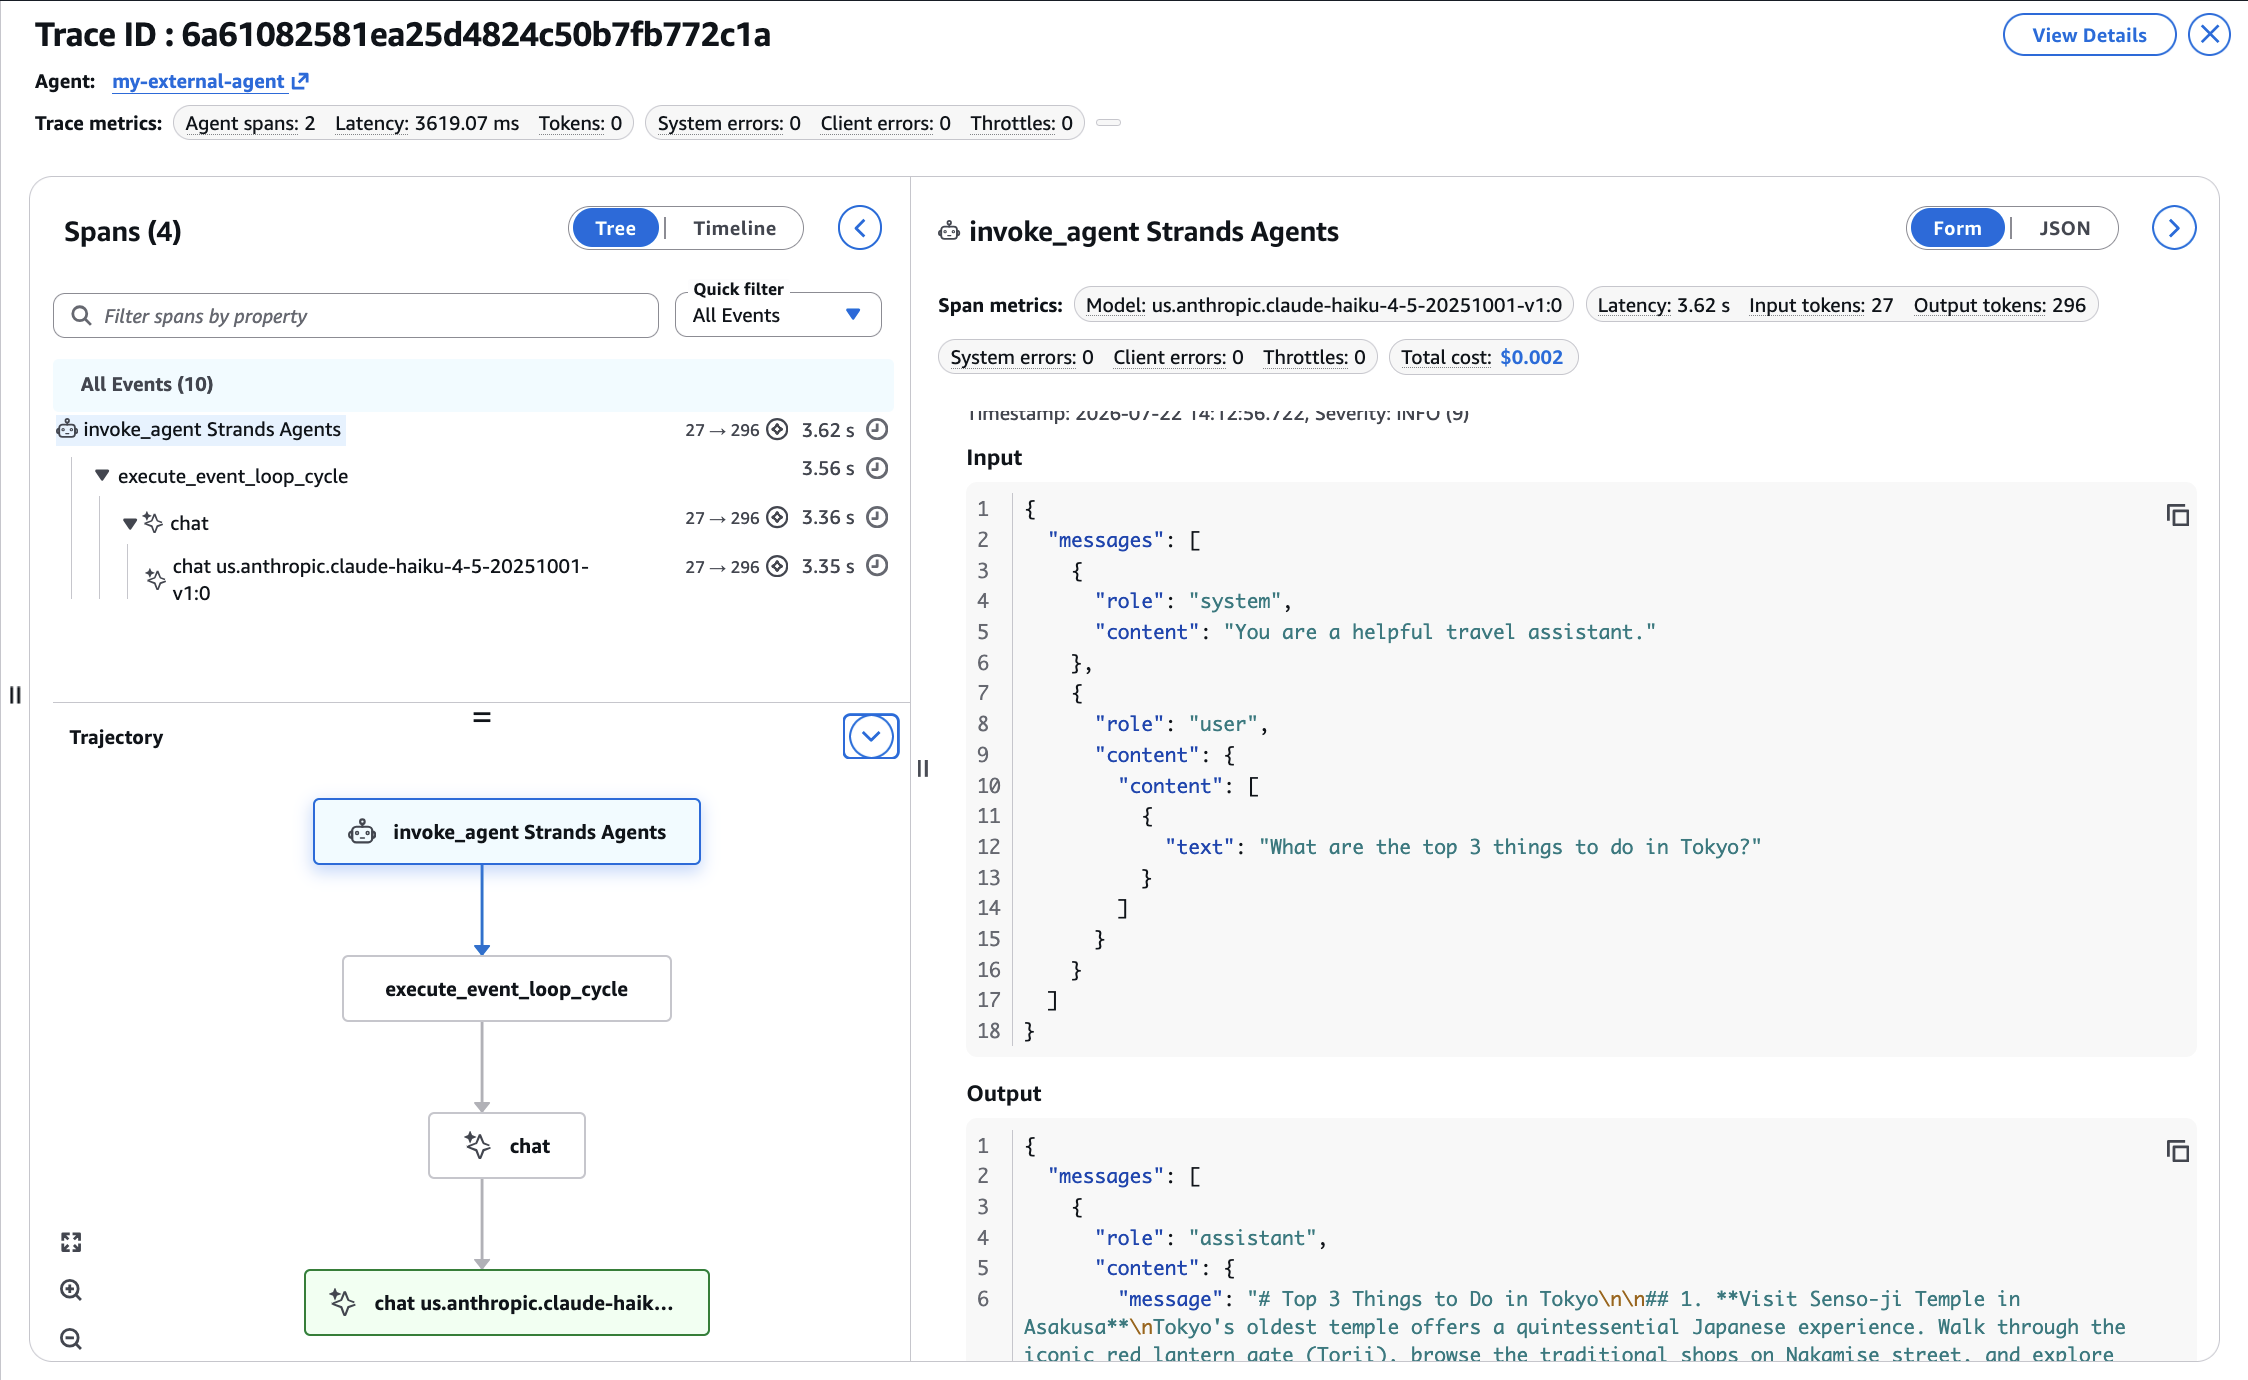
図 5: スパン、レイテンシ、トークンメトリクスを含む my-external-agent のトレース詳細
Google Cloud Platform からの検証
サードパーティのクラウドプロバイダー側でもソリューションが動作していることを確認するため、GCP インフラ上で動作するブラウザベースのターミナルである Google Cloud Shell から同じセットアップでテストを行いました。
Google Cloud Shell での環境構築:
# Create a virtual environment
python3.12 -m venv venv
source venv/bin/activate
# Install dependencies
pip install "aws-opentelemetry-distro" boto3 "strands-agents[otel]"
# Set AWS credentials
export AWS_ACCESS_KEY_ID=
export AWS_SECRET_ACCESS_KEY=
export AWS_REGION=us-east-1
# Set ADOT environment variables
export AGENT_OBSERVABILITY_ENABLED=true
export OTEL_PYTHON_DISTRO=aws_distro
export OTEL_PYTHON_CONFIGURATOR=aws_configurator
export OTEL_RESOURCE_ATTRIBUTES="service.name=gcp-hosted-agent,aws.log.group.names=/aws/bedrock-agentcore/runtimes/gcp-hosted-agent"
export OTEL_EXPORTER_OTLP_LOGS_HEADERS="x-aws-log-group=/aws/bedrock-agentcore/runtimes/gcp-hosted-agent,x-aws-log-stream=runtime-logs,x-aws-metric-namespace=bedrock-agentcore"
export OTEL_EXPORTER_OTLP_PROTOCOL=http/protobuf
export OTEL_TRACES_EXPORTER=otlp
GCP からのエージェント実行:
cat > agent_test.py << 'EOF'
from strands import Agent
from strands.models.bedrock import BedrockModel
from opentelemetry import baggage
from opentelemetry.context import attach
import time

model = BedrockModel(
    model_id="us.anthropic.claude-haiku-4-5-20251001-v1:0",
    region_name="us-east-1"
)
agent = Agent(model=model, system_prompt="You are a helpful assistant.")

# Set session ID for AgentCore session tracking
# All agent calls after attach() share same session ID for multiple requests/responses
session_id = f"gcp-session-{int(time.time())}"
ctx = baggage.set_baggage("session.id", session_id)
attach(ctx)

response = agent("What are the top 3 things to do in Paris?")
print(response)
EOF
opentelemetry-instrument python3.12 agent_test.py
以下のスクリーンショットは、Google Cloud Shell(GCP)上で動作している Strands エージェント(gcp-hosted-agent)が正常なレスポンスを返した様子を示しています。
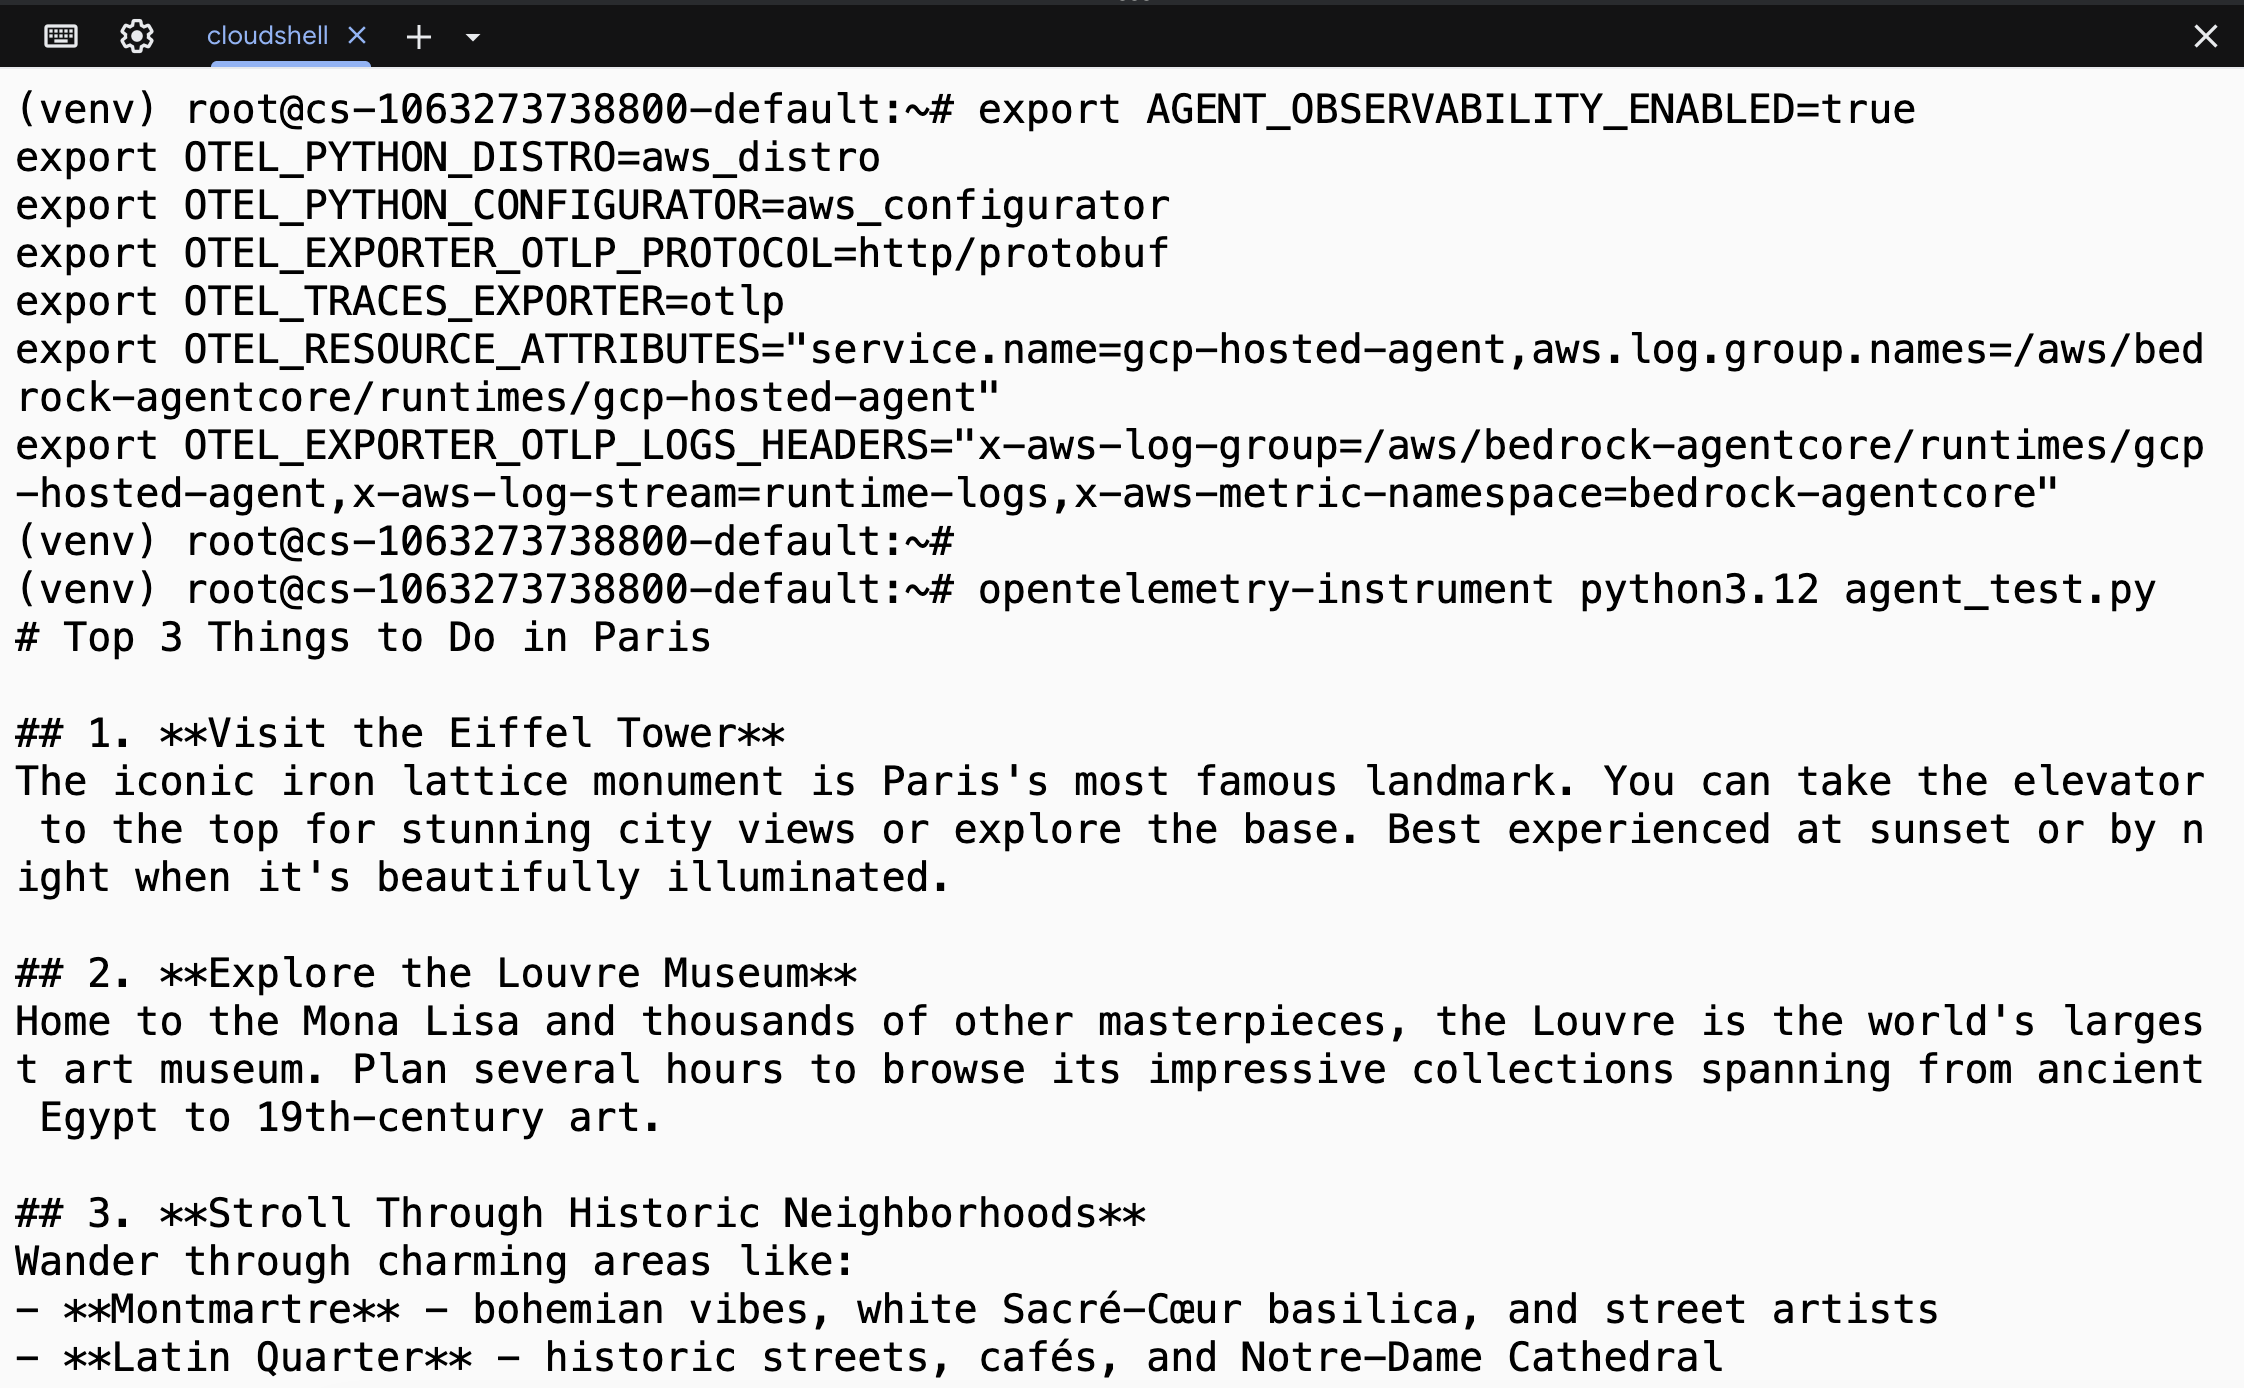
図 6:Google Cloud Shell で実行中の gcp-hosted-agent
クロスクラウドのテレメトリ確認
実行から 2〜3 分後、gcp-hosted-agent は AgentCore ランタイムやその他の環境で動作するエージェントとともに、AgentCore Observability ダッシュボードに表示されます。
以下のスクリーンショットは、GCP で動作している Strands エージェント(gcp-hosted-agent)の正常なトレースを示しています。これは AgentCore Observability ダッシュボード上で確認でき、4 つのスパン、モデル情報、レイテンシ、トークン詳細が含まれています。
原文を表示
When you deploy AI agents built with frameworks like Strands Agents, LangGraph, and CrewAI, you need observability into their performance. This holds true whether they run on Amazon Elastic Kubernetes Service (Amazon EKS), Amazon Elastic Container Service (Amazon ECS), AWS Lambda, on-premises, or another cloud provider such as Google Cloud Platform (GCP) or Microsoft Azure.
Amazon Bedrock AgentCore is a platform to build, connect, and optimize agents at scale, with any framework or model. Although Amazon Bedrock AgentCore Observability, a capability of Amazon Bedrock AgentCore, provides native tracing, monitoring, and analytics that local cloud monitoring tools don’t offer out of the box, it natively supports only agents deployed on AgentCore runtime in the AWS Cloud. If your agents run anywhere else, you need additional configuration to send telemetry to the dashboard.
In this post, we show you how to set up observability for agents running outside AWS. You learn how to configure the AWS Distro for OpenTelemetry (ADOT) auto-instrumentation in non-AWS environments, route telemetry to the AgentCore Observability dashboard, and validate the setup end to end.
The following diagram shows the end-to-end observability pipeline and how telemetry flows from agents to the AgentCore Observability dashboard.
**Figure 1: End-to-end observability pipeline from agents to the AgentCore Observability dashboard
Solution overview
The solution uses the AWS Distro for OpenTelemetry (ADOT) running in-process with the agent application. ADOT auto-instruments the agent framework and captures generative AI semantic convention spans, then exports the telemetry directly to the Amazon CloudWatch OpenTelemetry Protocol (OTLP) endpoint using SigV4 authentication with AWS Identity and Access Management (IAM) credentials.
Sending telemetry from your AI agent to Amazon Bedrock AgentCore Observability requires three core components:
- ADOT auto-instrumentation: The AWS Distro for OpenTelemetry handles the complexities of exporting telemetry from non-AWS environments.
- IAM credentials: The ADOT uses these access keys to authenticate with CloudWatch and forward your agent’s telemetry (traces, metrics, and logs) to the AgentCore Observability dashboard.
- Environment variables: These contain specific OpenTelemetry settings related to routing and authentication.
As seen in the following diagram, this cross-platform observability solution integrates several AWS services. Amazon CloudWatch serves as the foundation, handling telemetry ingestion and storage. Amazon Bedrock AgentCore Observability adds specialized monitoring dashboards for AI agents. AWS Distro for OpenTelemetry (ADOT) provides the cross-platform instrumentation capabilities. IAM secures the authentication between your external environments and AWS.
Figure 2: Cross-platform observability architecture and the AWS services involved
Observability is a foundational pillar of responsible AI. By routing telemetry to AgentCore Observability, you gain visibility into agent reasoning chains, tool invocations, and model outputs. This allows you to detect hallucinations, monitor for harmful or off-topic responses, track token usage for cost governance, and audit agent behavior across environments. This is especially critical for agents running outside AWS, where problematic outputs might go unnoticed without centralized observability.
Prerequisites
Before you begin, verify that you have:
- An AWS account:
with Amazon Bedrock model access configured (this walkthrough uses Claude Haiku). For model availability by AWS Region, refer to supported models by AWS Region in Amazon Bedrock.
- for designated AgentCore Observability and designated log group(s).
- CloudWatch Transaction Search turned on in your account (one-time setup)
- Python 3.10 or later installed on your non-AWS environment.
- IAM user credentials (access key ID and secret access key) with permissions for:
bedrock:InvokeModel.
- logs:CreateLogGroup, logs:CreateLogStream, logs:PutLogEvents.
- xray:PutTraceSegments, xray:PutTelemetryRecords, xray:GetSamplingRules, and xray:GetSamplingTargets.
- cloudwatch:PutMetricData.
- Outbound HTTPS access to AWS endpoints from your environment.
Turn on CloudWatch Transaction Search
If you haven’t turned on Transaction Search, run the following (one-time per account):
aws xray update-trace-segment-destination --destination CloudWatchLogs --region us-east-1Verify it’s active:
aws xray get-trace-segment-destination --region us-east-1
# Expected: {"Destination": "CloudWatchLogs", "Status": "ACTIVE"}
How it works
The ADOT auto-instrumentation (aws-opentelemetry-distro) handles the complexity of exporting telemetry from non-AWS environments to CloudWatch:
- Auto-instrumentation: The opentelemetry-instrument command injects the ADOT into the Python runtime. It automatically patches boto3 (for Amazon Bedrock calls) and the Strands framework (for agent reasoning spans) to emit OpenTelemetry traces.
- SigV4 authentication: The aws_configurator uses the boto3 credential chain to sign OTLP export requests with SigV4. From non-AWS environments, this uses the AWS_ACCESS_KEY_ID and AWS_SECRET_ACCESS_KEY environment variables.
- CloudWatch OTLP endpoint: The ADOT exports traces and logs to the CloudWatch native OTLP ingestion endpoint. The OTEL_EXPORTER_OTLP_LOGS_HEADERS header directs logs to the specific AgentCore log group, which is how CloudWatch indexes the data under the generative AI observability dashboard. For details on how the CloudWatch OTLP endpoint URL is determined and configured, see CloudWatch OTLP endpoint.
- Generative AI semantic conventions: The Strands [otel] package emits spans following the OpenTelemetry generative AI semantic conventions, including agent reasoning steps, tool invocations, and model calls with token usage.
The following diagram shows how telemetry export through ADOT auto-instrumentation works from non-AWS environments to CloudWatch.
Figure 3: Telemetry export through ADOT auto-instrumentation from non-AWS environments to CloudWatch
Walkthrough
Follow these steps to configure and run a Strands agent in a non-AWS environment, with telemetry routed to AgentCore Observability.
Step 1: Install dependencies
On your non-AWS environment (on-premises server, GCP VM, Azure VM, or a compute with internet access):
pip install "aws-opentelemetry-distro>=0.10.0" boto3 "strands-agents[otel]"The aws-opentelemetry-distro package includes the ADOT auto-instrumentation with OTLP exporters specific to AWS and the aws_configurator that handles SigV4 authentication. The strands-agents[otel] package provides OpenTelemetry trace emission from the Strands framework.
Step 2: Configure AWS credentials
Set your IAM user credentials as environment variables.
export AWS_ACCESS_KEY_ID=
export AWS_SECRET_ACCESS_KEY=
export AWS_REGION=us-east-1
Security note**: For production deployments, consider using IAM Roles Anywhere instead of long-lived access keys. With IAM Roles Anywhere, on-premises workloads can obtain temporary credentials using X.509 certificates.
Step 3: Set OpenTelemetry environment variables
These environment variables configure the ADOT to route telemetry to the AgentCore Observability dashboard:
export AGENT_OBSERVABILITY_ENABLED=true
export OTEL_PYTHON_DISTRO=aws_distro
export OTEL_PYTHON_CONFIGURATOR=aws_configurator
export OTEL_RESOURCE_ATTRIBUTES="service.name=my-external-agent,aws.log.group.names=/aws/bedrock-agentcore/runtimes/my-external-agent"
export OTEL_EXPORTER_OTLP_LOGS_HEADERS="x-aws-log-group=/aws/bedrock-agentcore/runtimes/my-external-agent,x-aws-log-stream=runtime-logs,x-aws-metric-namespace=bedrock-agentcore"
export OTEL_EXPORTER_OTLP_PROTOCOL=http/protobuf
export OTEL_TRACES_EXPORTER=otlp
Key configuration details:
- AGENT_OBSERVABILITY_ENABLED=true activates generative AI-specific telemetry processing in the ADOT.
- OTEL_PYTHON_DISTRO=aws_distro and OTEL_PYTHON_CONFIGURATOR=aws_configurator activate the OpenTelemetry configuration specific to AWS, including SigV4 signing for the CloudWatch OTLP endpoint.
- OTEL_RESOURCE_ATTRIBUTES with aws.log.group.names tells CloudWatch to index the telemetry under the AgentCore Observability dashboard. Without this, traces go to generic Amazon CloudWatch Logs.
- OTEL_EXPORTER_OTLP_LOGS_HEADERS with x-aws-metric-namespace=bedrock-agentcore routes metrics in embedded metric format to the correct CloudWatch namespace.
Step 4: Create the agent application
Create a file named agent_test.py with a Strands agent:
from strands import Agent
from strands.models.bedrock import BedrockModel
from opentelemetry import baggage
from opentelemetry.context import attach
import time

# Configure the Bedrock model
model = BedrockModel(
    model_id="us.anthropic.claude-haiku-4-5-20251001-v1:0",
    region_name="us-east-1"
)
# Create the agent
agent = Agent(
    model=model,
    system_prompt="You are a helpful travel assistant."
)

# Set session ID for AgentCore session tracking
# All agent calls after attach() share same session ID for multiple requests/responses
session_id = f"external-session-{int(time.time())}"
ctx = baggage.set_baggage("session.id", session_id)
attach(ctx)

# Run the agent
response = agent("What are the top 3 things to do in Tokyo?")
print(response)
Step 5: Run with ADOT auto-instrumentation
The opentelemetry-instrument command wraps your Python process with the ADOT, automatically instrumenting Amazon Bedrock calls and Strands framework operations:
opentelemetry-instrument python3.12 agent_test.pyThe agent’s response appears in the terminal. Behind the scenes, the ADOT captures traces, spans, and logs, and exports them to CloudWatch.
Step 6: Verify in AgentCore Observability
You see telemetry data within two to three minutes of execution. Open the Amazon CloudWatch console:
- Choose GenAI Observability, then Bedrock AgentCore.
- In the Agents tab, look for my-external-agent.
- Choose the agent to view sessions, traces, and span metrics.
The following screenshot shows the telemetry from the Strands agent (my-external-agent) running in a non-AWS environment, as seen in the AgentCore Observability dashboard in CloudWatch.
Figure 4: The my-external-agent telemetry in the AgentCore Observability dashboard
The console shows:
- Agent name: my-external-agent.
- Sessions: at least one session.
- Traces: trace spans showing the agent’s reasoning and Amazon Bedrock model invocations.
- Span details: invoke_agent, chat, execute_event_loop_cycle, and chat.us.anthropic.claude-haiku spans with latency and token metrics.
The following screenshot shows a successful trace from the Strands agent (my-external-agent) with four spans, model information, and latency and token details in the AgentCore Observability dashboard.
Figure 5: Trace detail for my-external-agent with span, latency, and token metrics
Validating from Google Cloud Platform
To confirm the solution works from a third-party cloud provider, we tested the same setup from Google Cloud Shell, a browser-based terminal running on GCP infrastructure.
Set up the environment on Google Cloud Shell:
# Create a virtual environment
python3.12 -m venv venv
source venv/bin/activate
# Install dependencies
pip install "aws-opentelemetry-distro" boto3 "strands-agents[otel]"
# Set AWS credentials
export AWS_ACCESS_KEY_ID=
export AWS_SECRET_ACCESS_KEY=
export AWS_REGION=us-east-1
# Set ADOT environment variables
export AGENT_OBSERVABILITY_ENABLED=true
export OTEL_PYTHON_DISTRO=aws_distro
export OTEL_PYTHON_CONFIGURATOR=aws_configurator
export OTEL_RESOURCE_ATTRIBUTES="service.name=gcp-hosted-agent,aws.log.group.names=/aws/bedrock-agentcore/runtimes/gcp-hosted-agent"
export OTEL_EXPORTER_OTLP_LOGS_HEADERS="x-aws-log-group=/aws/bedrock-agentcore/runtimes/gcp-hosted-agent,x-aws-log-stream=runtime-logs,x-aws-metric-namespace=bedrock-agentcore"
export OTEL_EXPORTER_OTLP_PROTOCOL=http/protobuf
export OTEL_TRACES_EXPORTER=otlp
Run the agent from GCP:
cat > agent_test.py << 'EOF'
from strands import Agent
from strands.models.bedrock import BedrockModel
from opentelemetry import baggage
from opentelemetry.context import attach
import time

model = BedrockModel(
    model_id="us.anthropic.claude-haiku-4-5-20251001-v1:0",
    region_name="us-east-1"
)
agent = Agent(model=model, system_prompt="You are a helpful assistant.")

# Set session ID for AgentCore session tracking
# All agent calls after attach() share same session ID for multiple requests/responses
session_id = f"gcp-session-{int(time.time())}"
ctx = baggage.set_baggage("session.id", session_id)
attach(ctx)

response = agent("What are the top 3 things to do in Paris?")
print(response)
EOF
opentelemetry-instrument python3.12 agent_test.py
The following screenshot shows the Strands agent (gcp-hosted-agent) running on Google Cloud Shell (GCP) and returning a successful response.
Figure 6: The gcp-hosted-agent running in Google Cloud Shell
Verify cross-cloud telemetry
Within two to three minutes of execution, the gcp-hosted-agent appears in the AgentCore Observability dashboard alongside agents running on AgentCore runtime or other environments.
The following screenshot shows a successful trace from the Strands agent (gcp-hosted-agent) running on GCP with four spans, model information, and latency and token details in the AgentCore Observability dashboard.
関連記事
今日のまとめ
AIデイリーブリーフで今日の重要ニュースをまとめ読み