Cloudflare の請求パイプラインが突然遅延した原因は ClickHouse の隠れたボトルネックだった
Cloudflare は ClickHouse の大規模運用において、クエリ計画時のロック競合という隠れたボトルネックを発見し、内部パッチを適用して解決した事例を紹介している。
キーポイント
ClickHouse の大規模運用と設計変更
Cloudflare はペタバイト級のデータを扱う ClickHouse クラスター上で、テナントごとのデータ保持ポリシー(per-tenant retention)を実現するため、パーティショニングキーに列を追加する設計変更を行った。
通常のパラメータでは検出できないボトルネック
パフォーマンス低下の原因は I/O、メモリ使用量、スキャン行数といった通常の監視項目では正常だったため特定できず、最終的にクエリ計画段階でのロック競合(lock contention)が原因であることが判明した。
内部パッチによる解決と教訓
この移行プロセスで露呈した ClickHouse の内部構造における隠れたボトルネックに対し、開発チームは独自の修正(パッチ)を適用して問題を解決し、その過程を共有している。
パーティショニングスキームの変更と期待
(namespace, day) を新しいパーティションキーとして採用し、既存の保持システムを維持しながらネームスペースごとのデータ削除を可能にした。
ストレージ管理層の高度化
最大最小公平性アルゴリズムを用いてディスク使用率を90%まで安全に運用し、未使用容量を必要とするネームスペースへ自動で割り当てる仕組みを実装した。
ボトルネックの正体と発見
I/Oやメモリは正常だったが、クエリ実行時間とクラスタ内のデータパーツ総数に明確な相関関係があることが判明し、これがパフォーマンス低下の原因だった。
CPU トレースからリアルタイムトレースへの切り替え
アクティブなスレッドのみをサンプリングする CPU ベースのトレースでは見逃されていた、待機中のスレッドを含む「Real」トレースへ切り替えることで、真の原因が特定された。
影響分析・編集コメントを表示
影響分析
この記事は、ClickHouse を基盤とした超大规模データプラットフォームを運用する企業にとって、パフォーマンスチューニングにおける盲点(クエリ計画時のロック競合)を明確に指摘しており、実務的な示唆に富んでいます。また、一般的な監視指標では検出できない内部ボトルネックを発見・解決したプロセスは、DB 管理者やシステムアーキテクトにとって貴重な教訓となり、同様の環境を持つ他社のトラブルシューティングにも役立つでしょう。
編集コメント
一般的な監視項目では見逃されがちな、データベース内部の設計段階における競合問題を浮き彫りにした貴重な事例です。大規模システム運用においては、表面のパラメータだけでなく、クエリ計画や内部ロック機構への深い理解が不可欠であることを再認識させられます。
Cloudflare では、オープンソースの分析用データベース管理システムである ClickHouse を大規模に活用しています。私たちは、数百もの内部チームが利用するテーブルに対してテナントごとのデータ保持期間を可能にするため、パーティショニングキーに列を追加する形で、最も大きな ClickHouse テーブルの一つのリデザインを行いました。この設計は、最終的なアプローチにたどり着くまでに、複数のチームのエンジニアたちによる数回の改訂とレビューを経て完成しました。しかし、ロールアウトから数週間後、Cloudflare の請求書の大部分を生成するジョブが、厳格な毎日の期限に直面し始めました。
通常疑われる要因はすべて正常でした:I/O、メモリ、スキャンされた行数、読み込まれたパーティション。ClickHouse クエリが遅くなる際に通常確認する項目はすべて正常に見えました。しかし、問題の正体はクエリ計画におけるロック競合であり、これは以前から原因を調べる理由がなかった箇所でした。
この移行が ClickHouse の内部に隠されたボトルネックを明らかにし、私たちがそれを修正するために作成したパッチについての物語です。
環境設定:ペタバイト規模の分析プラットフォーム
私たちは、数十のクラスターにまたがる 100 ペタバイト以上のデータを保存するために ClickHouse を使用しています。多数の内部チームに対するオンボーディングを簡素化するため、2022 年初頭に「Ready-Analytics」と呼ばれるシステムを構築しました。
前提は単純です。新しいテーブルを設計する代わりに、チームはデータを単一の巨大なテーブルにストリーミングできます。データセットは名前空間によって曖昧さを解消し、各レコードは標準スキーマ(例:20 個の浮動小数点フィールド、20 個の文字列フィールド、タイムスタンプ、および indexID)を使用します。
ClickHouse では、データをどのようにソートするかがクエリパフォーマンスに決定的な影響を与えます。ここで indexID が重要な役割を果たします。これは主キーの一部を形成する文字列フィールドであり、各名前空間ごとに、その名前空間の所有者が実行すると予想されるクエリに対して最適な方法でデータをソートできるようにしています。全体として、以下のような主キーが得られます:(namespace, indexID, timestamp)。
このシステムは非常に人気があり、数百ものアプリケーションで使用されています。2024 年 12 月にはデータ量がすでに 2PiB を超え、毎秒数百万行の取り込み速度を記録していました。しかし、一つの決定的な欠陥がありました:その保持ポリシーです。
問題点:すべてのルールに適用される単一の保持ポリシー
Cloudflare は、ネイティブの Time-to-Live (TTL) 機能が備わる以前から長年 ClickHouse を使用しています。そのため、パーティショニングに基づいた独自の保持システムを構築しました。Ready-Analytics テーブルは日付ごとにパーティション分割されており、保持ジョブは単純に 31 日以上前のパーティションを削除するだけでした。
この「一律適用」の31日間保持ポリシーは大きな制限要因でした。法的または契約上の義務により、一部のチームではデータを数年間保存する必要がありましたが、他のチームでは数日間の保存で十分でした。この制限により、これらのユースケースは Ready-Analytics を利用できず、オンボーディングプロセスがはるかに複雑な従来のセットアップを選択せざるを得ませんでした。
私たちは名前空間ごとの保持を可能にする新しいシステムが必要でした。
解決策:新しいパーティショニングスキーム
私たちは主に2つのアプローチを検討しました:
名前空間ごとのテーブル: これは自然に保持問題を解決しますが、オンデマンドで数千のテーブルを管理するための大幅な新自動化が必要になります。
新しいパーティションキー: パーティションキーを (日付) のみから (名前空間,日付) に変更できます。
私たちは2番目のオプションを選択しました。これにより、既存の保持システムが引き続きパーティションを管理できるようになりますが、粒度は名前空間単位となります。
テーブル内のデータパーツの総数が増加することは承知していましたが、重要な仮定を立てました:すべてのクエリが特定の名前空間でフィルタリングされるため、単一のクエリが読み込むパーツ数は変わらないはずです。これによりパフォーマンスには影響しないと私たちは考えました。
 image
image
これは、単一の名前空間のデータを安価に削除できるようになったパーティショニングの変更を示しています
この新システムにより、高度なストレージ管理層を構築することも可能になりました。最大最小公平性アルゴリズム(max-min fairness algorithm)を用いることで、ターゲットとなるディスク利用率(例:90%)を設定し、利用可能なスペースを自動的に「共有」できるようになります。割り当てられた公平なシェアよりも少ない容量しか使用していない名前空間は、その未使用容量をより必要とする他の名前空間に譲渡します。これにより、クラスターを 90% の利用率で安全に運用することが可能になりました。
移行作業は 2025 年 1 月に開始されました。ClickHouse の Merge テーブル機能(Merge table feature)を活用し、旧テーブルと新テーブルを結合させました。これにより、新しいデータはすべて新しいパーティション化されたテーブルへ書き込まれながら、古いデータは徐々に期限切れとなりました。
謎解き:請求処理が突然破綻したとき
2 ヶ月後、2025 年 3 月下旬のことでした。請求チームから、日次集計ジョブ(daily aggregation jobs)の速度が遅くなっているとの報告がありました。これらのジョブは時間厳守であり、完了しなければ請求書が発行されません。ジョブの処理時間は次第に遅延し、期限が迫っていました。
調査を進めましたが、いつもの犯人候補には当てはまりませんでした。I/O は正常でした。メモリも問題ありませんでした。個々のクエリのメトリクスを見ても、以前よりも多くのデータやパーティション(parts)を読み込んでいないことが示されました。当初の仮説は正しかったように思われましたが、システムは完全に停止状態に陥っていました。
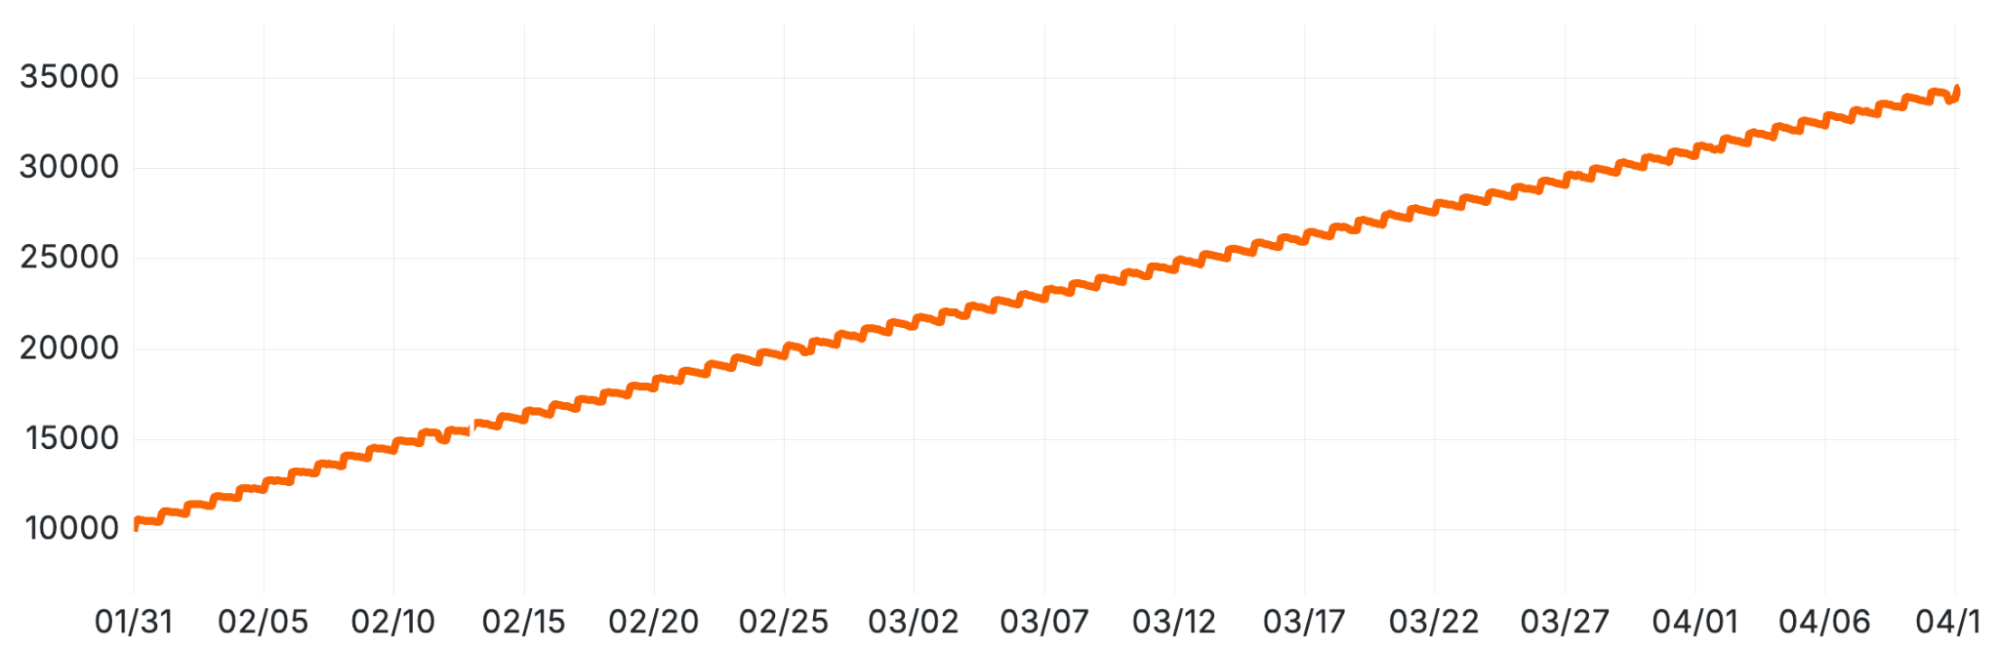
理論を構築するまでに数日を要しました。最終的に、クラスター内の総パーティション数に対するクエリ実行時間のプロットを作成したところ、その相関関係は疑う余地のないものでした。

Ready Analytics の ClickHouse クラスターにおける平均 SELECT クエリ実行時間。段階的なパフォーマンス劣化を示しています。
 image
image
新しい (namespace, day) パーティションスキームに従った、テーブルレプリカごとのデータパーティ総数の線形的な増加。
しかしなぜでしょうか?追加のパーティを読み込んでいないのに、その存在自体がどうしてパフォーマンスを低下させたのでしょうか?
調査:フレイムグラフによるボトルネックの特定
フレイムグラフ(flame graph)を生成するために、ClickHouse の組み込み機能である trace_log を利用しました。これは実行中の ClickHouse サーバーからのトレース記録を保持する組み込みテーブルです。ここで記録されるのは単にどのコードが実行されているかというトレースだけでなく、特定のユーザー、クエリ ID、その他のメタデータとの関連付けも含まれるため、必要に応じて非常に精密なイベントセットに絞り込むことが可能です。今回のケースでは、特にリーフ(leaf)SELECT クエリに焦点を当てて調査を行いました。このテーブルに含まれる利用可能なメタデータのおかげで、これは容易に行えました。
最初に作成した CPU ベースのフレイムグラフは、私たちの懸念をすぐに裏付けました:膨大な時間がクエリプランニング(query planning)に費やされていました。これは実行前のフェーズであり、ClickHouse がどのパーティを読み込むかを決定する段階です。
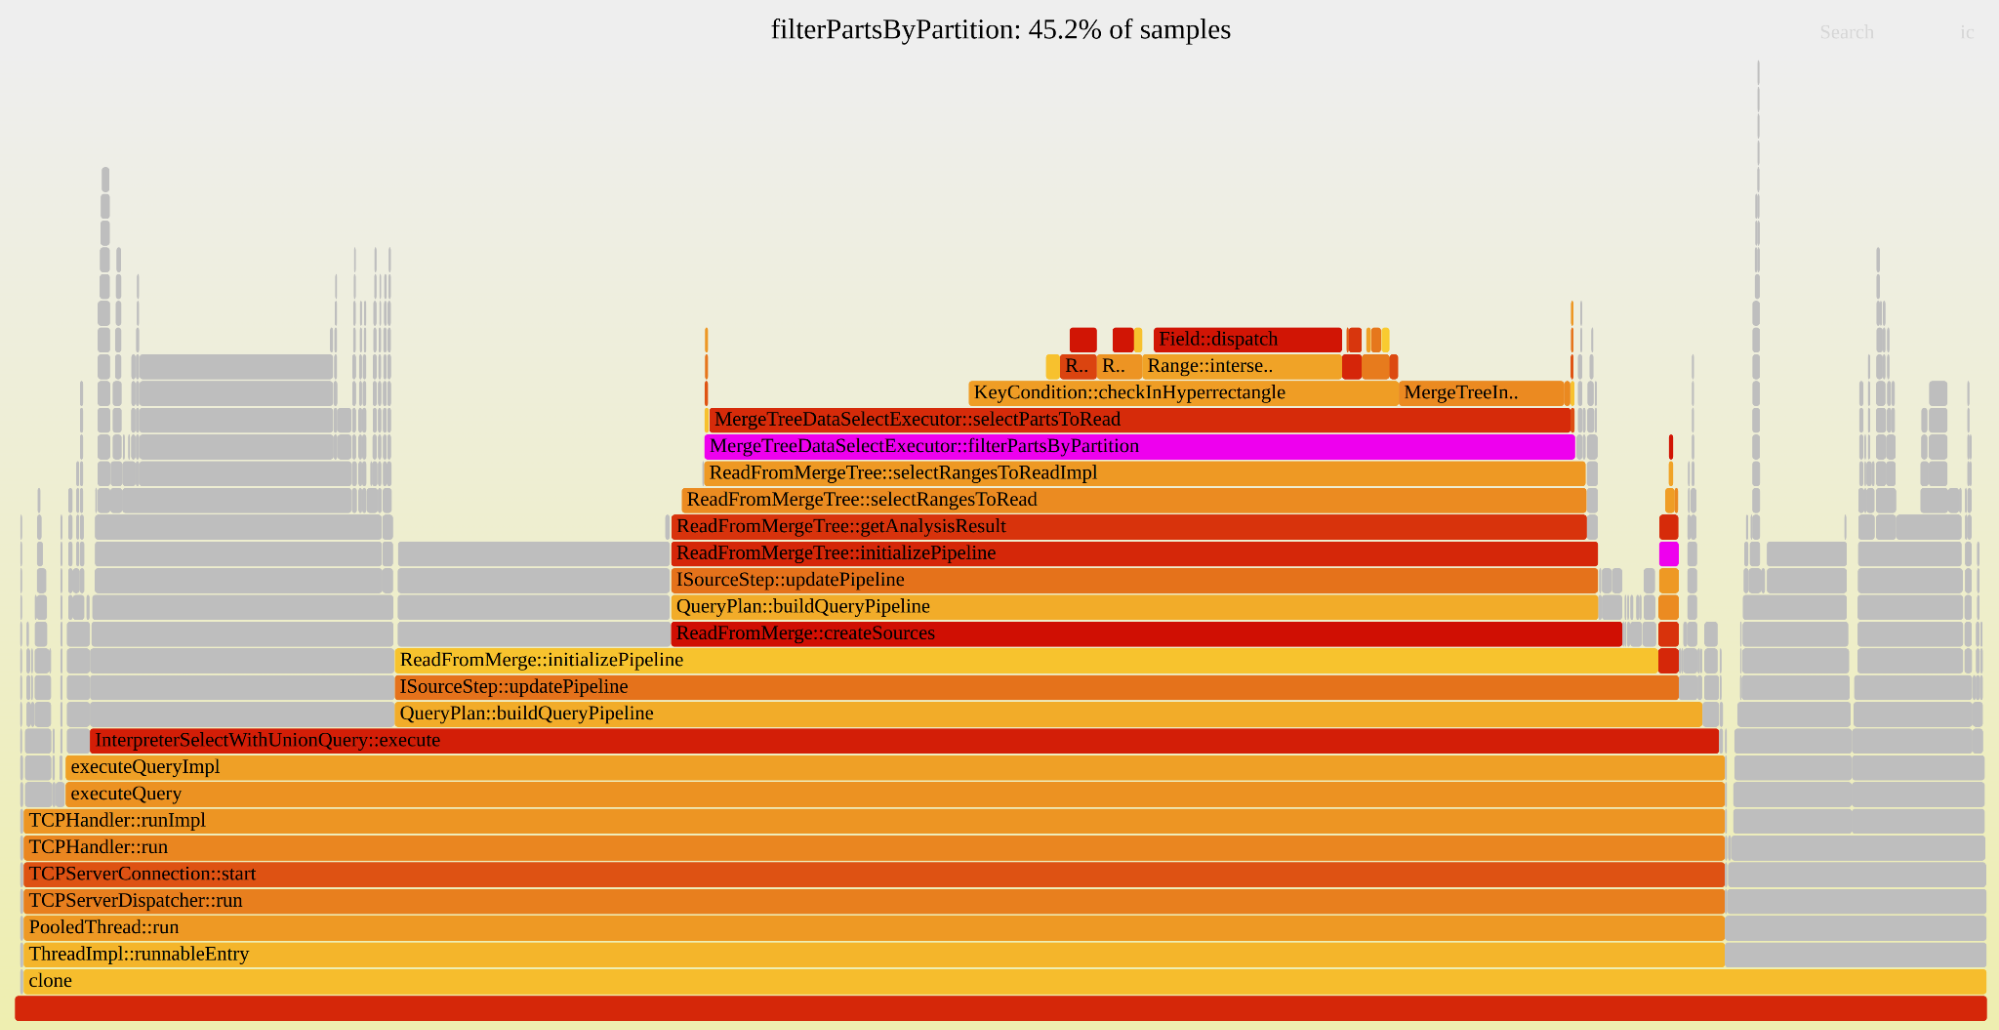
パーティション ID に基づいてパーツのベクトルをフィルタリングする際に、リーフクエリの CPU 時間の 45% が消費されていることを示すフレームグラフ
フレームグラフは明確でした:サンプリングされた CPU 時間の 45% が、filterPartsByPartition という単一の関数内で消費されていました。
私たちの最初の修正試みは、この特定のコードパスに対する小さなパッチでした。プランナーはパーツを剪断するためのヒューリスティックを評価しますが、私たちはそれがテーブルに対して最適な順序で評価されていないと考えていました。私たちのパッチはこの順序を変更し、わずかに 5% の改善をもたらしました。私たちは正しい方向に進んでいましたが、真の問題を見落としていたのです。
私たちは「CPU」トレースを生成していましたが、これはアクティブなスレッドのみをサンプリングするものでした。私たちはすべてのスレッド(非アクティブまたは待機中のスレッドを含む)をサンプリングする「Real」トレースに切り替えました。新しいフレームグラフは驚くべき発見でした。
 image
image
リーフクエリの持続時間の半分超が、アクティブなパーツのリストを保護するミューテックス(mutex)の取得待ちに費やされていることを示すフレームグラフ
問題は CPU 負荷の高い作業ではなく、大規模なロック競合でした。クエリ持続時間の半分以上は、テーブルのパーツリストを保護する単一のミューテックス(MergeTreeData)を取得するために待機することに費やされていました。クエリを計画するためには、すべてのスレッドが次の手順を実行する必要がありました:
このミューテックスに対して排他的ロックを取得する。
テーブル内のすべてのパーツのリストを完全にコピーする。
ロックを解放する。
そのリストから関連するパーツのみをフィルタリングする。
数万個のパーツと数百の並行クエリが存在する状況では、すべてが単一のファイルラインで順番待ちの状態でした。
対策:3 つのパッチ群
この洞察により、これらのホットスポットを緩和するための一連の最適化計画を立てることができました。ClickHouse に対して行うすべてのパッチと同様に、私たちはそれらを汎用的なものとし、最終的にアップストリームのコードベースにコントリビュートされるように努めています。これにより、フォークのメンテナンスが容易になり、コミュニティも私たちの変更から恩恵を受けることになります!
最適化 1:共有ロックの使用
クエリプランナーはパーツリストを変更するのではなく、単に参照するだけです。排他的ロックを使用する必要はありませんでした。
対策:コードを修正し、排他的ロックの代わりに共有ロック (std::shared_lock) を取得するようにしました。これにより、すべてのクエリプランナーがクリティカルセクションに同時にアクセスできるようになりました。
結果:クエリ実行時間が劇的かつ即座に短縮されました。ロック競合は解消されました。
 image
image
共有ロック最適化(最適化 1)が平均 SELECT クエリ実行時間に与えた即時的な影響。ロック競合の解消を示しています。
最適化 2:ベクトルのコピーを停止する
パフォーマンスは大幅に改善されましたが、まだベースラインには戻りませんでした。私たちはトレースログに戻り、もう一つの「リアル」なフレイムグラフを作成しました。

フレイムグラフは、リーククエリ(leaf query)の持続時間の 4 分の 1 を全パーツのベクトルをコピーすることに費やし、さらに別の 4 分の 1 をその中からフィルタリングする(再度コピーする)ことに費やしていることを示しています。
新しいフレイムグラフは、ボトルネックが単に移動しただけであることを示しました。今では、共有ロックを使用しているにもかかわらず、巨大なパーツのベクトルをコピーすることに時間が費やされています。直感的にはベクトルのコピーは安価に思えますが、それが数万個の要素を含み、1 秒間に数百回実行される場合、その合計は無視できません。
解決策:私たちはコピーを完全に遅延させることにしました。パーツリストの「共有コピー」を作成します。読み取り専用操作(クエリ計画など)はこのコピーから直接読み取ります。パーツセットを変更する操作(新しい挿入など)はキャッシュを再生成します。プランナーは、実際に必要なフィルタリングされたパーツリストのみをコピーするように変更されました。
結果:さらに顕著なパフォーマンスの改善が達成されました。

ベクトルコピー最適化(最適化 2)をロールアウトした後のさらなるパフォーマンス改善。
これらの内部での大幅なコスト削減を確認した後、私たちはこれらの変更をコミュニティにも提供することを決定しました。ClickHouse Inc. のメンテナーとのいくつかの小さな設計の反復を経て、変更は PR #85535 としてマージされました。これらは ClickHouse バージョン 25.11 から利用可能になっています。
最適化 3: パーツに対するバイナリ検索
まだ完了していません。パーツ数が成長するにつれて、パフォーマンスは依然として低下しますが、その速度は大幅に緩やかです。パーツ数との相関関係はまだ存在していました。数ヶ月後にこの問題に戻ると、新しいフレイムグラフ(図 3 と同じ外観)が、時間がフィルタリングコードパス(最初に修正を試みたもの)で消費されていることを示しています。このコードはすべてのパーツに対して線形走査を実行し、各パーツに対して述語を評価します。数ヶ月後には、最適化前の選択実行時間に戻ってしまいました。
しかし、私たちはこのパーツリストがパーティショニングキーによってソートされていることを知っています。パーティションキーの最初の列は名前空間であり、これは「テナント」を識別するため、绝大多数のクエリがこの項目でフィルタリングします。これをどのように活用できるでしょうか?
解決策:パーティション ID の名前空間部分に基づいた二分探索を実装しました。これはベクトルがソートされているため、実際に見ることなく多くのエントリをフィルタリングできるからです。特に、名前空間がこのソートキーの最初の部分であるため、この手法は非常に効果的です。この最初のパスの二分探索の後、確認する必要があるパーティションの範囲が大幅に縮小されます。その後、残りのパーティションについては以前と同じロジックを適用し、他の条件に基づいて除外します。
結果:2026 年 3 月にこのパッチを展開した後、クエリの実行時間が 50% 短縮されました(図 8 を参照)。さらに重要なのは、これでついにクエリ実行時間とパーティション数の相関関係が解消されたことです。残念ながら、この解決策は任意のクエリ条件(例:namespace IN (5,10) のような条件)に対して一般化して適用するのは容易ではありません。私たちは、パーティションフィルタリングをカバーするようにクエリ条件キャッシュを拡張するなど、より汎用的なアプローチを検討中です。
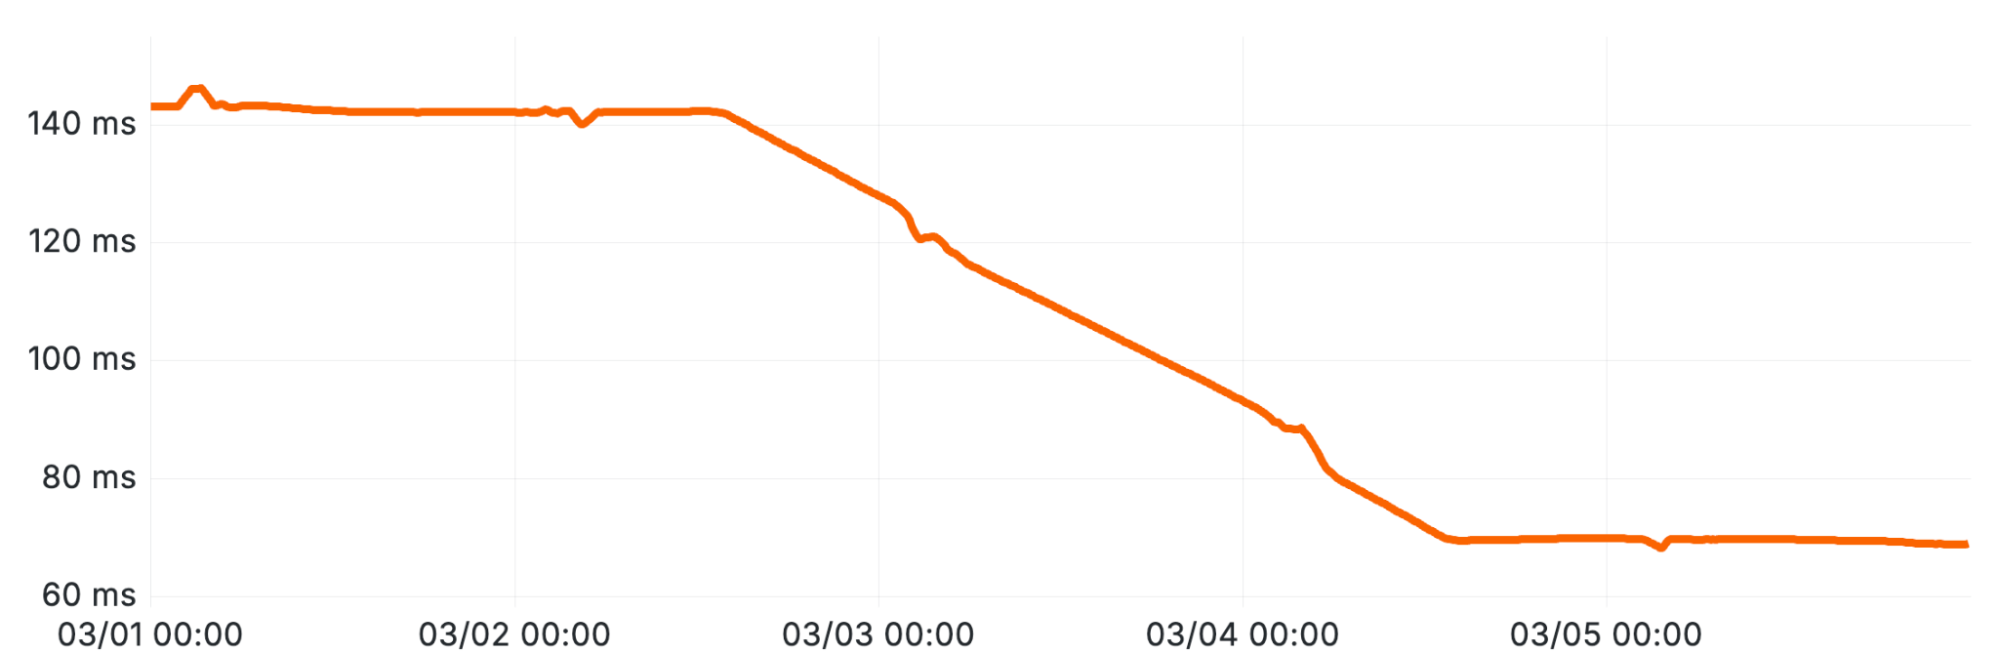
パーティションプルーニングのための二分探索(最適化 3)の実装に伴う持続的なレイテンシの削減。
不安定な休戦協定
これらの最適化により、請求システムにおける即座の危機は解決されました。しかし、この旅を通じて、私たちのパーティショニング選択が持つ深遠で直感的でないコストが明らかになりました。
他の問題も残っています。このブログ記事では、部分数の増加が select の実行時間に与えた影響についてのみ記述しましたが、ClickHouse 内のすべての部分のメタデータを追跡する ZooKeeper にも問題を引き起こしました。いつか 100 ギガバイト規模の ZooKeeper クラスターに関する物語を語る日が来るかもしれません。
私たちは十分な猶予を得ましたが、根本的な問いは依然として残っています:このパーティショニングスキームは長期的に正しい選択だったのでしょうか?それとも最終的に覚悟を決めて別のアーキテクチャへ移行する必要があるのでしょうか?現時点ではパッチが機能していますが、今回の経験は、計画された変更であっても誤った前提によって失敗しうることを明確に示す事例となりました。
請求チームがこの問題を最初に報告した時点では、レプリカあたり 30,000 個の部分がありました。部分数の増加率は止まることなく、1 年後にはレプリカあたり 160,000 個に達しましたが、ここで実施した最適化のおかげでクエリの実行時間は安定しています。
Cloudflare では、大規模な複雑なエンジニアリング問題に取り組んでいます。ここで紹介したデバッグや最適化が、あなたが探しているような挑戦に見える場合は、現在募集しているオープンポジションをぜひご覧ください。
原文を表示
At Cloudflare, we are heavy users of ClickHouse, an open-source analytical database management system. We redesigned one of our largest ClickHouse tables to add a column to the partitioning key. The change enabled per-tenant retention on a table that serves hundreds of internal teams. The design went through several rounds of revision and review with engineers across multiple teams before we landed on the final approach. But a few weeks after rollout, the jobs that produce most of Cloudflare's bills were running up against their hard daily deadline.
All the usual suspects looked clean: I/O, memory, rows scanned, parts read. Everything we would normally check when a ClickHouse query is slow appeared to be normal. The problem turned out to be lock contention in query planning, something we'd never had reason to look for before.
This is the story of how this migration exposed a hidden bottleneck in ClickHouse's internals, and the patches we wrote to fix it.
The setup: a petabyte-scale analytics platform
We use ClickHouse to store over a hundred petabytes of data across a few dozen clusters. To simplify onboarding for our many internal teams, we built a system called "Ready-Analytics" in early 2022.
The premise is simple: instead of designing new tables, teams can stream data into a single, massive table. Datasets are disambiguated by a namespace, and each record uses a standard schema (e.g., 20 float fields, 20 string fields, a timestamp, and an indexID).
In ClickHouse, the way data is sorted is crucial to query performance. This is where the indexID comes into play. It’s a string field, which forms part of the primary key, meaning that every individual namespace can have its data sorted in a way that is optimal for the queries the owners of that namespace expect to be running. Altogether, we end up with a primary key that looks like this: (namespace, indexID, timestamp).
This system is popular, with hundreds of applications using it. It had already grown to more than 2PiB of data by December 2024, and an ingestion rate of millions of rows per second. But it had one critical flaw: its retention policy.
The problem: one retention policy to rule them all
Cloudflare has been using ClickHouse for many years, since before it had native Time-to-Live (TTL) features. Consequently, we built our own retention system based on partitioning. The Ready-Analytics table was partitioned by day, and our retention job simply dropped partitions older than 31 days.
This "one-size-fits-all" 31-day retention was a major limitation. Some teams needed to store data for years due to legal or contractual obligations, while others needed only a few days. This restriction meant these use cases couldn't use Ready-Analytics and had to opt for a conventional setup, which has a far more complex onboarding process.
We needed a new system that allowed per-namespace retention.
The solution: a new partitioning scheme
We considered two main approaches:
A Table-per-Namespace: This would naturally solve the retention problem but would require significant new automation to manage thousands of tables on demand.
A New Partitioning Key: We could change the partitioning key from just (day) to (namespace, day).
We chose the second option. This would allow our existing retention system to continue managing partitions, but now with per-namespace granularity.
We knew this would increase the total number of data parts in the table, but we made a key assumption: since every query is filtered by a specific namespace, the number of parts read by any single query shouldn't change. We believed this meant performance would be unaffected.
image
This shows how we changed the partitioning, allowing us to cheaply drop data for a single namespace
This new system also allowed us to build a sophisticated storage management layer. Using the max-min fairness algorithm, we could set a target disk utilization (e.g., 90%) and automatically "share" available space. Namespaces using less than their fair share would cede their unused capacity to those that needed more. This allowed us to confidently run our clusters at 90% utilization.
We began the migration in January 2025. Using ClickHouse's Merge table feature, we combined the old and new tables, writing all new data to the new partitioned table while the old data aged out.
The mystery: when billing starts to break
Two months later, in late March 2025, our billing team reported that their daily aggregation jobs were slowing down. These jobs are time-critical; if they don't finish, bills don't go out. The jobs were getting progressively slower, and we were approaching a deadline.
We investigated, but none of the usual suspects were to blame. I/O was fine. Memory was fine. The metrics for individual queries showed they were not reading more data or more parts than before. Our initial assumption seemed correct, yet the system was grinding to a halt.
It took several days before we even had a theory. Finally, we made a plot of query duration against the total part count in the cluster. The correlation was undeniable.
image
Average SELECT Query Durations on the Ready Analytics ClickHouse Cluster, showing progressive performance degradation.
image
Linear Growth in Total Data Part Count per Table Replica, following the new (namespace, day) partitioning scheme.
But why? If we weren't reading the extra parts, why did their mere existence slow us down?
The investigation: hunting bottlenecks with flame graphs
We turned to ClickHouse's built-in trace_log to generate flame graphs. This is a built-in table that records traces from the running ClickHouse server. It not only includes traces of what code is being executed, but it associates these with specific users, query IDs and other metadata, meaning you can filter down to quite precise sets of events if necessary. In our case, we wanted to look specifically at leaf SELECT queries. This was easy thanks to the available metadata in this table.
The first CPU-based flame graph quickly confirmed our suspicion: a huge amount of time was being spent in query planning. This is the phase before execution when ClickHouse decides which parts to read.
image
Flame graph showing that 45% of leaf query CPU time is spent filtering a vector of parts based on the partition ID
The flame graph was clear: 45% of the sampled CPU time was being spent in a single function called filterPartsByPartition.
Our first attempt at a fix was a small patch to this exact code path. The planner evaluates heuristics to prune parts, and we believed they weren't being evaluated in the optimal order for our table. Our patch changed the order, yielding a small 5% improvement. We were on the right path, but we'd missed the real problem.
We had been generating "CPU" traces, which only sample active threads. We switched to "Real" traces, which sample all threads, including those that are inactive or waiting. The new flame graph was a revelation.
image
Flame graph showing that more than half of leaf query duration is spent waiting for a mutex that protects the list of active parts
The problem wasn't CPU-bound work; it was massive lock contention. More than half of our query duration was spent waiting to acquire a single mutex (MergeTreeData) that protects the table's list of parts. To plan a query, every single thread had to:
Acquire an exclusive lock on this mutex.
Make a complete copy of the list of all parts in the table.
Release the lock.
Filter that list down to the relevant parts.
With tens of thousands of parts and hundreds of concurrent queries, they were all just standing in a single-file line.
The fixes: a trio of patches
This insight helped us plan a series of optimizations to alleviate these hotspots. As with all the patches we make to ClickHouse, we try to make them generic, and eventually get them contributed to the upstream codebase. This makes it easier for us to maintain our fork, and means the community benefits from the changes we make too!
Optimization 1: use a shared lock
The query planner doesn't modify the parts list; it just reads it. It had no business using an exclusive lock.
The Fix: We modified the code to acquire a shared lock (std::shared_lock) instead. This allowed all query planners to enter the critical section concurrently.
The Result: A massive, immediate drop in query duration. The lock contention vanished.
image
Immediate Impact of the Shared Lock Optimization (Optimization 1) on Average SELECT Query Durations, demonstrating the resolution of lock contention.
Optimization 2: stop copying the vector
Performance was significantly better, but still not back to baseline. We went back to the trace log and made another ‘Real’ flame graph.
image
Flame graph showing that we spend a quarter of leaf query duration copying the vector of all parts, and another quarter filtering through it (copying again).
The new flame graph showed the bottleneck had simply moved. Now, time was being spent copying the giant vector of parts, even with the shared lock. Intuitively, copying a vector sounds cheap, but when it contains tens of thousands of elements, and you do it hundreds of times a second, it adds up.
The Fix: We deferred the copy entirely. We created a "shared copy" of the parts list. Read-only operations (like query planning) just read from this copy. Any operation that modifies the set of parts (like a new insert) regenerates the cache. Planners now only copy the filtered list of parts they actually need.
The Result: Another significant performance improvement.
image
Further Performance Improvement After Rolling Out the Vector Copy Optimization (Optimization 2).
After seeing these massive savings internally, we decided to bring these changes to the community. After some small design iterations with the maintainers at ClickHouse Inc., we got the changes merged under PR #85535. They have been available since ClickHouse version 25.11.
Optimization 3: binary search for parts
We're still not done. As part counts grow, performance still degrades, just much more slowly. The correlation with part count was still there. Coming back to this after a few months, a new flame graph (looking the same as Figure 3) shows the time is spent in the filtering code path (the one we tried to fix first). This code performs a linear scan over all parts, evaluating predicates against each one. Over a few months, we were back to select durations from before the optimizations.
But we know this list of parts is sorted by the partitioning key. Remember that the first column of the partition key is namespace, which the vast majority of queries filter on, because it identifies the “tenant.” How can we make use of this?
The Fix: We implemented a binary search based on the namespace part of the partition ID. This works because the vector is sorted, so you can filter out a lot of the entries without actually looking at them. This is particularly effective since the namespace is the first part of that sorting key. After this first-pass of binary search, we have a much smaller range of parts we need to examine, and for those we still step through each one, applying the same logic as before to exclude parts based on other conditions.
The Result: After deploying this patch in March 2026, query durations dropped by 50% (see Figure 8). More importantly, this finally breaks correlation of query durations with the number of parts. Unfortunately, this solution doesn’t generalize that well for arbitrary query conditions (e.g. conditions such as namespace in (5,10)). We are looking into more generic approaches like extending the query condition cache to cover part filtering.
image
Sustained Latency Reduction Following the Implementation of Binary Search for Part Pruning (Optimization 3).
An uneasy truce
These optimizations resolved the immediate crisis with the billing system. But this journey exposed the deep, non-obvious costs of our partitioning choice.
Other problems remain. In this blog post we’ve only described the problems increasing part counts had on our select durations, but it has also caused problems for ZooKeeper, which tracks metadata for all the parts in ClickHouse. Perhaps one day we’ll tell the story of the 100 gigabyte ZooKeeper cluster.
We've bought ourselves significant breathing room, but the fundamental question remains: Was this partitioning scheme the right long-term choice? Or will we eventually need to bite the bullet and move to a different architecture? For now, our patches are holding, but the experience was a clear example of how even a well-planned change can fall victim to incorrect assumptions.
When the billing team first reported this problem we had 30,000 parts per replica. The part rate never stopped growing, and a year later we hit 160k parts per replica, but query durations have been stable thanks to the optimizations we made here.
At Cloudflare, we solve complex engineering problems at a massive scale. If the debugging and optimizations we described here sound like the type of challenge you’re looking for, check out some of the open roles we are hiring for.
関連記事
今日のまとめ
AI日報で今日の重要ニュースをまとめ読み