LMSYS、Blackwell で Ling-3.0-flash の推論速度向上を検証
本文の状態
日本語全文を表示中
詳細モードで約49分の本文を読めます。
同じ出来事の情報源
この情報源を基点に整理
LMSYS Blog
LMSYS は NVIDIA Blackwell GPU 上で Ling-3.0-flash モデルの推論速度を最適化し、バッチサイズ1の環境でスループットを最大2.1倍に向上させる技術的進歩を発表した。
AI深層分析を開く2026年8月22日 02:59
AI深層分析
キーポイント
Blackwell 環境における推論性能の劇的向上
NVIDIA Blackwell GPU 4枚構成において、Ling-3.0-flash モデルのバッチサイズ1(単一リクエスト)デコード速度を 288 tok/s から 606 tok/s に引き上げ、平均 TPOT を 54% 削減した。
DSpark による高スループットの実現
信頼度スケジューリング型スペキュラティブデコーダ「DSpark」を採用することで、1000 リクエストの並行処理において平均 TPOT 0.78 ms、スループット 1120 tok/s を達成し、既存手法 NEXTN と比較して 1.9 倍の性能向上を示した。
ホスト側最適化とカーネル融合によるボトルネック解消
ホスト側のピン操作削除、PDL チェーニング、およびルーターや LM ヘッドの fp32 から bf16 への移行など複数の最適化を組み合わせ、GPU のクリティカルパスを短縮した。
DSparkによる性能向上
DSparkを導入することで平均出力スループットが1120 tok/s、平均TPOTが0.78 msに達し、既存の最適化手法を大幅に上回る結果となった。
ハイブリッドアテンション構造
Ling-3.0-flashはKDA線形アテンション層とMLAフルアテンション層を組み合わせたハイブリッドアーキテクチャを採用している。
重要な引用
Batch 1 gives an inference stack no room to hide overhead.
DSpark reached 0.78 ms mean TPOT and 1120 tok/s at concurrency 1,000 requests.
Moving the router gate and lm_head from fp32 to bf16 was the largest post-structural change.
SGLang's TPOT excludes TTFT, while output throughput divides total output tokens by total benchmark wall time
編集コメントを表示
編集コメント
バッチサイズ1の推論は、リアルタイム性を要求されるサービスにおいて最もボトルネックになりやすい領域だが、LMSYS の分析はその解決策を極めて詳細に示している。特に DSpark の導入により、高負荷下でも安定した低レイテンシを実現できる点は、実運用環境への適用可能性が高いと言える。
Source Article
元記事を日本語で読む
本文に関係しない購読案内、埋め込み通知、サイト内プロモーションは除いています。
バッチサイズ 1 の推論は、ますます重要性を増しています。例えば Xiaomi の MiMo は 6 月に「MiMo-V2.5-Pro UltraSpeed」を発表し、1 兆パラメータの MoE モデルで 1,000 tok/s のデコード速度を達成したと主張しました。
バッチサイズ 1 では、推論スタックにオーバーヘッドをごまかす余地がありません。起動コストを分散させるためのバッチもなければ、パイプラインの待ち時間を埋めるための並行処理もなく、巧妙なタイリングで計算効率を上げるほどの演算強度もありません。クリティカルパス上のマイクロ秒 1 つが、そのままユーザーの待機時間となります。
本稿では、4 枚の NVIDIA Blackwell GPU 上で動作するハイブリッド線形アテンション型 MoE モデル「Ling-3.0-flash」において、このバッチサイズ 1 の限界値をさらに引き下げる取り組みについて解説します。2 つのスペキュラティブ・デコーディングのアプローチを取り上げます。
一つは NEXTN/MTP パスで、単一リクエストのデコード速度を 288 tok/s から 606 tok/s に向上させ、平均 TPOT(トークン生成時間)を 3.33 ms から 1.53 ms に短縮しました。もう一つは DSpark で、同じスタック上に構築された信頼度スケジューリング型スペキュラティブ・デコーダーです。1,000 リクエストのバッチ処理では、平均 TPOT 0.78 ms、受け入れトークン数(accept length)9.95 で 1,120 tok/s を達成しました。
この比較は厳密な条件で行われたものです。NEXTN と DSpark は同一マシン上で同じコマンドで測定されており、平均 TPOT は 1.9 倍短縮されています(3.33 ms から 0.78 ms)。本稿の後半では、その時間差がどこに生じていたのか、そしてそれをどう克服したのかを詳しく解説します。
Highlights
- 最終結果:平均 TPOT が 54% 短縮(3.33 ms → 1.53 ms)、単一リクエストのスループットは 2.1 倍向上(288 → 606 tok/s)。厳密な比較条件における 1,000 リクエストバッチでは、DSpark が平均 TPOT 0.78 ms と 1,120 tok/s を達成しました。
最適化のステップは、ホスト側の先行実行から始まり、PDL の連鎖、カーネル最適化を経て、最終的に DSpark に至りました。ステップごとのホストピンを削除することで、準備処理を GPU 作業の裏側に隠せるようになり、PDL が MoE、ルーター、KDA、およびアールリダクション経路を結びつけました。2 つの融合処理と KDA の再調整、そして bf16 ルーター/lm_head GEMM を適用したことで、残りの GPU におけるクリティカルパスが短縮されました。
数値精度を帯域幅の制御ノブとして利用するアプローチです。ルーターゲートと lm_head を fp32 から bf16 に移行させたことが、構造的変更以降で最も大きな変化となり、性能向上は約 10% に相当します。
測定における厳格な姿勢も重要です。ホスト側の結論を出す前にプロファイル済みと非プロファイル済みの較正を行い、冷間状態のウェイトマイクロベンチマークを実施しました。また、単一のウィンドウでのピーク値ではなく、平均 TPOT に基づいて A/B テストを行いました。
DSpark は、検証ステップごとにコミットされるトークン数を引き上げます。具体的には、並列度 1 の条件下で推定長 9.95 を受け入れ、スループットは 1120 トークン/秒を達成し、平均 TPOT は 0.78 ms となりました。同じ 1000 リクエストのベンチマークにおいて NEXTN と比較すると、これは平均 TPOT が 1.9 倍低いことを意味します。
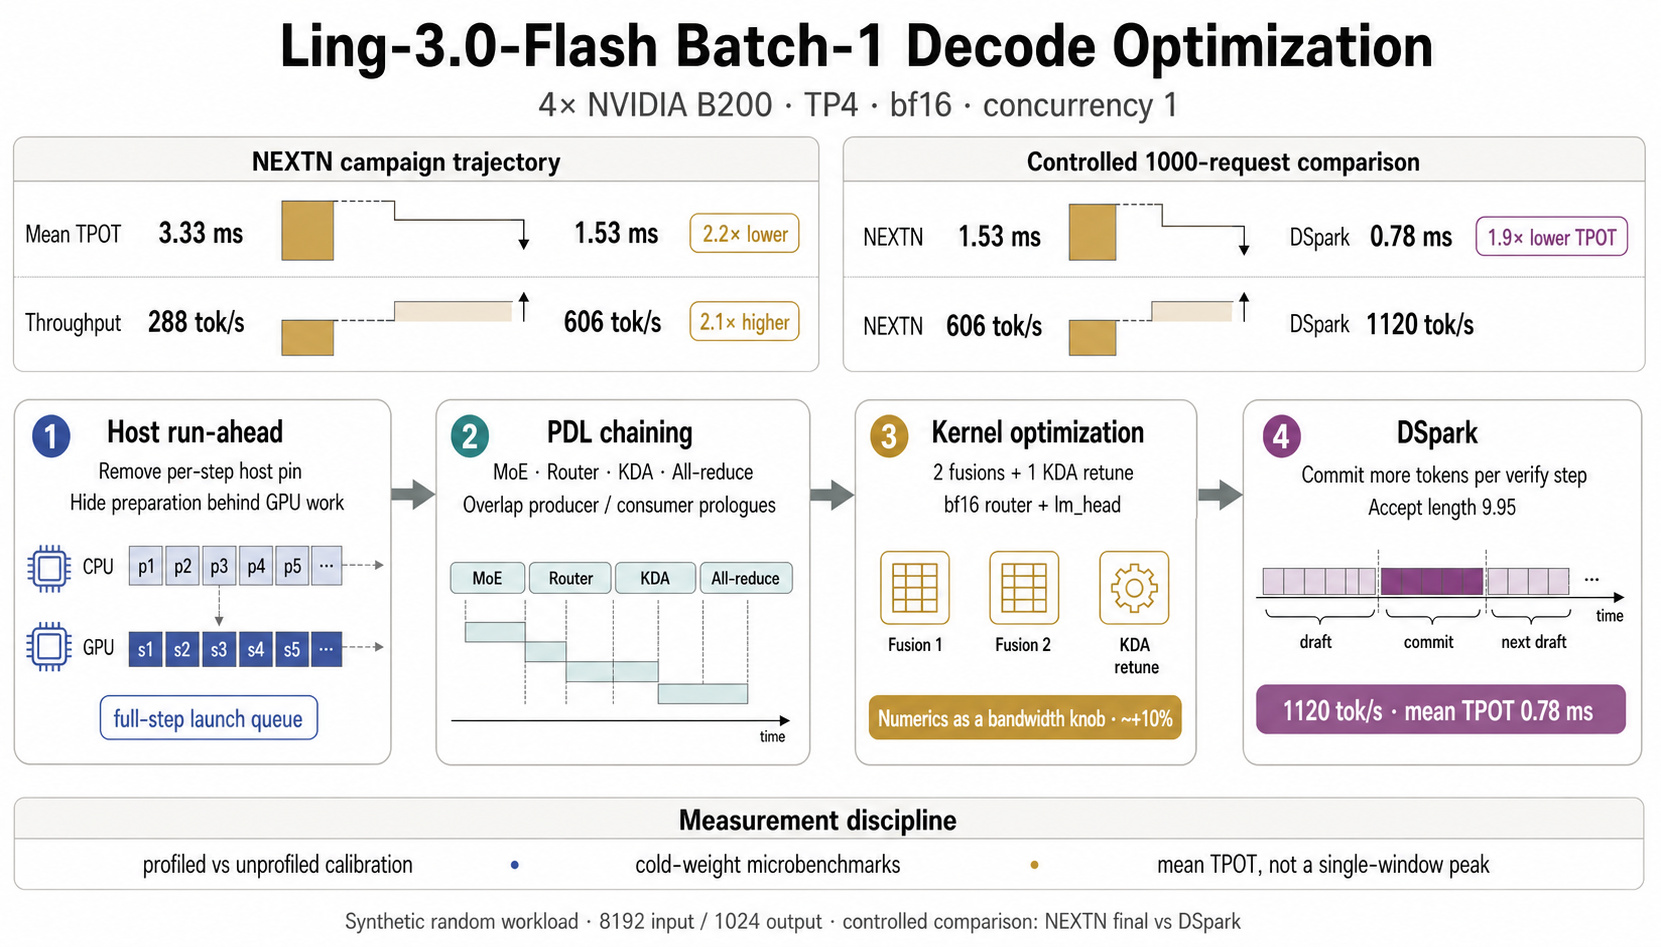
図 1. 4 つの構成における主要な結果。
| メトリクス (8192-in / 1024-out、単一並列度、greedy、TP4 bf16) | ベースライン | draft-extend グラフ修正後 | NEXTN、チューニング済み | DSpark 使用時 |
|---|---|---|---|---|
| 平均出力スループット | 288 tok/s | 526 tok/s | 606 tok/s | 1120 tok/s |
| 平均 TPOT | 3.33 ms | 1.76 ms | 1.53 ms | 0.78 ms |
| 中央値 TPOT | — | — | 1.56 ms | 0.51 ms |
| ピーク出力スループット | — | — | 1099 tok/s | 1945 tok/s |
| 受け入れ長さ | 3.14 | 3.13 | 3.25 | 9.95 |
GSM8K の結果では、同じ構成で精度 0.889、無効率 0.000、レイテンシ 341.5 秒、出力スループット 511.1 tok/s を記録しました。
すべての実行は、Ling-3.0-flash モデルを Blackwell GPU 4 基(TP4)、bf16、並行度 1、greedy decoding で動作させました。負荷は固定の 8192 トークン入力 / 1024 トークン出力ランダムワークロードです。左から右へ、列はそれぞれ初期 NEXTN ベースライン、draft-extend グラフ修正後の NEXTN、最終調整済み NEXTN、そして DSpark を示しています。最初の 2 つは短期間のキャンペーンチェックポイントであり、最後の 2 つは制御された比較結果で、どちらも同一マシン上で同じ 1000 リクエストに対して測定されています。ピークスループットは、固定の 1 秒間窓における最大値であるため、最終 2 つの実行間でのみ比較しています。
ここで重要なのは 2 つの定義です。これらが、並行度 1 の場合でも出力スループットが平均 TPOT の単純な逆数にならない理由を説明します。SGLang の TPOT は TTFT を含んでおらず、一方、出力スループットは総出力トークンをベンチマークの全体壁時計時間で割った値です(bench_serving ガイド参照)。本記事の主要なベンチマーク実行ではすべて合成 random ワークロードを使用しており、特に許容長はプロンプトと出力分布に依存します。したがって 9.95 はモデル自体の値ではなく、このワークロードにおける許容長です。
モデル
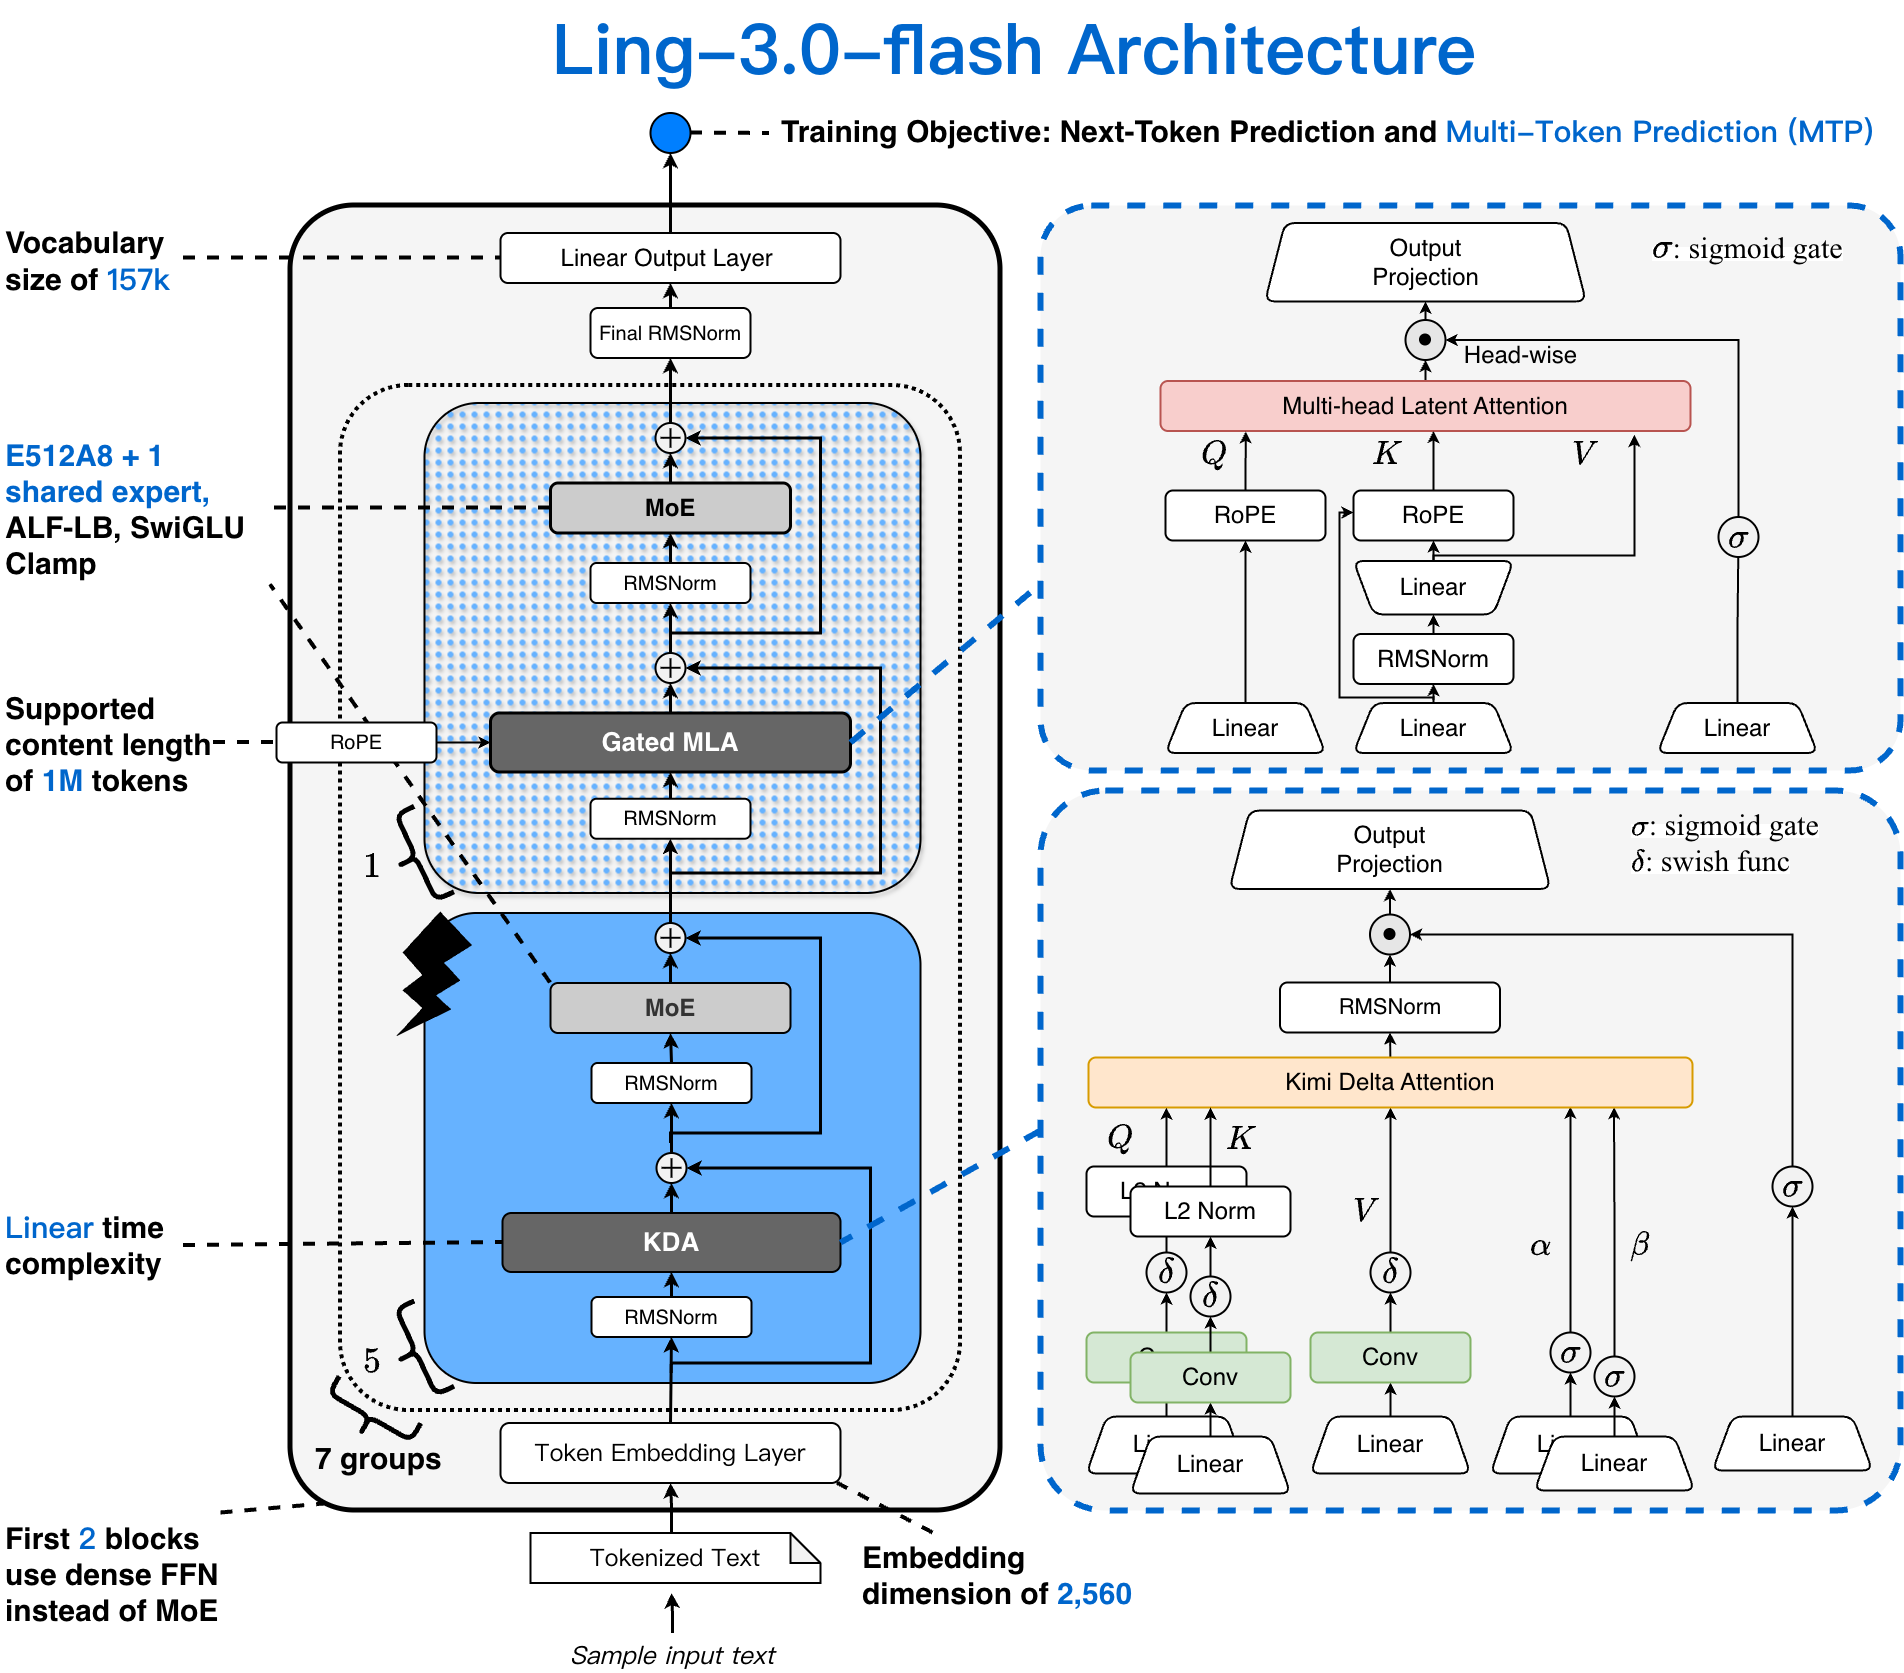
図 2. Ling-3.0-Flash のアーキテクチャ:512 エキスパートを持つ MoE(Mixture of Experts)モデルにおいて、35 層の KDA 線形アテンション層と 7 層の MLA 完全アテンション層が交互に配置された全 42 層構成。
Ling-3.0-flash はハイブリッド・アテンションを採用した MoE モデル(BailingMoeV3)であり、その特徴は名前の通り「ハイブリッド」にあります。
| レイヤー数 | 合計42層:35 KDA線形アテンション + 7 MLAフルアテンション |
|---|---|
| MoE(Mixture of Experts) | ルーティングされるエキスパート512個 + 共有1個、トップ8 (+1)、moe_intermediate_size 768 |
| 隠れ層サイズ | 2560 |
| 語彙サイズ | 約157k、vocab-parallel lm_headを介して提供 |
| 重みサイズ | bf16でランクあたり約63 GB |
| デプロイメント構成 | NVIDIA Blackwell GPU 4基、TP4、bf16、NEXTN推測デコーディング |
アテンション層の 6 分の 5 が KDA(Key-Value Distillation Attention)です。これが、8k のコンテキスト長において最終プロファイルでステップあたりの MLA アテンションコストがわずか 244 µs に抑えられる理由であり、このモデルがバッチサイズ 1 のターゲットとして適している根本的な理由でもあります。アテンションのコストが低く、バッチサイズも極めて小さいため、クリティカルパスに残るのは重み帯域幅と起動レイテンシのみです。まさにこの記事で取り上げているのがその領域です。
バッチサイズ 1 のステップの形状
NEXTN 推測デコーディングを用いて steps=5, topk=1, draft_tokens=6 でデコードを行います。1 つのデコードステップは、リレー方式で実行される 3 つの CUDA グラフから構成されます。
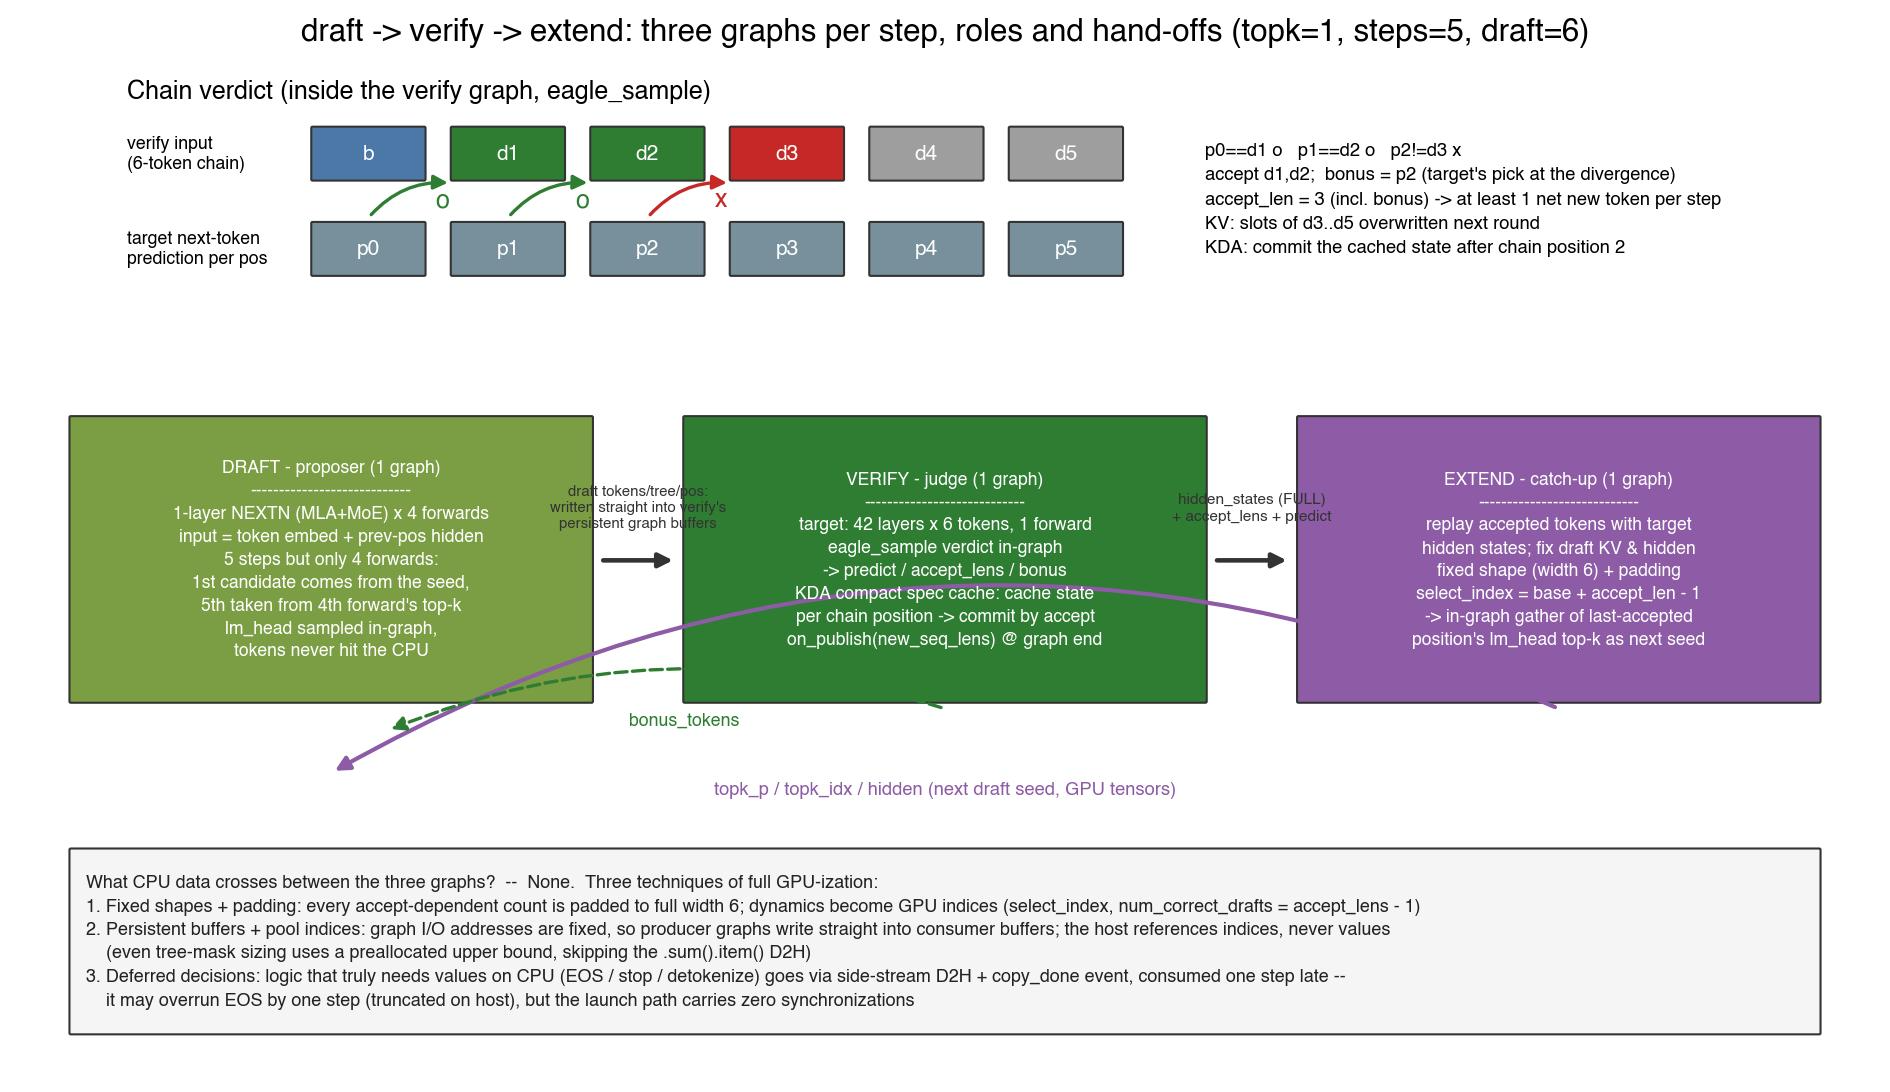
*Figure 3. ステップあたり 3 つのグラフ。ドラフトモデルが 6 トークンのチェーンを提案し、ターゲットモデルはこれら 6 つを一括で単一の順方向計算(フォワード)で評価します。また、拡張グラフ(extend graph)では、受け入れられたプレフィックスをターゲットモデルの実際の隠れ状態を用いて再生成し、次のラウンドのシードを生成します。判定自体(eagle_sample)は検証グラフ内で行われ、ホスト側が「何トークンが受け入れられたか」を知るには 1 ステップ遅れて通知されます。
ドラフトモデルは単層の NEXTN モデルで、自己回帰的に実行されます。5 つのステップがありますが、フォワード計算は 4 回のみです。なぜなら、最初の候補は前回のラウンドからのシードから得られ、5 番目のトークンは 4 回目のフォワード計算の結果からトップ k を読み取る形で決定されるからです。検証(Verify)では、6 つのチェーン位置すべてに対して、42 レイヤーからなるターゲットモデルを単一の順方向計算で処理します。拡張(Extend)では、ドラフトモデルが自身の推測しか見てこなかった KV キャッシュを修正し、次のラウンド用のシードを返却します。
CPU 上でグラフ間をやり取りするデータは事実上ゼロです。固定形状とパディングにより、受け入れ依存の計算はすべて GPU インデックスとして扱われ、ホスト側の値にはなりません。永続バッファによってプロデューサーグラフが直接コンシューマーバッファへ書き込み可能となり、CPU 側で実際の値が必要となる判断(EOS やストップ文字列、デトークナイズ)のみが、1 ステップ遅れて消費される copy_done イベントを介したサイドストリームの D2H 経路を通ります。この設計のすべては、この特性の上に成り立っています。
空の時間が二種類ある
プロジェクト開始時、GPU はステップの約 3 分の 2 を稼働していました。バッチサイズ 1 の場合のアイドル時間は二つのタイプに分けられ、それぞれ原因が異なるため対策も全く別物です:
- ホストモードでのアイドル時間。1 ステップあたりグラフを 3 回再生し、その内部で数百個のカーネルノードが実行され、グラフ間のつなぎ目には Python の処理コードが入っています。(これは「順伝播」ではなく「再プレイ」です。ドラフトグラフのキャプチャされた本体には 4 つのドラフト順伝播が含まれているため、自己回帰的なドラフトループにかかるコストは 4 回の順伝播ではなく、1 回の再プレイで済みます。)もしホスト側の 1 ステップあたりの処理時間が GPU のステップ時間より長くなると、GPU は待ち状態(スターブ)に陥ります。解決策は、ホスト側の作業を隠蔽し、縮小することです。
- GPU モードでのアイドル時間とコスト。ホスト側の負荷が隠された後に残るのは、重みの帯域幅(各 MoE レイヤーでステップあたり約 94 MB の活性化済みエキスパート重みをコールドロードする)と、数百個の小さなカーネルノードに固有のレイテンシフロアです。バッチサイズ 1 ではこれらを分散させることはできません。解決策は、データ型(dtype)の最適化、融合処理、および起動依存関係に基づくスケジューリングです。
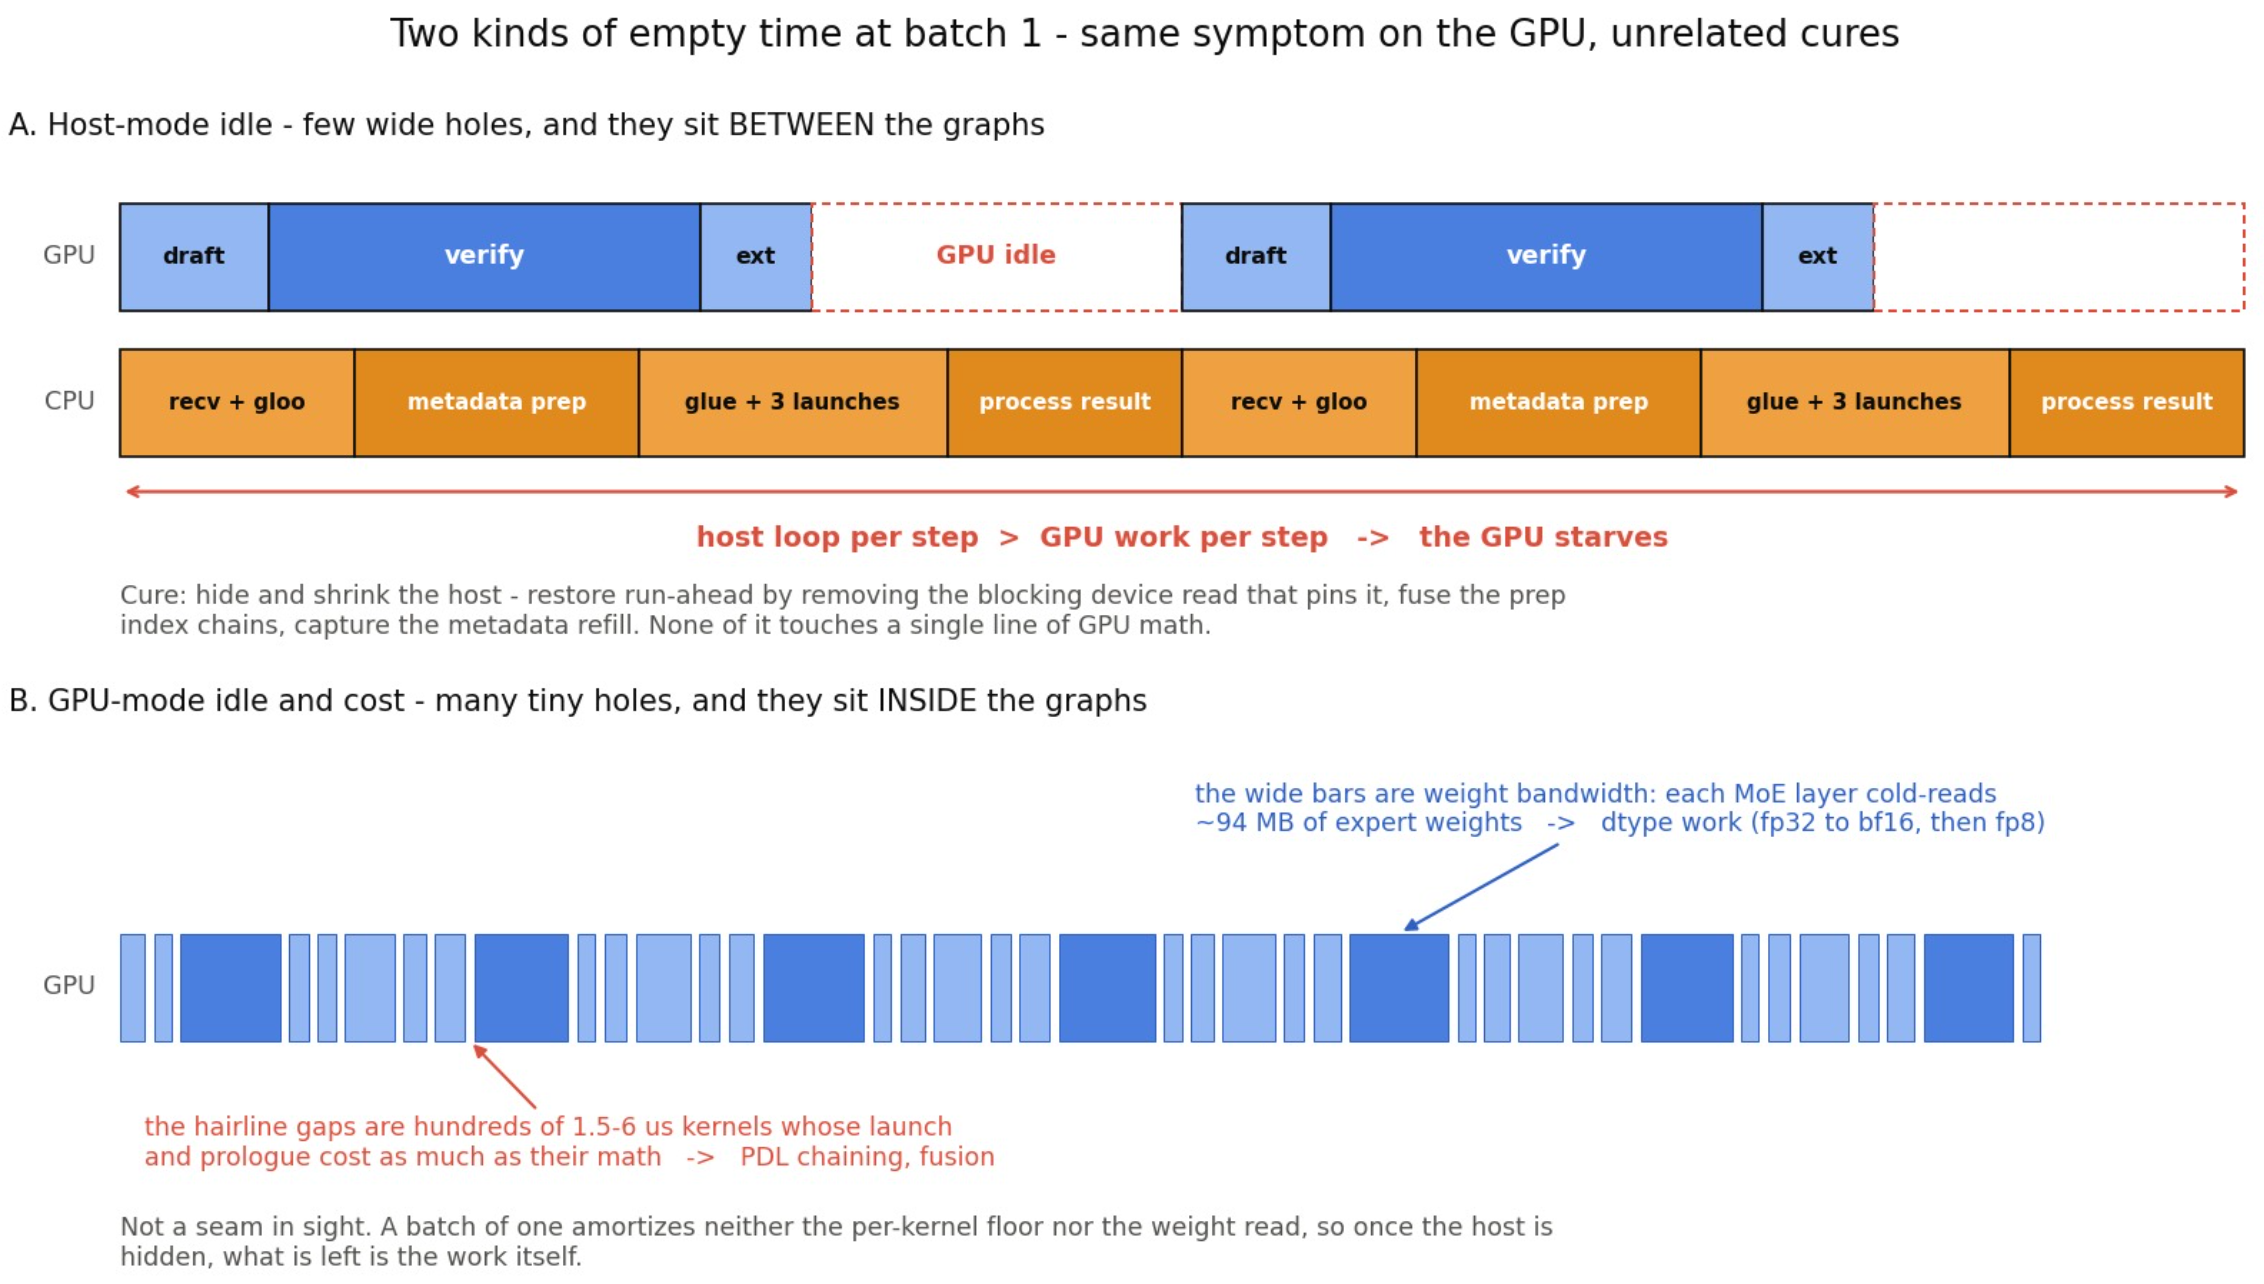
*図 4. 2 つのアイドル形態。上段:ホストループが GPU の処理時間より長いため、隙間は少なく幅広で、グラフ間の継ぎ目に位置します。下段:ホスト側の待ち時間が隠れた状態では、残るのは数百個の 1.5〜6 µs のカーネルノードです。これらの起動にかかる最低時間は演算処理と同等になり、重みの読み込み自体も含まれます。
これら 2 つのアイドル形態は、TPOT(Token Per Output Token)のステップ時間側の課題を説明しています。もう一つの重要な要素は、各ステップでコミットするトークン数です。平均 TPOT は「ステップ時間 ÷ 平均受け入れトークン数」で計算されます。
本稿では、これらの要素を改善するためのアプローチを順を追って解説します。ホスト側の先行実行と継ぎ目での作業処理により、ホストモードのアイドル時間を解消できます。PDL(Prefill Data Layout)、データ型の変更、融合処理、再調整を行うことで GPU のクリティカルパスを短縮可能です。さらに、推論のチューニングや DSpark を活用することで、ターゲットステップあたりのコミットトークン数を増やすことができます。なお、D2H 読み込みがブロック要因となってホストピンが発生した場合は、後ほど DSpark が最初のカテゴリ(アイドル時間)の問題にも再対応します。
機械を直す前に、測定器の精度を整える
以下の数値はすべて、測定環境の 3 つの特性によって決定されます。
プロファイラーはホスト側のイベントを過大評価する傾向があります。CUPTI は記録する各ホストイベントにオーバーヘッドを追加するため、同じ構成でプロファイル実行したステップの計測値が 5.2 ms である一方、未プロファイル実行時の TPOT と受け入れ長から逆算した実際のステップ時間は 4.9 ms です。この 0.3 ms の差は、私たちが分析しようとしていたホスト側の影響と同程度のオーダーであり、プロファイラー付きのトレースでは、実際には存在しないランク間の待機時間が検出されてしまう可能性があります。
GPU カーネルの実行時間はハードウェアタイムスタンプから取得されるため、ホスト側の計測値よりも信頼性が高いですが、完全に無欠ではありません。トレーシング自体が起動タイミングや並列処理、キャッシュ状態、CUDA グラフの実行に影響を与えるためです。Nsight Systems のドキュメントでも、CUDA やグラフノードのトレーシングには潜在的に大きなオーバーヘッドが生じると記載されています(ユーザーガイド)。そのため、本稿で導き出されたホスト側の結論はすべて、プロファイル実行と未プロファイル実行の比較による較正を経ています。
マイクロベンチマークでは、コールド状態のウェイトカーネルに対して楽観的な条件が設定されています。あるカーネルを繰り返し呼び出すループでは、2.6 MB のゲートウェイトが L2 キャッシュに保持されたままになりますが、実際のモデルでは同一レイヤーへの連続呼び出し間に約 94 MB のエキスパートトラフィックによって L2 がフラッシュされます。その結果、ホット状態では 7 µs、コールド状態では 11 µs と、ライブラリ GEMV のランキングを逆転させるほどの差が生じます。
スループットのピーク値は単一のウィンドウ統計に過ぎません。ベンチマークの最大値は固定された 1 秒間のグリッド上での最大値であり、±5% 程度の位相誤差を含んでいます。TTFT(Time to First Token)や TPOT(Time Per Output Token)のシフトはグリッドを再スライスするため、平均スループットが 2.3% 改善されたとしても、数値上は 909 から 858 への低下として表示されることがあります。固定シード下では両方の測定値が正確に再現されるため、再現性だけで信号とノイズを区別することはできません。A/B テストの判断基準は「平均 TPOT × 平均アcept 長」の積に基づいています。これはステップ時間の推定値であって直接計測された値ではありません(集約値の積は、積の集約とは異なるためです)。しかし、この指標は実行間で安定しており、今回のテストではアcept 長のドリフトにも影響されないため、A/B 判断基準として適切です。私たちはピーク値を報告していますが、最適化の目標にはしていません。
正しさについては独自の検証ゲートが設けられており、すべての変更前に適用されました。具体的には、256 トークンの貪欲生成におけるバイト単位の完全一致確認、アcept 長の変化が 0.05 以内であることの確認、そして温度サンプリングされたリクエストをインターリーブさせた後の再実行による状態汚染の検出です。丸め処理に本質的な影響を与える変更(bf16 ゲートや単一丸め結合など)については、コミットメッセージで明示し、ビットレベルの一致ではなくアcept 率やタスクメトリクスでの検証を行いました。
ホスト側を先行実行させる
これは今回のキャンペーン全体を支える構造的な変更であり、ホストモードにおけるアイドル状態の修正です。
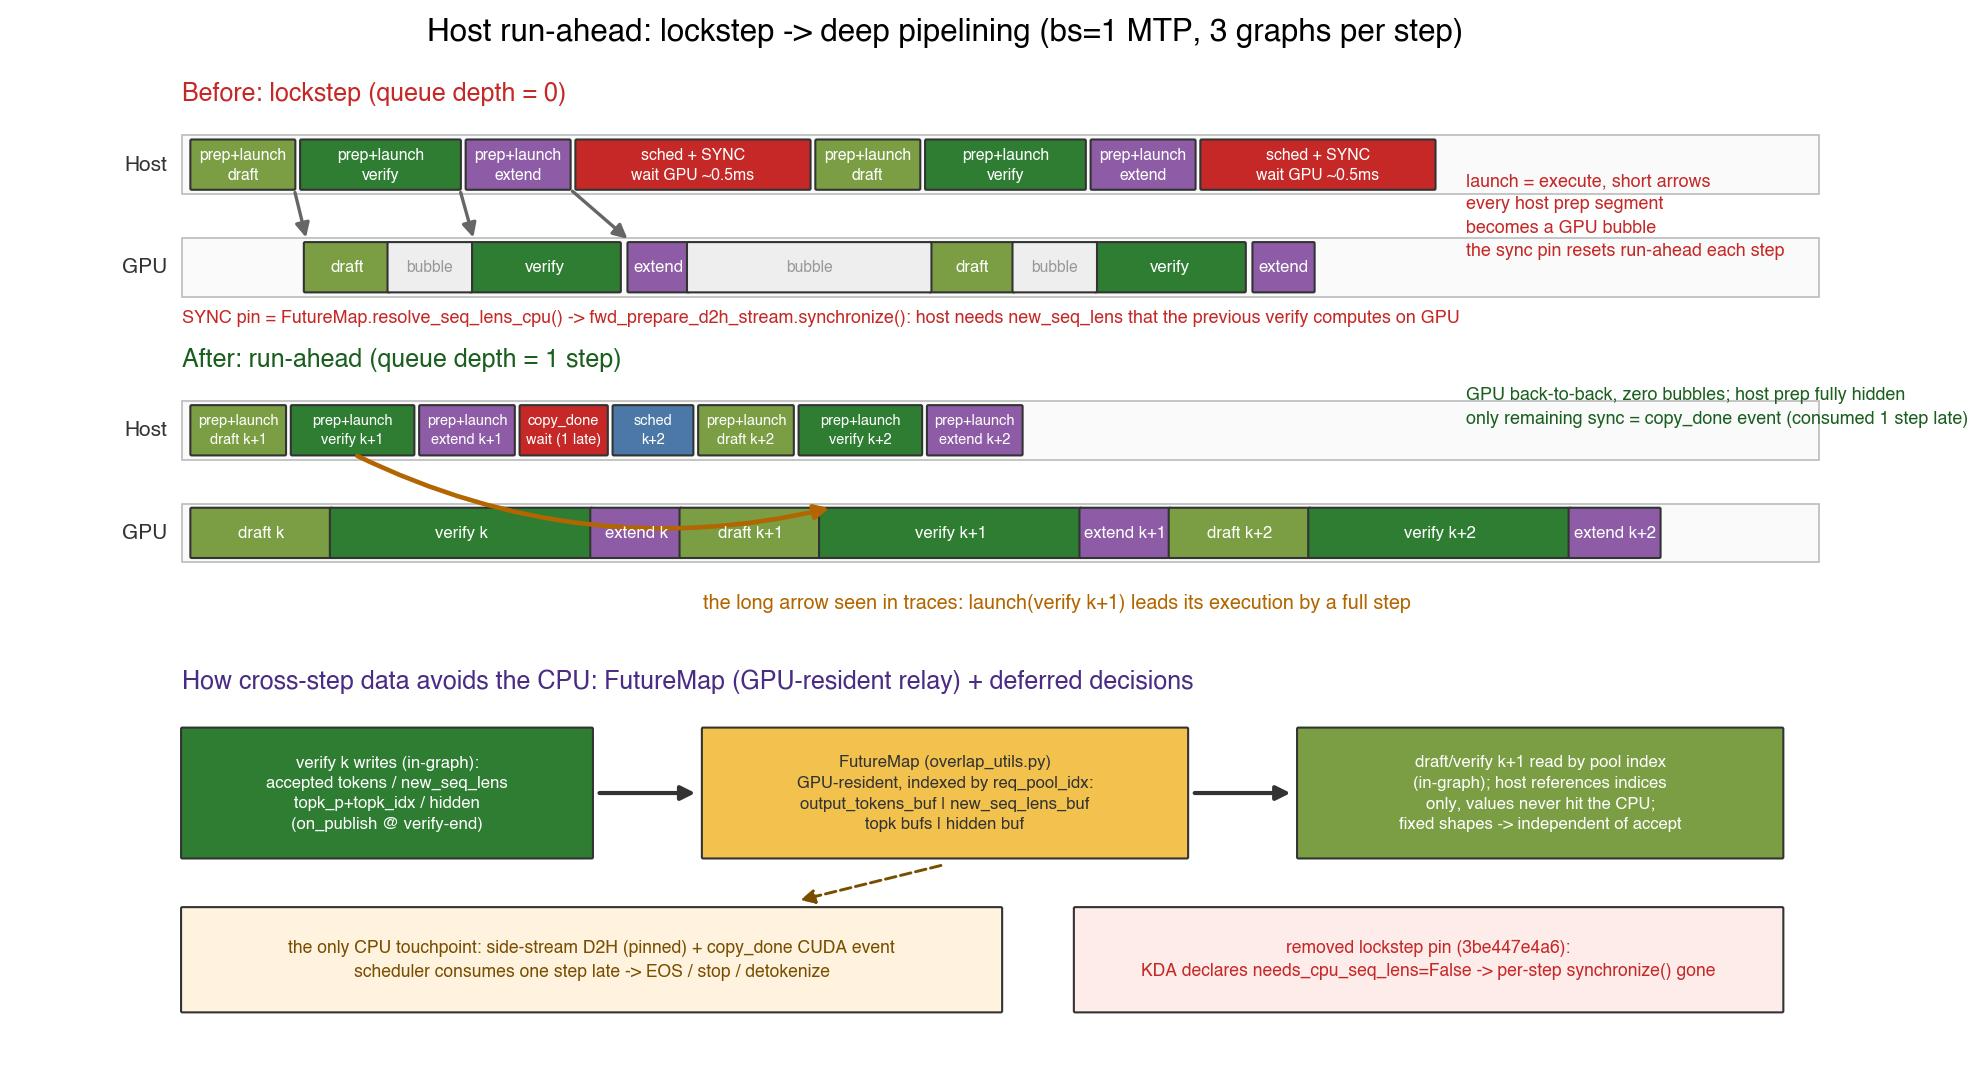
図 5:ロックステップから深いパイプライン化へ。変更前:各ステップでホストは GPU で前の検証グラフが完了するのを待って resolve_seq_lens_cpu にブロックされ、ランアラウンド(先行実行)がゼロにリセットされるため、各ホストのプレパ segment が GPU のバブル(アイドル時間)となります。変更後:キューは 1 ステップ分深く保たれ、検証 k+1 の起動がその実行を 1 ステップ先取りし、残された同期は copy_done イベントのみで、これが 1 ステップ遅れて消費されます。
cudaGraphLaunch は常に非同期であり、GPU 上でのドラフト→検証→拡張の順序付けも無料(オーバーヘッドなし)です。同じストリーム上で FIFO で処理されるため、検証がドラフトを待つ必要があるかどうかは問題ではありません。真の問題は、ホストが各ステップで GPU の進捗に固定されているかどうかでした。
spec-v2 の仕様では、スケジューラは受け入れ長(accept length)を把握していません。そのため、次のバッチを構築する際に FutureMap.resolve_seq_lens_cpu() が GPU から new_seq_lens を取得します。これは公開イベントでゲートされ、専用ストリーム上でコピーされた後、synchronize() されます。
ホストはマイクロ秒スケールの転送を待っているのではなく、直前の検証グラフの完了を待っていました。1 ステップあたりの平均コストは 485 µs で、ランアラウンド深度(run-ahead depth)は毎ステップごとにゼロにリセットされています。
原因は、spec-v2 に関与するすべてのバックエンド間で OR 演算された needs_cpu_seq_lens フラグです。trtllm_mla は 3 つの役割すべてで False を宣言しています。一方、兄弟となる線形アテンション...
バックエンドの GDNAttnBackend と Mamba2AttnBackend は、両方とも明示的に False を宣言しています。
KDAAttnBackend は明示的に宣言しておらず、2 つの兄弟クラスと同じベースクラスのメタデータコードを実行しているにもかかわらず、ベースクラスのデフォルト値である True を継承してしまっています。
needs_cpu_seq_lens = False を宣言することで、OR 演算子が統合され、ステップごとの同期が不要になりました。正しさの根拠は個々の要素に対するものです。KDA のメタデータは CPU ミラーを参照せず、リプレイ用のパディングは forward_batch.num_padding から取得されます。
なぜホストは、ステップ k が何を受け入れたかを知る前に、ステップ k+1 を起動できるのか?その答えは、値が CPU に触れることがないからです。FutureMap は GPU 上に常驻する中継役です。ステップ k のグラフは、出力トークン、new_seq_lens、top-k の確率、そして隠れ状態を、req_pool_idx でインデックス付けされたデバイスバッファに書き込みます。一方、ステップ k+1 のグラフは、同じインデックスを使ってそれらを読み出します。ホストが扱うのは、すでに把握しているインデックスのみです。
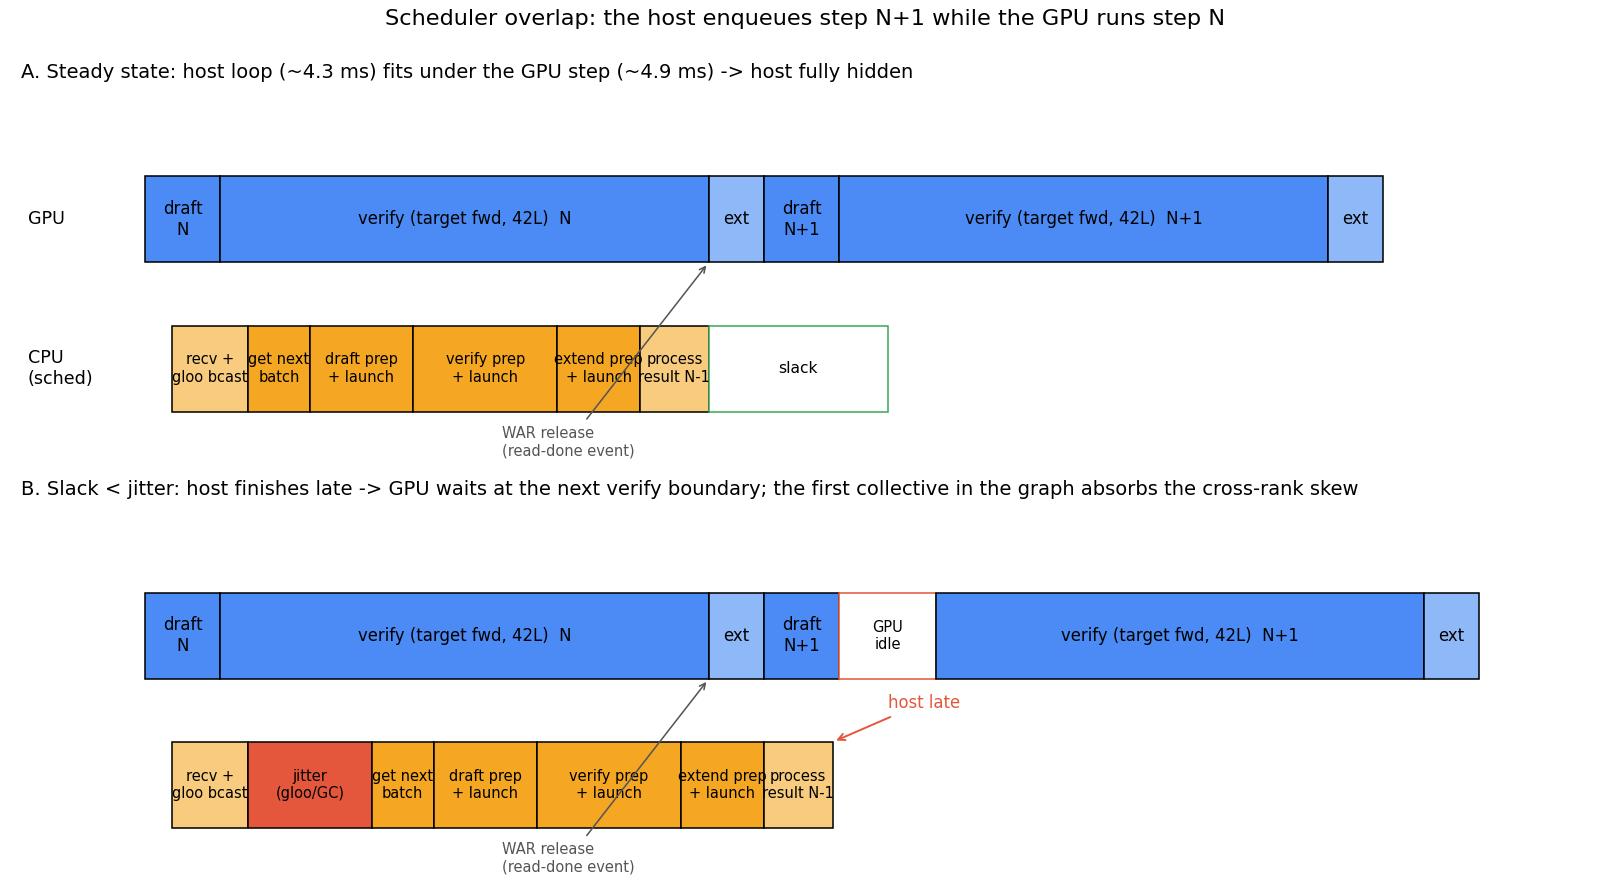
図 6. スラックの発生場所。パネル A:ホストループ(約 4.3 ms)が GPU ステップ(約 4.9 ms)より短いため、完全に隠蔽されています。パネル B:ジッター(gloo ブロードキャストや GC パースなど)がスラックを超えると、ホストの処理が遅れて GPU が次の検証境界で待機し、グラフ内の最初の集合演算がランク間のスキューを吸収します。
ランアラウンドの実装は、ホストコストの構造も変えます。各ランクがステップごとに自らのホスト時間を直接負担するのではなく、キューの余裕をすべて使い果たしたランクだけがそのコストを負担します。
4 ランクからなるトレースでは、まさに 1 つのランクがこの状態にありました。そのランクのスケジューラセグメントは兄弟ランクより 5〜10 倍長く実行され、ドラフトグラフの起動が 40〜80 マイクロ秒遅れ、ドラフトと検証の接続部(seam)での処理時間が他社の中央値よりも +165 マイクロ秒上回りました。さらに、GC(ガベージコレクション)に特徴的な 400〜750 マイクロ秒のスパイクが周期的に発生していました。残りの 3 ランクは、そのランクを待ち受けるために、すべての合流点でスピンの待機状態となりました。
この現象を一般化できる診断ポイントは、「カーネルの実行時間がそのまま作業量ではない」という事実です。20 KB の埋め込みベクトルに対するアロールドゥが 150〜480 マイクロ秒表示されても、それが遅いわけではありません。それは時間的なズレ(スケー)を吸収しているだけであり、どのランクが遅れているかを特定するには、クロスランク間の時間同期を確認する必要があります。
接続部の解消
ロックステップピンが不要になったことで、グラフ間の接続部(seams)を縮小する価値が高まりました。CUDA グラフの再生前に、ステップ固有のアテンションメタデータ(kv インデックス、ブロックテーブル、Mamba の状態スロットなど)は、生データの req_to_token と seq_lens から再構築され、グラフにキャプチャされた静的バッファへ書き込まれます。このリフィル処理は各ステップで即座に実行され、接続部の大部分を占めています。
バッチサイズが 1 の場合、これは純粋にホスト負荷となります。各オペレーションのディスパッチに 5〜15 マイクロ秒、実行に 1〜4 マイクロ秒の時間がかかります。
私たちは 2 つのレベルでアプローチしました。まず、インデックスチェーンを融合させます。assign_extend_cache_locs_uniform はカーネル内で終了オフセットを計算します(均一な draft_token_num の展開により、行間でのプレフィックス和は不要になります)。また、_fused_state_indices_kernel によって、ガザース、変換、パディングシンボル書き込みといった処理が統合されます。
1 つの起動でコピーを実行し、パディングされた行に対して req_pool_indices をゼロ化するといった副作用を慎重に維持します。この関数内では不要ですが、グラフ内の他のキャプチャ済みカーネルは、境界内での集計処理のためにこれに依存しています。 (原文の技術表記: copy_)
次に、リフィル自体を (bs, forward_mode) をキーとする小さな CUDA グラフとしてキャプチャします。これは、再生契約がすでに保証しているポインタ安定性の性質によるものです。再生時の ForwardBatch ビューは、バックエンドのランナーに対して静的なバッファとプール内のテンソルのみを提供するため、準備シーケンス全体でアドレスが固定されます。
これを取り巻く安全性メカニズムは 4 つあります。まず、2 回のイージェルウォームアップにより、Triton の JIT コンパイルやオートチューニングをキャプチャ外で行います。次に、再生前に各バックエンドの forward_metadata オブジェクトのスナップショットを復元します(グラフはデバイス操作を再生し、スナップショットは Python ポインタを復元します)。さらに、キャプチャ失敗時に警告を発して永続的にイージェルフォールバックする仕組みも用意されています。最後に、パディング、TBO、pd_mux、LoRA に対するガード機能を実装しています。
この機能は SGLANG_ENABLE_METADATA_GLUE_GRAPH 環境変数でオプトイン形式で提供されています。また、DFLASH ファミリーの推論では強制的に無効化されます。これは、そのパスがホスト側でステップごとにアテンション計画を再構築するためであり、リフィル時の情報をキャプチャすると、その時点で計画が凍結されてしまうからです。
キャプチャ可能な範囲には明確な境界線が存在します。その基準は、デバイスカーネルのみで構成されるリフィルが永続バッファへ書き込む場合に限られ、FlashInfer 風の plan() を経由するものは対象外となります。ドラフト側はこの条件を満たしていません。マルチステップのドラフトバックエンドが、メインの EAGLE グラフによって既にキャプチャ済みのラッパーを再 plan() するためです。この再計画をセカンダリグラフに記録すると、再生時にラッパーの内部状態が破損します。
また、キャプチャは冪等性(何度実行しても結果が変わらない性質)を持つ必要があります。
trtllm_mla の _init_cuda_graph_metadata は、呼び出しごとに新しいテンソルを割り当てて decode_cuda_graph_metadata[bs] エントリを書き換えるため、2 回目のキャプチャ以降は以前のグラフが解放されたメモリを読み込んでしまう問題があります。
PDL: 小さなカーネルのレイテンシフロアを積み上げる
バッチサイズ 1 のステップでは、短い時間枠内で数百のカーネルノードが実行されます。この規模になると、起動やプロローグにかかるコストは演算処理そのもののコストと同等になります。Programmatic Dependent Launch (PDL) を利用すると、生産元カーネルがまだ実行中の段階で、依存するコンシューマーカーネルを SM(ストリーミングマルチプロセッサ)上にスケジューリングできます。これにより、コンシューマーは生産元の出力に依存しない処理をすべて先行して実行し、gdc_wait() によるフェンスは必要なタイミングのみで実施されます。
依存読み込み。
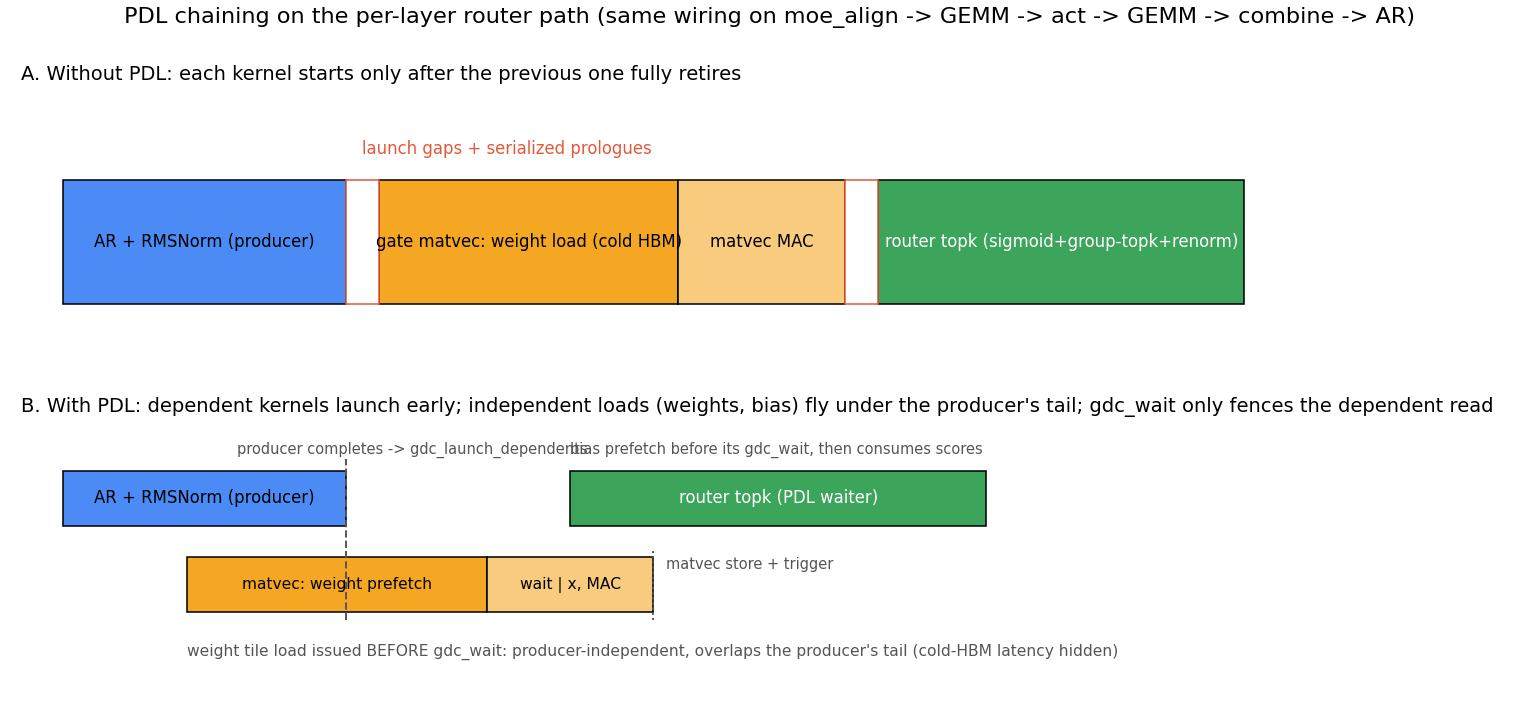
図7:ルーター経路におけるPDLの効果。PDLがない場合、各カーネルは前のカーネルが完全に完了するまで開始されず、ゲート行列ベクトルの冷たいHBM重み読み込みがクリティカルパス上に存在します。一方、PDLを適用すると、重みタイルの読み出しが生産者に依存しないため、gdc_wait() の前に発行され、2.6 MBの冷たい読み込みが生産者の尾部の下を通過します。ルーターは同様の手法でバイアスのトップKをプリフェッチします。
私たちは3つのチェーンを接続しました。MoEメインチェーン(moe_align → up-GEMM → 活性化関数 → down-GEMM → 結合 → all-reduce)、ルーターチェーン(正規化 → ゲート行列ベクトル演算 → top-k)、そしてKDAチェーン(conv1d_update → 再帰的デルタ則 → ゲート付き正規化)です。この設計において、2つの重要なポイントがあります。
プロデューサー非依存の読み込みは、待機処理の前に実行されます。これが図における最大のポイントであり、PDL が単なる起動オーバーヘッドの削減にとどまらず、レイテンシ制約のあるカーネルにおいて真価を発揮する理由です。
Inductor カーネルでは PDL 属性を付与できません。小規模な MoE の結合処理は torch.compile で生成されたカーネルでしたが、チェーンに統合するにはリポジトリ内の Triton リダクションと GDC に置き換える必要がありました。これには数値的な副作用が生じました。従来のパスでは 2 回丸められていたのに対し、新しいパスでは fp32 の sum × scale を計算し、最後に 1 回だけキャストを行います。その結果、わずかに精度が向上しますが、ビット単位で完全一致するわけではありません。この点はコミットメッセージでも明記されています。
後ほど、PTX の griddepcontrol に関する発見を踏まえてセマンティクスを更新しました。launch_dependents は従属する起動の解放のみを行う一方で、コンシューマー側の wait はプロデューサー・グリッドの完全な引退(retirement)に対して常にフェンスがかかります。このトリガーをプロデューサーの末尾から、プロデューサー自身の wait の直後に移動させることで、コンシューマーのプロローグがプロデューサー本体のより広い範囲と重なるようにすることが可能になります。
これはテール(末尾)だけでなく、ある一つの前提条件に依存します。それは、コンシューマーがプロデューサーの出力を読み出すたびに、早期起動と各読み出し操作の間に自らの gdc_wait() を維持しなければならないという点です。これは各コンシューマー固有のプロパティであり、網羅的な保証ではないため、カーネルごとに確認を行い、6 つのカーネルを修正しました。
初期トリガーがもたらす効果もまた決定論的ではありません。ドライバーは依存するグリッドを早期に起動する可能性があり、どの程度のオーバーラップが発生するかは、その時点でのスケジューリングやリソース負荷に依存します(CUDA プログラミングガイド)。fused_moe は M ≤ 512 のチェックを介してこれを制御しています。プリフェッチ形状では、大きなコンシューマーグリッドを早期に解放するとプロデューサーの SM を奪ってしまいますが、デコード形状では純粋な利益となります。
PDL は純粋なスケジューリングのセマンティクスです。累積順序が変わらない変更はビット単位で同一性を保ちます。ゲート行列ベクトル演算は、4 つの GDC 状態(オン/オフ)すべてを比較するテストに合格しました。
2 つの融合と再チューニング
moe_alignはペア軸上で動作します。Triton による統合 MoE GEMM は、1 つの行がすべて同じエキスパートに属する block_size タイル単位でトークンを処理し、moe_align_block_size がその置換を構築します。
一般的なパスでは 2 つのカーネル起動が必要になります。すべてのエキスパートのオフセットが決まるまでトークンを配置できず、これらのオフセットはグリッド全体のスキャンから得られ、デバイス全体のバリアもカーネル境界でのみ存在します。1 回の起動で済む変種も存在しますが、これはスレッドごとのエキスパートカウンターを共有メモリに格納するため、64 以下のエキスパート数に制限されます。513 エキスパートのデコードでは常に 2 回の起動が必要でした。
置き換え手法はペア軸上で動作します。[NP, NP] のペアワイズ比較により、すべての (トークン、スロット) ペアをバケット内で安定したランクと、そのバケット内の人口数を一度に算出できます。各バケットのランク 0 を代表とする要素から、パディングされたカウント、バケット順序付きの排他的オフセット、公開される総数、およびブロックごとのエキスパート ID が導かれます。
この処理はエキスパート数に依存してスケールしないため、エキスパート数の制限がなくなります。明らかな代替案として、パディングされたエキスパート軸(最大 1024 バケット)に対してヒストグラムと cumsum を実行する方法がありますが、これは正しく動作するものの、置き換える 2 つのカーネルに比べてクリティカルパス上の単一 SM の作業量が約 3 倍増えることになります。これがペア軸を本稿の要として機能させている理由です。
参照実装からの2つの意図的な変更は、どちらも消費者側の不変性に基づいています。1つ目はバケット内の順序が原子スケジューリング順ではなくペアインデックスで安定している点です。各ペアは独自の出力行を書き込むため、消費者側では順序に依存しない処理が可能です。2つ目は、公開された総数を超えたバッファの末尾部分を書き込まないことです。これにより、消費者側のCTA(コンピュート・スレッド・アレイ)は読み込み前に早期終了できます。
ただし、ペアごとのテンソルが O(NP²) の計算量を要するという課題があります。NP=64 の場合、すべてのデータをレジスタに保持でき、実行時間は約 4 マイクロ秒です。これは CUDA の2カーネルパスと同等の性能です。一方、NP=256 に達するとローカルメモリへスプールされ、1回の起動あたり約 230 マイクロ秒のコストがかかります。ディスパッチゲートは numel ≤ 64 という条件でハードに設定されており、これを超えるバッチサイズでは CUDA パスへフォールバックします。
SwiGLU のアップ GEMM エピローグにおける最適化です。MoE(Mixture of Experts)層ごとに独立した活性化カーネルと、中間バッファへの書き込み・読み込みの両方を排除するため、silu(gate) * up を MoE アップ GEMM エピローグに統合します。
このレイアウトの工夫は、重みロード時に w13 に対して専門家ごとの行インターリーブを適用することです。これにより、ゲートとアップが同じ出力タイル内の隣接する偶数・奇数列に配置されます。各 GEMM 出力列が独立した内積計算であるため、インターリーブはビット単位で中立な操作となります。
ビット単位の整合性が重視されるのは、置換対象のカーネルが -use_fast_math フラグでコンパイルされているためです。この結果、エピローグでは mul 命令を一つずつ再現する形で出力されます。
__expf には ex2.approx.ftz を、除算には div.approx.ftz を使用し、乗算の結果に対して最終的な丸め処理を1回行う。
微妙な点ですが、FlashInfer は活性化関数を float でインスタンス化するため、乗算前に silu が bf16 になることはありません。ここで丸めると二重丸めが発生し、入力範囲の大部分で結果がずれてしまいます。これはドキュメントには記載されておらず、許容誤差チェックでも検出されません。入力の全範囲にわたって要素ごとのビット比較を行う必要があります。
KDA チェーン検証タイルの経済性について。融合された conv1d + ゲーティングデルタルール検証カーネルは既に存在しており、今回のコミットではそのチューニングを再調整したものです。グラフ内タイミングを伴うローテートコールドテストにおいて、Blackwell の曲線は T=6 で単調性を示します:BV=4 で 11.56 µs、8 で 12.53、16 で 12.83、32 で 14.26、64 で 20.7、128 で 38。各呼び出しあたり最大 19% の性能差で BV=4 が勝利します。これは、256 CTAs を 148 SMs で処理する際に 1.7 ウェーブが必要となる一方、q/k 畳み込みを 32 回複製する方が、シリアルチェーンを短縮するよりもコストが低いからです。V 次元のタイリングは K 次元の還元順序に影響を与えないため、num_warps=4 の条件下ではすべての BV がベースラインとビット単位で同一となり、再チューニングによる数値的なリスクはありません。
bf16 ルーターゲートおよび lm_head
最も大きな構造変更の一つは、データ型(dtype)の変更でした。バッチサイズ 1 の場合、ルーティングゲートと LM ヘッドは純粋な帯域幅のボトルネックとなります。各デコードステップで、MoE レイヤーごとのゲート重み(bf16 で 2.6 MB)や、語彙並列化された LM ヘッド投影行列をコールドリードする必要があり、読み込みを隠す演算処理が存在しないからです。これらを fp32 ではなく bf16 で実行することで、転送データ量が半分になり、全体として約 10% の性能向上をもたらしました。これはホスト側の先行実行(run-ahead)修正に次ぐ、単一の変更としては最大の効果でした。上記の他の丸め処理の変更と同様、この変更もコミットメッセージで明記され、ビットレベルでの完全一致ではなく、受け入れ時のトークン数やタスク指標によって検証されています。
推論下での KDA(キャッシュヒット率)
拒否された推論トークンは KV キャッシュのエントリを無害に陳腐化させますが、その時点で再帰状態が既に破損しています。線形アテンションと推論は、無料で共存できるものではありません。
これを可能にする仕組みは以下の通りです:検証フェーズでは、再帰処理を実行しつつ状態更新を無効化し、各チェーン位置の事後状態を中間バッファに書き出します。その後、判定が下された時点で、commit_mamba_states_after_verify 関数が最終的に受け入れられた位置に対応する状態を、永続的なスロットへコピーします。つまり「一旦保存し、後で確定する」という手順です。
これがコンパクトな推論キャッシュが topk=1 に制限される理由でもあります。チェーン構造の場合、受け入れられるプレフィックスは一意であり、状態を位置情報でインデックス付けできます。一方、ツリー構造では、受け入れられるパスはその中の一つに過ぎず、状態をツリーパス全体でインデックス化する必要があるためです。
プロファイリングの結果、KDA デコードは帯域幅にボトルネックがあることが示されました。主に K×V 状態における HBM トラフィックが要因です。そのため、融合処理やタイルの再調整を行った後には、さらに改善できる余地はほとんど残されていません。なお、Blackwell のピーク性能に対する実際の達成帯域幅を測定したわけではないため、これはロフライン解析の結果というよりは、形状に関する観察結果として捉えてください。
バッチ 1 における推測の経済性
重み帯域幅が支配的であることには、一見すると直感に反する帰結があります。それは、「より多くのトークンを検証しても、ほぼコストはかからない」という点です。4 トークンも 6 トークンも、読み込む重みは全く同じです。
バッチ 1 で推測の深さを増やすことは、追加ステップごとに 1 つ余分な軽量なドラフト順方向計算(ドラフトは単一層で構成されます)と、KDA チェーン検証再帰における逐次的コストの増加を意味しますが、その代償としてトークンの受け入れ長さを獲得できます。
我々はこれを仮定するのではなく、実際にスキャンしました(このスキャンは融合バンドルの導入以前に行われたものです。最適な設定はその後、以下に示すように変化しています)。
| ステップ / ドラフトトークン | 受容長 | 平均 TPOT | ステップ時間(算出値) | 定常状態のトークン/秒 |
|---|---|---|---|---|
| 3 / 4 | 3.11 | 1.51 ms | 4.70 ms | 662 |
| 4 / 5 | 3.37 | 1.45 ms | 4.89 ms | 690 |
| 5 / 6 | 3.45 | 1.55 ms | 5.35 ms | 645 |
ステップ時間の計算は「TPOT × 受け入れ長さ」で導き出された推定値であり、直接測定したものではありません。ステップ数を増やすごとにコストは約 4〜9% 上昇しますが、その分得られる受け入れ率の増加は幾何級数的に減少します(例:d5 から d6 にすると増加幅はわずか 0.08)。収支が合う条件はおおよそ Δaccept > 0.05 × accept です。最適な構成も状況に応じて変化します。例えば、融合バンドルが導入されてステップ時間が短縮された後は (5, 6) がより良い設定となりましたが、fp8 重みによって固定ベース部分がさらに圧縮されれば、再度チューニングが必要になるでしょう。
DSpark:高品質なブロックドラフティング
NEXTN の深さを調整するのは、形状が決まったアルゴリズムに対する一次元のノブ操作に過ぎません。より大きなレバレッジとなるのはアルゴリズムそのものの変更であり、今回のキャンペーンの後半では、DSpark を同じターゲットに移行し、バッチ 1 対応の処理を施すことに注力しました。
DSpark の独自性
DSpark アルゴリズム自体は公開されています。今回の取り組みは、この公開されたレシピを Ling-3.0-flash に適応させ、長文コンテキストにおけるオンライン蒸留と、バッチ 1 対応の Blackwell サービングスタックへ統合することです。私たちのアプローチには主に 4 つの特徴があります。
分布に合わせたデータ。主な学習対象は Ling-3.0-flash のポストトレーニングデータであり、これによりドラフトモデルが本番環境で直面するデータ分布をそのまま学習できます。また、推論時の多様性と堅牢性を高めるため、蒸留プロセスでは複数のサンプリング設定を使用しています。
アブレーション駆動によるドラフト設計
Ling-3.0-flash のアーキテクチャをそのまま継承するのではなく、キーとなるドラフトの選択について体系的なアブレーション実験を行いました。具体的には、Ling-3 のアテンション構造を再利用するかどうかや、RoPE のバリアント(部分型かインターリーブ型か)などです。その結果、受容長とレイテンシのトレードオフにおいて最も優れた設計を採用しました。
サービングに連動したオンライン学習システム
長いコンテキストと大規模なオンライン学習に対応するため、「SplitServe Trainer」というシングルノード 8-GPU フレームワークを構築しました。これはリソースを学習と SGLang 推論の両方に均等に分割する仕組みです。学習中、推論側はターゲットのフォワードパスを実行し、ドラフト用の教師信号(ターゲットの隠れ状態など)を生成します。これにより、生成と学習のループがローカル完結し、IO オーバーヘッドを削減して、長いコンテキストを持つワークロードにおける学習効率を向上させています。
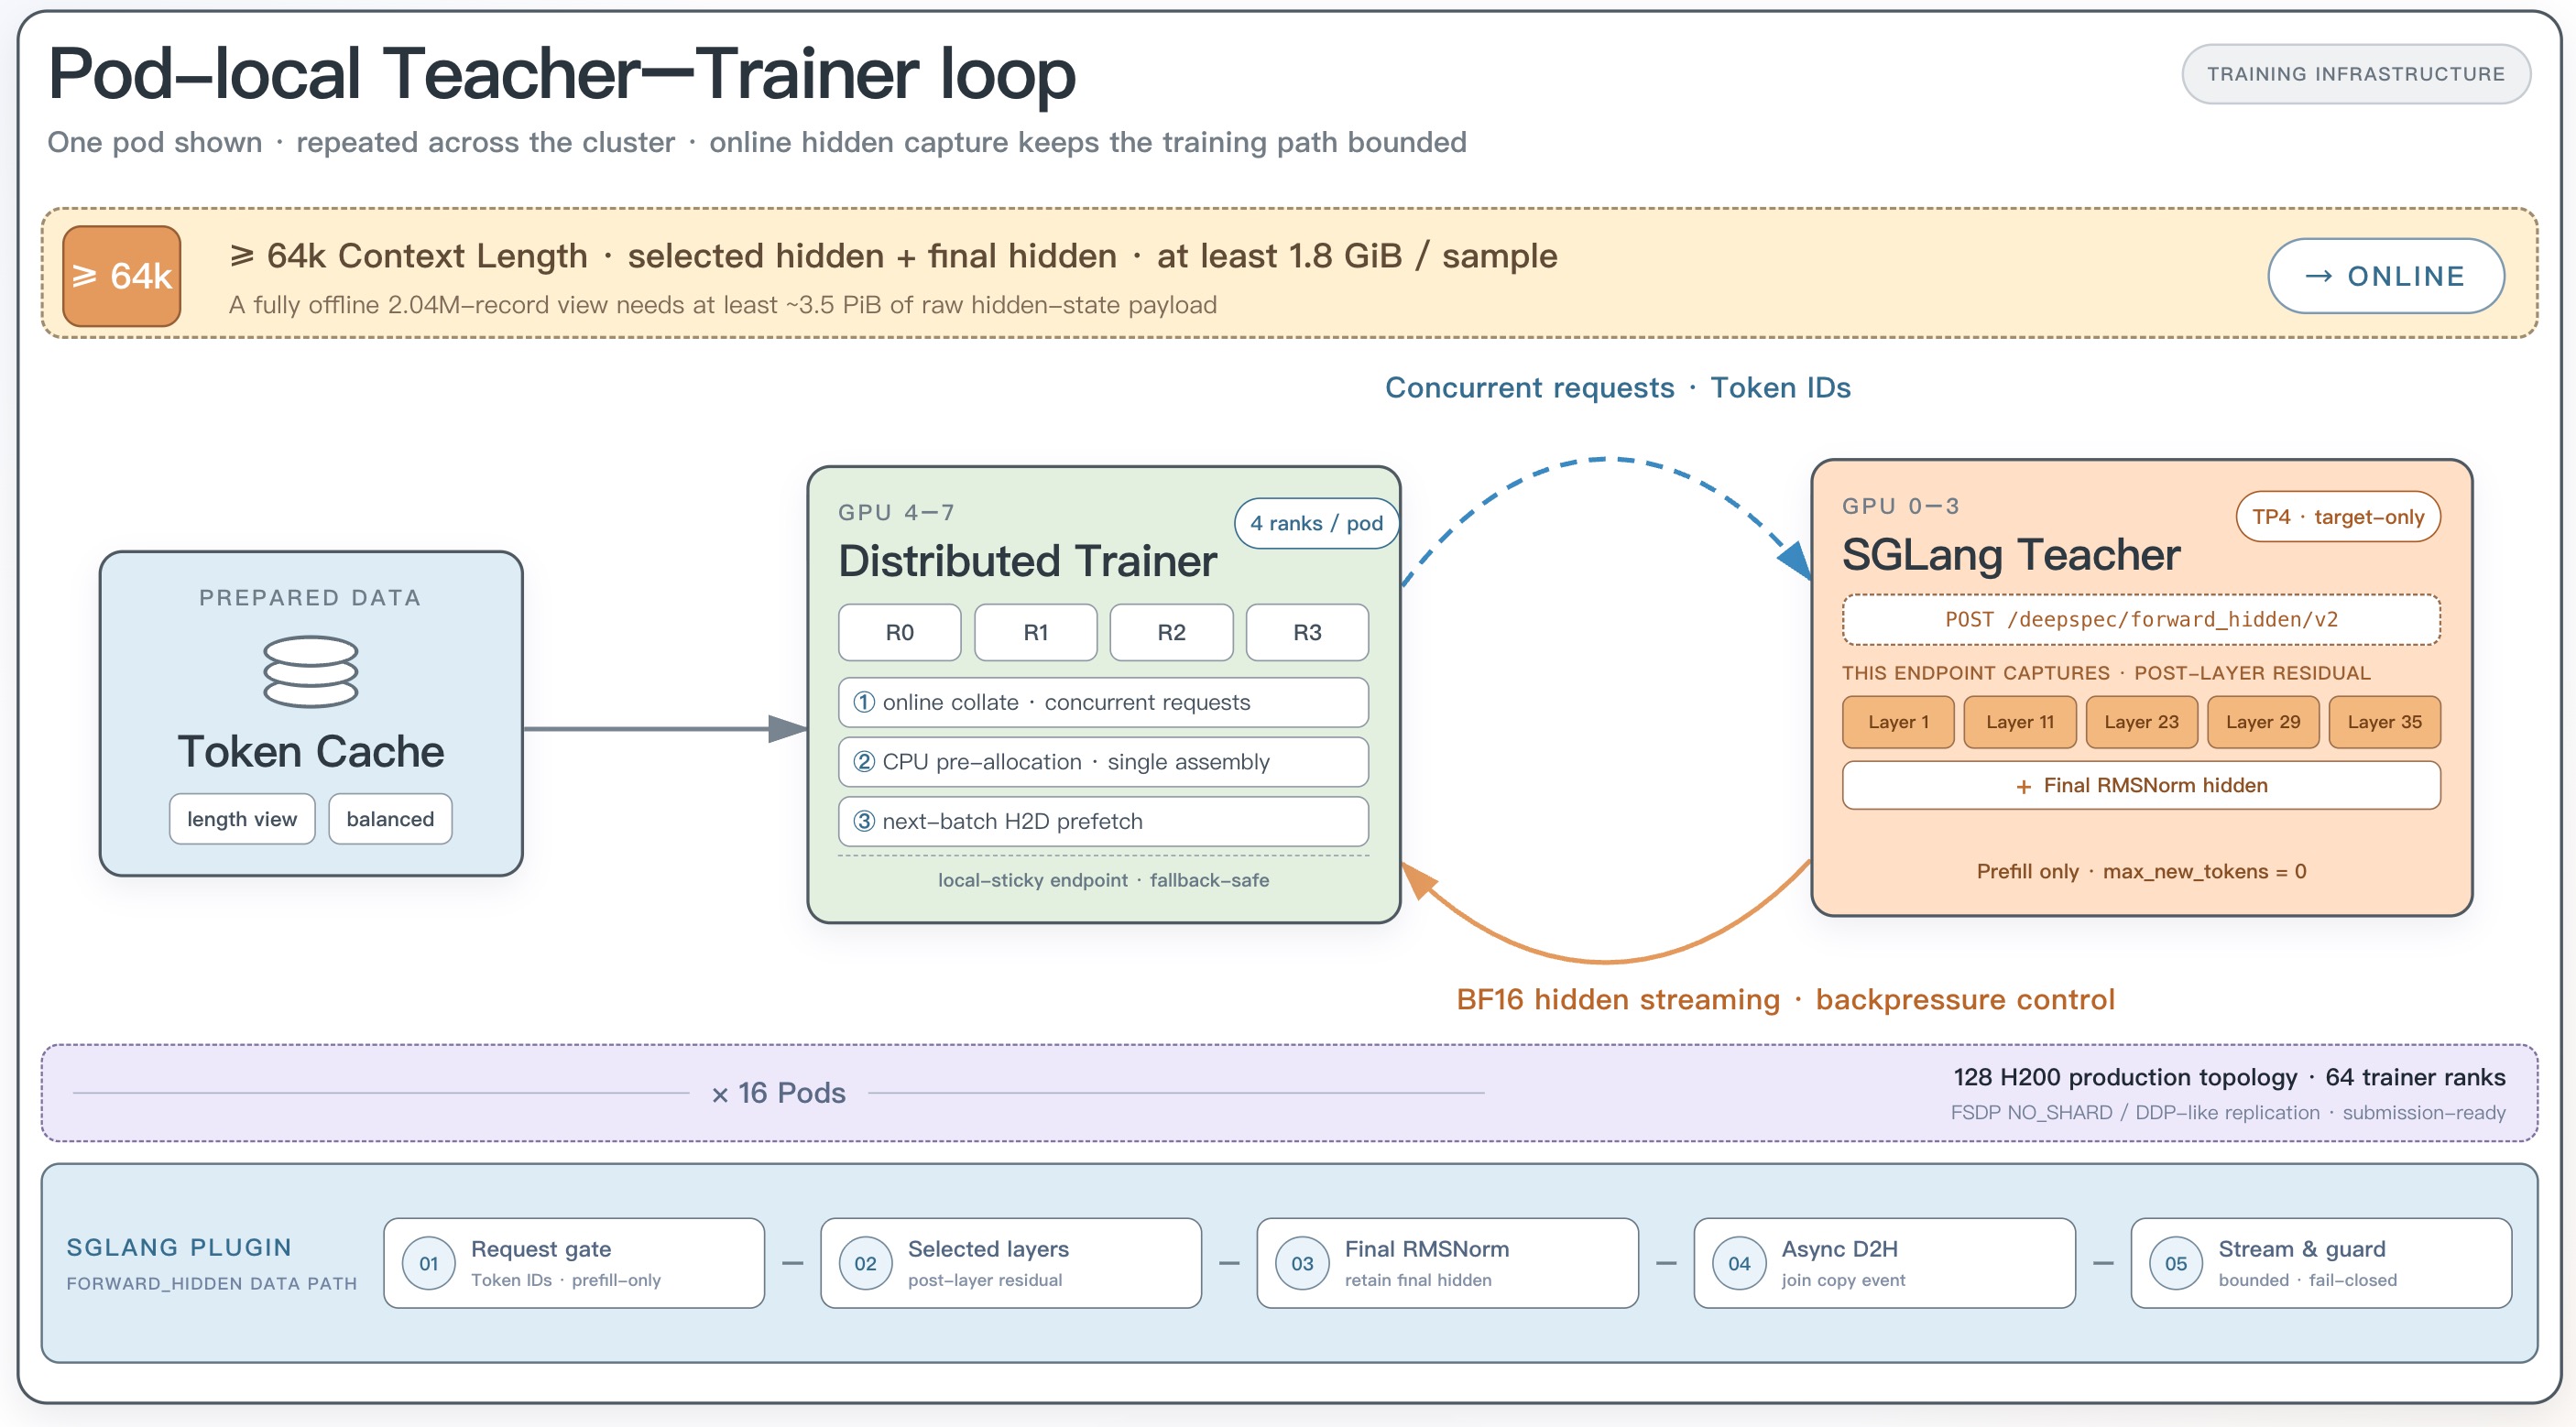
図 8. SplitServe Trainer の構成図。
受容長を意識した最適化
公開されている DSpark の損失設定に加え、受容長に関連する損失項を追加しました。これにより、ドラフトはトークンレベルや中間ターゲットとの整合性だけでなく、ターゲット検証下でより長いプレフィックスを受容できるようにも訓練されます。
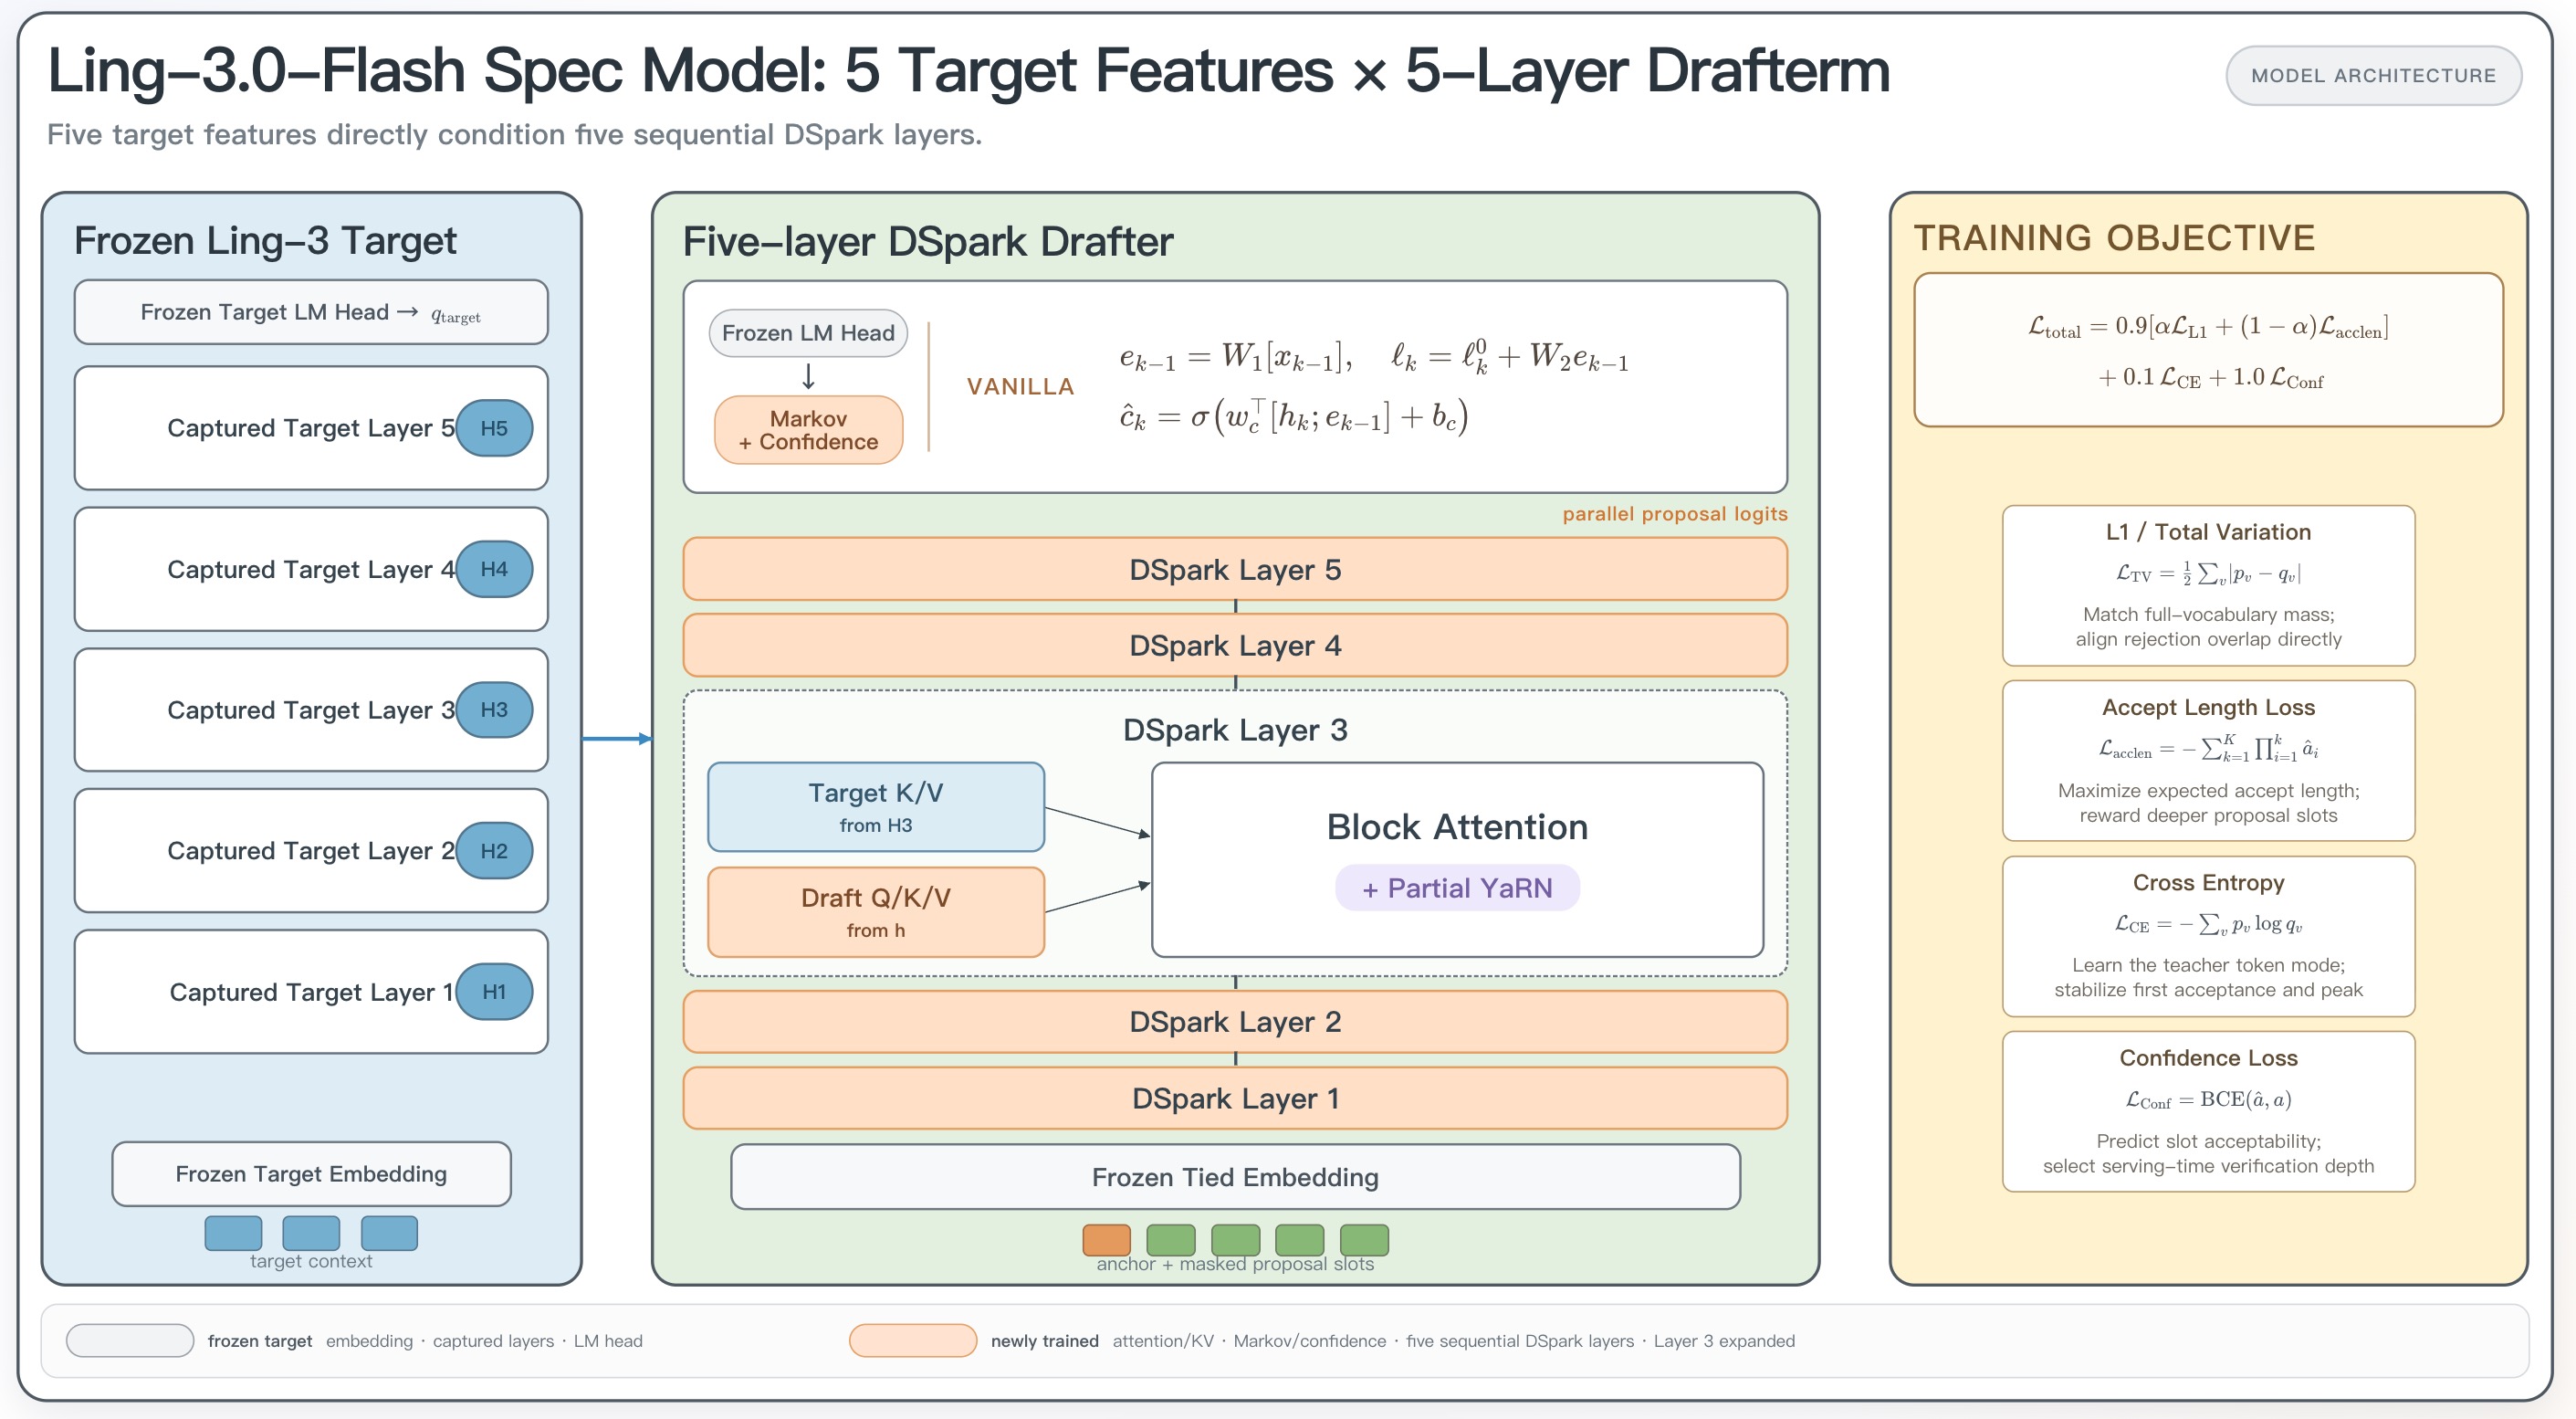
図 9. 受容長を意識した最適化の仕組み。
47% のアイドル状態とその背後にあるメカニズム
Blackwell TP4 でバッチサイズ 1 の DSpark トレースを初めて実行した際、NEXTN パスが到達していた状態とは程遠い結果となりました。安定状態のデコード反復が 239 回を超えても、ステップごとの中央値処理時間は 10.62 ms に達し、そのうち GPU がアイドル状態だったのは 4.99 ms(全体の 47%)でした。
このアイドル時間は CUDA グラフ内部ではなく、グラフ間のイーグルセグメントに発生していました。3 秒間にわたる処理のうち、グラフ内のマイクロギャップの合計は約 80 ms に過ぎませんでしたが、ステップごとに 100 µs から 2 ms の範囲で 4〜5 回の中規模なギャップが頻発していたことが原因でした。
FlashInfer の plan() 実装のうち、fa2 の BatchPrefillWithPagedKVCacheWrapper と MLA ワラッパーの両方に、デバイス上のテンソルが渡されていました。内部ではこれらが処理されます。
qo_indptr、kv_indptr、および kv_len_arr のそれぞれに対して .to("cpu") を実行する処理をブロックします。
D2H(デバイスからホストへの転送)の待ち行列が、ストリーム上のすべての処理、まだ実行中のドラフトグラフを含む待機状態を引き起こします。その結果、各ステップで CPU は GPU の進捗に常に紐付けられることになり、約 1 ミリ秒の cudaGraphLaunch という CPU コストを隠すための GPU 非稼働時間が残されませんでした。さらにスケジューラの尾部処理も、これら両者に直列化されてしまいました。
構造的には、これは再び resolve_seq_lens_cpu のピンポイントです。デバイス上に存在する値をホスト側でブロック読み取りし、各ステップごとにランアラウンド(先行実行)をゼロにリセットするという、無関係なサブシステムにおける動作です。
このルールが示唆するのは、バッチサイズ 1 の場合、何よりも先にホストパス上でデバイス値のブロック読み取りを探す必要があるという点です。なぜなら、そのような読み取りが一つあるだけで、ホスト側のループ全体が「隠れた作業」から「GPU のアイドル状態(バブル)」へと変換されてしまうからです。
ホスト給電プラン
これら 3 つの配列は、デバイスから取得する必要はありませんでした。DFLASH ファミリーでは、検証用とドラフト用の ForwardBatch が seq_lens_cpu = prefix + draft_token_num を持つことが保証されており、これは 3 つの独立した呼び出し箇所でアサートされています。この値は、デバイス側パスが計算する KV の長さと完全に一致します。ホスト側はすでに、読み戻しを待機していた答えを知っていました。
- fa2 サイド:キャプチャ時に、バッチサイズごとのターゲット検証ラッパーに
fast_prefill_planをインストールします。これは DFLASH 検証入力タイプにゲートされ、EAGLE のターゲット検証には影響を与えません。また、カスタムマスクが存在しないことをアサートします(高速プランはカスタムマスクをサポートしておらず、DFLASH も使用しません)。
- MLA の側面:
seq_lens_cpuを用いて純粋なホスト演算でプランの引数(kwargs)を構築し、ゼロの D2H 転送を実現します。また、新しい仕組みを通じてkv_indicesをラッパーの CUDA グラフバッファに直接書き込みます。
kv_indices_buf パラメータを指定し、fast_mla_decode_plan(causal=True) を呼び出してスキップします。
D2H 転送が 3 回ブロックされ、デバイスバッファの更新が 4 回発生します。キャプチャ処理では依然として実際の plan() が実行されており、これがキャッシュされたモジュールとラッパーのバッファを構築する役割を果たしています。
残りの 2 つの修正には追加の手間はかかりませんでした。graph.replay() は常に純粋なキューイング処理であり、CPU がドラフトグラフから検証準備、そして検証グラフへと連続してキューイングするのを妨げる要因は、その間に挟まる D2H(Device-to-Host)転送のみでした。
これを除去したことで、検証メタデータの準備と 2 つのグラフ起動が、ドラフトグラフの実行中に同時にキューイングされるようになり、両方のグラフを GPU 上で連続して実行できるようになりました。
各環境フラグは、組み合わせる前にそれぞれ個別に A/B テストされました。
| フラグ(個別測定) | 受け入れ長さ | 平均 TPOT | 判定 |
|---|---|---|---|
| なし(オーバーラップあり、ラディックスキャッシュオフ) | 4.49 | 1.48 ms | クリーンなベースライン |
SGLANG_OPT_FUSED_KDA_VERIFY=1 | 4.68 | 1.34 ms | 安全、維持 |
フラグレベルの軌跡を、固定された推測設定(8192 トークン入力 / 1024 トークン出力、並列度 1)で確認すると、同期スケジューリングでは 1.67 ms でしたが、ラディックスキャッシュをオフにしたオーバーラップスケジューリングに切り替えると 1.48 ms に短縮されました。これはスケジューラの尾部のアイドル時間が 1118 µs から 85 µs に圧縮された結果です。さらに KDA(Key-Data-Aggregation)検証を融合させることで、1.34 ms まで達成しています。
実環境でのデプロイ構成では、並列度 1 で 1000 リクエストを測定した結果、平均受け入れ長は 9.95 トークン、TPOT(Time Per Output Token)の平均値は 0.78 ms、中央値は 0.51 ms となりました。出力スループットは 1120 tok/s で、ピーク時は 1945 tok/s に達しました。この 9.95 という受け入れ長は、ブロックサイズ 16 の DSpark ドラフトモデルで測定された値です。一方、公開されているドラフトチェックポイントはブロックサイズ 8 を使用しています。DSpark は speculative-num-steps や draft-tokens といったフラグを受け付けません。これらは NEXTN モデル固有の設定項目です。
中央値の TPOT(0.51 ms)に平均受け入れ長(9.95)を乗算すると、約 5.1 ms となります。これは前述のトレースで測定されたステップ時間(KDA 融合前の合計約 5.3 ms)と概ね一致しています。ただし、これは中央値と平均値を混在させた粗い整合性チェックに過ぎず、このように分布が広いデータに対しては中央値そのもののステップ時間を表すものではありません。ステップ時間をトレースから直接測定することで精度を高めることは可能ですが、DSpark 構成についてはまだ実施していません。しかし、トレースデータが示唆する定性的な結論は明確です。ホスト側の処理負荷が再び解消され、残りのボトルネックは GPU 上に存在しているという点です。
ここで時間が使われている場所
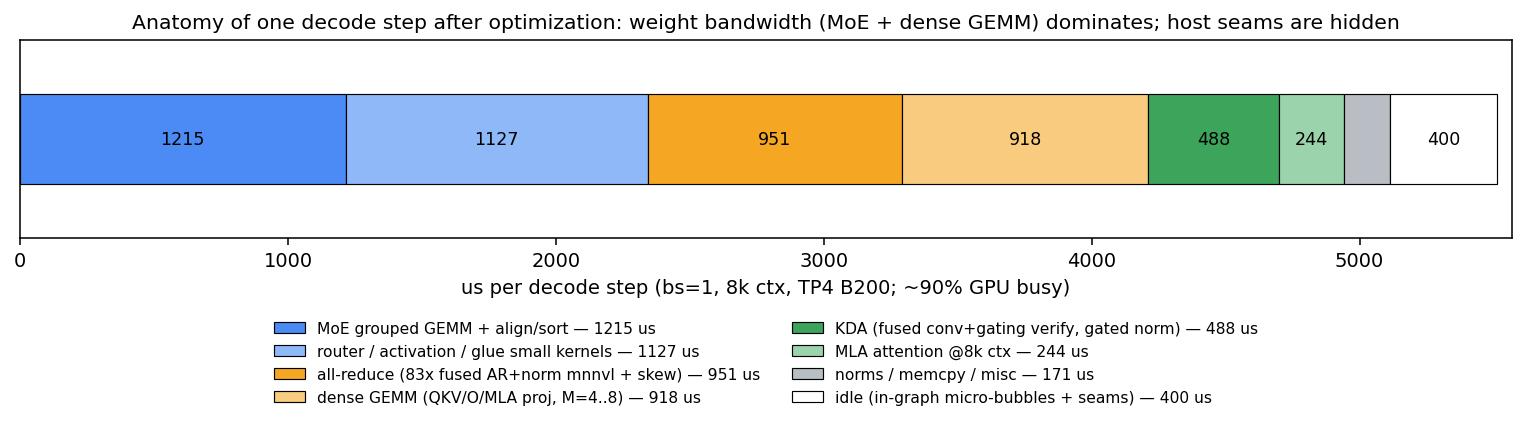
MoE によるグループ化 GEMM が 1215 µs、ルーターや活性化関数、結合処理の小さなカーネルが 1127 µs、all-reduce が 951 µs、密な GEMM が 918 µs、KDA が 488 µs、8k コンテキストにおける MLA アテンションが 244 µs。これに 400 µs のアイドル時間が加わります。ホスト側の処理は完全に隠蔽されており、残るのは GPU の作業のみです。この場合、重みの帯域幅がボトルネックとなっています。
今回の分析は NEXTN 構成を前提としたものです。DSpark はステップの再配分(より広い検証ウィンドウと、2 つ目のドラフトモデルグラフ)を行いますが、結論自体を変えるものではありません。
8k コンテキストにおける MLA アテンションは 244 µs です。長文コンテキストが問題なのではなく、ハイブリッドアーキテクチャの結果として生じている現象です。MoE と密な GEMM を合わせると約 2.1 ms となり、そのほとんどが重みの帯域幅に依存しています。
したがって、今後のロードマップは短く明確です。
- fp8 形式の重みが残された大きな改善ポイントです。帯域幅制約のある 2.1 ms の処理でバイト数を半分に減らせば、構造的に 15〜20% の性能向上が見込めます。これは測定誤差の範囲を大きく超える効果です。受け入れ長を調整する解決策(bf16 ドラフト)は既に存在しますが、ブロック量子化における TP(Tensor Parallelism)の制約も明確です。
moe_intermediate_size = 768でブロックサイズが 128 の場合、TP4 は実現不可能であり、--ep-size 4を指定する必要があります。
- ルーター融合は、これ以上無理のない地点に達しています。ゲート行列ベクトル積を top-k カーネルに統合すると、並列性が 129×M CTAs から M/BLOCK_M にまで低下してしまいます。PDL チェーニングが、このアプローチにおける適切な終着点です。
- ホスト環境の最適化です。スケジューラープロセスに対するコアピンニングや GC(ガベージコレクション)チューニングは、カーネル自体を最適化するのではなく、実行前の余裕時間を確保するための防御策と言えます。
Reproducing
SGLANG_ENABLE_METADATA_GLUE_GRAPH=1 \
SGLANG_OPT_FUSED_KDA_VERIFY=1 \
SGLANG_ENABLE_FUSED_VERIFY_EXTEND_GRAPH=1 \
python3 -m sglang.launch_server \
  --model-path inclusionAI/Ling-3.0-flash \
  --tp-size 4 --trust-remote-code \
  --speculative-algorithm NEXTN \
  --speculative-num-steps 5 \
  --speculative-eagle-topk 1 \
  --speculative-num-draft-tokens 6 \
  --attention-backend trtllm_mla \
  --flashinfer-allreduce-fusion-backend auto \
  --mem-fraction-static 0.85
DSpark 設定では、推測フラグを DSpark のドラフトチェックポイントに置き換えてください。
SGLANG_OPT_FUSED_KDA_VERIFY=1 \
python3 -m sglang.launch_server \
  --model-path inclusionAI/Ling-3.0-flash \
  --tp-size 4 --trust-remote-code \
  --speculative-algorithm DSPARK \
  --speculative-draft-model-path inclusionAI/Ling-3.0-flash-dspark \
  --attention-backend trtllm_mla \
  --flashinfer-allreduce-fusion-backend auto \
  --disable-radix-cache
どちらの構成も、同じベンチマーク手法で評価されます。
python3 -m sglang.bench_serving --backend sglang \
  --dataset-name random --num-prompts 1000 \
  --random-input-len 8192 --random-output-len 1024 \
  --random-range-ratio 1.0 --max-concurrency 1
謝辞
本プロジェクトは、RadixArk SGLang チームと Ant Ling Infra Team の共同研究です。SGLang 上で Ling-3.0-flash を提供いただいた DeepInfra と Novita に感謝いたします。
Ant Ling Infra Team(Ant Group)、氏名の順に並べ替え:Tiwei Bie, Yuan Luo, Dayu Qiu, Jianfeng Tan, Tongli Wang, Yue Yu, Kaihong Zhang。inclusionAI(Ant Group)、氏名の順に並べ替え:Xiang Cao, Guoshan Lu, Junbo Zhao。
原文を表示
Batch-1 decode keeps getting more important. Xiaomi MiMo, for example, announced MiMo-V2.5-Pro UltraSpeed in June, claiming 1,000 tok/s decode on a one-trillion-parameter MoE model.
Batch 1 gives an inference stack no room to hide overhead. There is no batch to amortize launch cost across, no concurrency to fill pipeline bubbles, and not enough arithmetic intensity for clever tiling to pay off. Every microsecond on the critical path is a microsecond the user waits.
This post is about pushing that floor down for Ling-3.0-flash, a hybrid linear-attention MoE model, on 4 NVIDIA Blackwell GPUs. It covers two speculative decoding paths. On the NEXTN/MTP path we moved single-request decode from 288 tok/s to 606 tok/s and mean TPOT from 3.33 ms to 1.53 ms. The second path is DSpark, a confidence-scheduled speculative decoder built on the same stack: a 1000-request run reaches 1120 tok/s at a mean TPOT of 0.78 ms and an accept length of 9.95. That last comparison is the controlled one: NEXTN and DSpark were measured with the same command on the same machine, and mean TPOT is 1.9x lower (1.53 ms to 0.78 ms). The rest of the post is where that time was going and what it took to get it back.
Highlights
- Final result: mean TPOT down 54% (3.33 ms to 1.53 ms), single-request throughput 2.1x higher (288 to 606 tok/s). In the controlled 1000-request comparison, DSpark reached 0.78 ms mean TPOT and 1120 tok/s.
- The optimization line was host run-ahead, then PDL chaining, then kernel optimization, then DSpark. Removing a per-step host pin let preparation hide behind GPU work; PDL then linked the MoE, router, KDA, and all-reduce path; two fusions, one KDA retune, and bf16 router/lm_head GEMMs shortened the remaining GPU critical path.
- Numerics as a bandwidth knob: moving the router gate and lm_head from fp32 to bf16 was the largest post-structural change, worth roughly +10%.
- Measurement discipline throughout: profiled-vs-unprofiled calibration before any host-side conclusion, cold-weight microbenchmarks, and A/B decisions on mean TPOT rather than single-window peaks.
- DSpark raises the tokens committed per verify step: accept length 9.95 and 1120 tok/s at concurrency 1, at a mean TPOT of 0.78 ms. Against NEXTN on the same 1000-request benchmark, that is 1.9x lower mean TPOT.
| Metric (8192-in / 1024-out, single concurrency, greedy, TP4 bf16) | Baseline | After the draft-extend graph fix | NEXTN, tuned | With DSpark |
|---|---|---|---|---|
| Mean output throughput | 288 tok/s | 526 tok/s | 606 tok/s | 1120 tok/s |
| Mean TPOT | 3.33 ms | 1.76 ms | 1.53 ms | 0.78 ms |
| Median TPOT | — | — | 1.56 ms | 0.51 ms |
| Peak output throughput | — | — | 1099 tok/s | 1945 tok/s |
| Accept length | 3.14 | 3.13 | 3.25 | 9.95 |
On GSM8K, the same stack scored: accuracy 0.889, invalid 0.000, latency 341.5 s, output throughput 511.1 tok/s.
All runs use Ling-3.0-flash on 4 Blackwell GPUs, TP4, bf16, concurrency 1, greedy decoding, and the same fixed 8192-input / 1024-output random workload. From left to right, the columns show the initial NEXTN baseline, NEXTN after the draft-extend graph fix, final tuned NEXTN, and DSpark. The first two are shorter campaign checkpoints; the last two are the controlled comparison, each measured over the same 1000 requests on the same machine. Peak throughput is compared only between the last two runs because it is the maximum over fixed one-second windows.
Two definitions matter here, because together they explain why output throughput is not simply the reciprocal of mean TPOT even at concurrency 1: SGLang's TPOT excludes TTFT, while output throughput divides total output tokens by total benchmark wall time (see the bench_serving guide). All headline benchmark runs in this post use a synthetic random workload; accept length in particular depends on the prompt and output distribution, so 9.95 is this workload's accept length rather than the model's.
The model
Ling-3.0-flash is a hybrid-attention MoE model (BailingMoeV3), and most of what follows comes from that word *hybrid*.
| Layers | 42 total: 35 KDA linear-attention + 7 MLA full-attention |
|---|---|
| MoE | 512 routed experts + 1 shared, top-8 (+1), moe_intermediate_size 768 |
| Hidden size | 2560 |
| Vocabulary | ~157k, served through a vocab-parallel lm_head |
| Weights | ~63 GB per rank in bf16 |
| Deployment | 4 NVIDIA Blackwell GPUs, TP4, bf16, NEXTN speculative decoding |
Five of every six attention layers are KDA. That is why MLA attention costs only 244 µs per step at 8k context in the final profile, and why this model is a good batch-1 target in the first place: with attention cheap and the batch tiny, what remains on the critical path is weight bandwidth and launch latency, which is exactly the regime this post is about.
The shape of a batch-1 step
We decode with NEXTN speculative decoding at steps=5, topk=1, draft_tokens=6. One decode step is three CUDA graphs in a relay.
The draft is a single-layer NEXTN model run autoregressively: five steps but only four forwards, because the first candidate comes from the previous round's seed and the fifth is read off the fourth forward's top-k. Verify is one forward of the full 42-layer target over all six chain positions. Extend fixes up the draft's KV cache, which only ever saw the draft's own guesses, and hands back the seed for the next round.
What crosses between the three graphs on the CPU is nothing. Fixed shapes plus padding make every accept-dependent count a GPU index rather than a host value; persistent buffers let producer graphs write straight into consumer buffers; and the decisions that genuinely need values on the CPU (EOS, stop strings, detokenization) go through a side-stream D2H and a copy_done event consumed one step late. Everything below rests on that property.
Two kinds of empty time
When we started, the GPU was busy about two-thirds of the step. Idle time at batch 1 comes in two flavors, and they need separate diagnoses because the fixes have nothing in common:
- Host-mode idle. Three graph replays per step, several hundred kernel nodes executing inside them, and Python glue in the seams between graphs. (Three replays, not three forwards: the draft graph's captured body holds all four draft forwards, so the autoregressive draft loop costs one replay rather than four.) If the host's per-step loop takes longer than the GPU's step, the GPU starves. The fix is to hide and shrink host work.
- GPU-mode idle and GPU-mode cost. Once the host is hidden, what remains is weight bandwidth (each MoE layer cold-reads roughly 94 MB of activated expert weights per step) plus the intrinsic latency floor of several hundred small kernel nodes. A batch of one amortizes neither. The fix is dtype work, fusion, and launch-dependency scheduling.
These two kinds of idle describe the step-time side of TPOT. The other lever is how many tokens each step commits: mean TPOT ≈ step time / mean accept length. The rest of the post follows those levers. Host run-ahead and seam work remove host-mode idle; PDL, dtype changes, fusion, and retuning shorten the GPU critical path; speculation tuning and DSpark increase the tokens committed per target step. DSpark later revisits the first category when a blocking D2H read reintroduces a host pin.
Fixing the ruler before fixing the machine
Three properties of the measurement setup shape every number below.
The profiler inflates host-side events. CUPTI adds overhead to each host event it records. On the same configuration, a profiled step measures 5.2 ms while the real step, back-computed from TPOT × accept length on an unprofiled run, is 4.9 ms. That 0.3 ms gap is the same order as the host-side effects we wanted to reason about, so a profiled trace can show cross-rank waits that do not exist off the profiler. GPU kernel durations come from hardware timestamps and are more trustworthy than host-side timings, but not immune: tracing still perturbs launch timing, concurrency, cache state, and CUDA graph execution, and Nsight Systems documents potentially significant overhead for CUDA and graph-node tracing (user guide). So every host-side conclusion here got a profiled-vs-unprofiled calibration first.
Microbenchmarks run optimistic for cold-weight kernels. A loop calling one kernel repeatedly keeps its 2.6 MB gate weight resident in L2, while the real model flushes L2 with about 94 MB of expert traffic between consecutive calls to the same layer. Hot 7 µs, cold 11 µs: enough to reverse a ranking against the library GEMV.
Peak throughput is a single-window statistic. The benchmark's peak number is the maximum over a fixed 1-second grid, so it carries roughly a ±5% phase band: shifted TTFT/TPOT re-slices the grid, and a change that improves mean throughput by 2.3% can print as a drop from 909 to 858. Both readings reproduce exactly under a fixed seed, so reproducibility does not separate signal from phase. A/B decisions here are made on mean TPOT × mean accept length. That product is a derived estimate of step time rather than a measured one (the product of two aggregates is not the aggregate of the product), but it is stable across runs and insensitive to accept-length drift in these runs, which is what an A/B criterion needs. We report peak but never optimized against it.
Correctness had its own gate, applied to every change before it stayed: byte-exact comparison of a 256-token greedy generation, accept length unchanged within 0.05, and a greedy re-run after interleaving temperature-sampled requests to catch state pollution. Changes that legitimately alter rounding (the bf16 gate, the single-rounding combine) said so in their commit message and were validated on accept and task metrics instead of bit parity.
Letting the host run ahead
This is the structural change the rest of the campaign rests on, and it is a host-mode idle fix.
cudaGraphLaunch has always been asynchronous, and the draft → verify → extend ordering on the GPU is free: same stream, FIFO. So the question was never whether verify waits for draft. It was whether the host is pinned to GPU progress every step.
It was. Under spec-v2, the scheduler does not know the accept length, so FutureMap.resolve_seq_lens_cpu() pulls new_seq_lens back from the GPU while building the next batch: gated on a publish event, copied on a private stream, then synchronize()d. The host was not waiting for a microsecond-scale copy. It was waiting for the previous verify graph to finish executing. Median cost: 485 µs per step, with the run-ahead depth reset to zero every single step.
The cause is the needs_cpu_seq_lens flag, OR-ed across every backend involved in spec-v2. trtllm_mla declares False in all three roles; the sibling linear-attention backends GDNAttnBackend and Mamba2AttnBackend both declare False explicitly. KDAAttnBackend never declared it and inherited the base-class default of True, even though it runs the same base-class metadata code as its two siblings.
Declaring needs_cpu_seq_lens = False collapsed the OR and removed the per-step synchronize. The correctness argument is pointwise: KDA's metadata never reads the CPU mirror, and replay padding comes from forward_batch.num_padding.
How does the host dare launch step k+1 without knowing what step k accepted? Because the values never touch the CPU. FutureMap is a GPU-resident relay: step k's graph writes output tokens, new_seq_lens, top-k probabilities, and hidden states into device buffers indexed by req_pool_idx, and step k+1's graph reads them by the same index. The host only handles indices, which it already knows.
Run-ahead also changes the shape of host cost. Instead of every rank paying its host time directly every step, only a rank that exhausts its queue slack pays. In one four-rank trace, exactly one rank was in that state: its scheduler segment ran 5-10x longer than its siblings, its draft graph launched 40-80 µs late, its draft→verify seam ran +165 µs above the others' median, and it showed periodic 400-750 µs spikes with a GC signature. The other three ranks spin-waited for it at every rendezvous. The diagnostic that generalizes: a kernel's duration is not its work. A 20 KB embedding all-reduce showing 150-480 µs is not a slow all-reduce; it is absorbing skew, and only cross-rank time alignment tells you which rank is late.
Closing the seams
With the lockstep pin gone, the seams between graphs became worth shrinking. Before a CUDA graph replays, step-specific attention metadata (kv indices, block tables, mamba state slots) has to be rebuilt from the live req_to_token and seq_lens into the graph's captured static buffers. That refill runs eagerly every step and is most of what a seam contains. At batch 1 it is purely host-bound: each op costs 5-15 µs to dispatch and 1-4 µs to execute.
We attacked it at two levels. First, fuse the index chains: assign_extend_cache_locs_uniform computes end offsets inside the kernel (the uniform draft_token_num expansion makes the cross-row prefix sum unnecessary), and _fused_state_indices_kernel collapses a gather, a translate, a padding-sentinel write, and a copy_ into one launch, carefully preserving both side effects, including zeroing req_pool_indices on padded rows, which nothing in that function needs but other captured kernels in the graph depend on for in-bounds gathers.
Second, capture the refill itself into a small CUDA graph keyed by (bs, forward_mode). This works because of a pointer-stability property the replay contract already guarantees: the replay ForwardBatch view hands the backend only runner-static buffers and pool-resident tensors, so the whole prep sequence has fixed addresses. Four safety mechanisms surround it: two eager warmups, so Triton JIT and autotune happen outside capture; a snapshot of each backend's forward_metadata object restored before every replay (the graph replays device ops, the snapshot restores Python pointers); permanent eager fallback with a warning if capture fails; and guards against padding, TBO, pdmux, and LoRA. It ships opt-in behind SGLANG_ENABLE_METADATA_GLUE_GRAPH and is force-disabled for DFLASH-family speculation, because that path rebuilds its attention plan on the host every step and capturing the refill would freeze the plan at capture time.
There is a hard boundary on what may be captured. The criterion: a refill made of pure device kernels writing persistent buffers is capturable; anything that goes through a FlashInfer-style plan() is not. The draft side fails it: the multi-step draft backend re-plan()s wrappers that the main EAGLE graph has already captured, and recording that re-plan into a secondary graph corrupts the wrappers' internal state on replay. A related requirement is that capture be idempotent. trtllm_mla's _init_cuda_graph_metadata used to allocate fresh tensors and replace its decode_cuda_graph_metadata[bs] entry on every call, which leaves earlier graphs reading freed memory after a second capture.
PDL: stacking the latency floors of small kernels
A batch-1 step executes several hundred kernel nodes in a short window. At that size, launch and prologue cost about as much as the math. Programmatic Dependent Launch (PDL) lets a consumer kernel be scheduled onto SMs while its producer is still running: the consumer executes everything that does not depend on the producer's output and fences at gdc_wait() only before the dependent read.
We wired three chains: the MoE main chain (moe_align → up-GEMM → activation → down-GEMM → combine → all-reduce), the router chain (norm → gate matvec → top-k), and the KDA chain (conv1d_update → recurrent delta-rule → gated norm). Two design points matter.
Producer-independent loads go before the wait. That is the whole trick in the figure, and it is what makes PDL more than launch-overhead removal for latency-bound kernels.
Inductor kernels cannot carry PDL attributes. The small-M MoE combine was a torch.compile-generated kernel; joining the chain meant swapping it for the repo's Triton reduction plus GDC. That had a numerical side effect: fp32 sum × scale with a single final cast, where the old path rounded twice. The result is slightly more accurate but not bit-equal, which the commit message declares.
Later we upgraded the semantics after a finding in PTX griddepcontrol: launch_dependents only releases the launch of dependents, while a consumer's wait always fences on the producer grid's complete retirement. Moving the trigger from the end of the producer to immediately after the producer's own wait lets a consumer's prologue overlap more of the producer's body than just its tail, subject to one precondition: the consumer must still keep its own gdc_wait() between the early launch and every read of producer output. That is a property of each consumer, not a blanket guarantee, so we checked it kernel by kernel and converted six. What the early trigger buys is also not deterministic: the driver may launch a dependent grid early, and how much overlap materializes depends on scheduling and resource pressure at the time (CUDA programming guide). fused_moe gates this behind an M ≤ 512 check: at prefill shapes, releasing a large consumer grid early steals SMs from the producer, while at decode shapes it is pure gain.
PDL is pure scheduling semantics. Changes whose accumulation order is unchanged stay bitwise identical; the gate matvec passed a 4-of-4 GDC-on/off bit comparison.
Two fusions and a retune
moe_align, on the pair axis. The Triton fused-MoE GEMM consumes tokens in block_size tiles where every row shares an expert, and moe_align_block_size builds that permutation. The generic path needs two kernel launches: no token can be placed until every expert's offset is final, those offsets come out of a grid-wide scan, and a device-wide barrier exists only at a kernel boundary. A single-launch variant exists, but it stages per-thread expert counters in shared memory, so it is limited to 64 experts or fewer; a 513-expert decode always paid two launches.
The replacement works on the pair axis: an [NP, NP] pairwise comparison gives every (token, slot) pair a stable rank within its bucket and its bucket population in one shot; the rank-0 representative of each bucket then derives padded counts, bucket-ordered exclusive offsets, the published total, and per-block expert ids. Nothing scales with the expert count, so the expert-count limit disappears. The obvious alternative, histogram and cumsum over the padded expert axis (up to 1024 buckets), is correct but puts about 3x more single-SM work on the critical path than the two kernels it replaces. That is what makes the pair axis load-bearing here.
Two deliberate deviations from the reference, both argued from consumer invariants: intra-bucket order is stable in pair index rather than atomic-scheduling order (every pair writes its own output row, so consumers are order-invariant), and the buffer tail beyond the published total is left unwritten (consumer CTAs early-exit before reading it). One cliff: the pairwise tensors are O(NP²). They live entirely in registers at NP=64 (about 4 µs, on par with the CUDA two-kernel path) and spill to local memory at NP=256, costing about 230 µs per launch. The dispatch gate is a hard numel ≤ 64; larger batches fall back to the CUDA path.
SwiGLU in the up-GEMM epilogue. Folding silu(gate) * up into the MoE up-GEMM epilogue removes a standalone activation kernel per MoE layer and the whole write-then-read of the intermediate buffer. The layout trick is a per-expert row interleave of w13 applied at weight load, which makes gate and up land in adjacent even/odd columns of the same output tile. Since each GEMM output column is an independent dot product, interleaving is bitwise neutral.
Bit parity is where the care went. The kernel being replaced is compiled with -use_fast_math, so the epilogue reproduces it instruction by instruction: mul + ex2.approx.ftz for __expf, div.approx.ftz, and a single final rounding on the product. The subtle part: FlashInfer instantiates the activation functor in float, so silu never lands in bf16 before the multiply. Round it there and the result double-rounds and diverges on a large fraction of inputs. That is invisible in the documentation and invisible to a tolerance check; it takes an element-wise bit comparison over the full input range.
KDA chain-verify tile economics. The fused conv1d + gating delta-rule verify kernel already existed; these commits retuned it. On the rotating-cold test with in-graph timing, the Blackwell curve at T=6 is monotone: BV=4 at 11.56 µs, 8 at 12.53, 16 at 12.83, 32 at 14.26, 64 at 20.7, 128 at 38. BV=4 wins by up to 19% per call because 256 CTAs is 1.7 waves over 148 SMs, and duplicating the q/k convolution 32 times is still cheaper than shortening the serial chain. Tiling the V dimension never touches the K-dimension reduction order, so at num_warps=4 every BV is bitwise identical to the baseline and the retune carries no numerical risk.
bf16 router gate and lm_head
The largest single post-structural change was a dtype change. At batch 1, the router gate and the lm_head are pure bandwidth: every decode step cold-reads each MoE layer's gate weight (2.6 MB in bf16) and the vocab-parallel lm_head projection, and neither has arithmetic to hide the read behind. Running both in bf16 instead of fp32 halves those bytes; end to end it was worth roughly +10%, the largest gain of any single change after the host run-ahead fix. Like the other rounding changes above, this one was declared in its commit message and validated on accept length and task metrics rather than bit parity.
KDA under speculation
A rejected speculative token leaves a KV cache entry harmlessly stale, but it has already corrupted a recurrent state in place. Linear attention and speculation do not coexist for free.
The scheme that makes it work: during verify, the recurrence runs with state updates disabled and writes each chain position's post-state into an intermediate buffer; after the verdict, commit_mamba_states_after_verify copies the state belonging to the last accepted position into the persistent slot. Stage, then commit. This is also why the compact spec cache is restricted to topk=1: with a chain, the accepted prefix is unique and states can be indexed by position; with a tree, the accepted path is one of many and states would have to be indexed by tree path.
Profiling shows KDA decode is bandwidth-bound, mostly HBM traffic on the K×V state, so beyond the fusion and the tile retune there is not much left there. We did not measure achieved bandwidth against the Blackwell peak, so read that as a shape observation rather than a roofline result.
The economics of speculation at batch 1
Weight-bandwidth dominance has a counter-intuitive corollary: verifying more tokens is nearly free. Verifying 4 tokens and verifying 6 tokens read exactly the same weights. Deepening speculation at batch 1 costs one extra cheap draft forward per added step (the draft is a single layer) plus the incremental serial cost in the KDA chain-verify recurrence, and buys accept length.
We swept it rather than assuming it (this sweep predates the fusion bundle; the optimum moved afterwards, as noted below):
| steps / draft tokens | accept length | mean TPOT | step time (derived) | steady-state tok/s |
|---|---|---|---|---|
| 3 / 4 | 3.11 | 1.51 ms | 4.70 ms | 662 |
| 4 / 5 | 3.37 | 1.45 ms | 4.89 ms | 690 |
| 5 / 6 | 3.45 | 1.55 ms | 5.35 ms | 645 |
The step-time column is TPOT × accept length, a derived estimate rather than a direct measurement. Each added step costs about 4-9% of step time while the marginal accept gain decays geometrically (d5 → d6 adds only 0.08). The break-even condition is roughly Δaccept > 0.05 × accept. The optimum also moves: after the fusion bundle landed and step time dropped, (5, 6) became the better configuration; once fp8 weights shrink the fixed base further, it will need another sweep.
DSpark: high-quality block drafting
Tuning NEXTN's depth is a one-dimensional knob on a fixed-shape algorithm. The larger lever is changing the algorithm, and the second half of the campaign went into bringing DSpark onto the same target and giving it the same batch-1 treatment.
What DSpark does differently
The DSpark algorithm itself is public. The work here is adapting that public recipe to Ling-3.0-flash, long-context online distillation, and the batch-1 Blackwell serving stack. Our adaptation differs in four ways.
Distribution-aligned data. We distill mainly on Ling-3.0-flash post-training data, so the draft trains on the distribution it will face at serving time. We also use multiple sampling settings during distillation to improve trajectory diversity and robustness under speculative decoding.
An ablation-driven draft design. Instead of directly inheriting the Ling-3.0-flash architecture, we ran systematic ablations over key draft choices, including whether to reuse the Ling-3 attention structure and which RoPE variant to use (partial or interleaved). We kept the design with the best acceptance-length/latency tradeoff.
A serving-coupled online training system. For long-context and large-scale online training we built SplitServe Trainer, a single-node 8-GPU framework that splits resources evenly between training and SGLang inference. During training, the inference side runs target forwards to produce supervision signals such as target hidden states for the draft. This keeps the generation-training loop local, cuts IO overhead, and improves training efficiency for long-context workloads.
Acceptance-aware optimization. On top of the public DSpark loss setup, we added an acceptance-length-related loss, so the draft is trained not only for token-level and intermediate-target alignment but also for longer accepted prefixes under target verification.
47% idle, and the mechanism behind it
The first DSpark trace on Blackwell TP4 at batch 1, over 239 steady-state decode iterations, was nowhere near the state the NEXTN path had reached. Median step time was 10.62 ms with 4.99 ms of GPU idle (47%).
The idle was not inside the CUDA graphs: in-graph micro-gaps totaled about 80 ms out of 3 seconds. It was all in the eager segments between graphs, as four or five medium gaps of 100 µs to 2 ms per step.
Both FlashInfer plan() implementations, the fa2 BatchPrefillWithPagedKVCacheWrapper and the MLA wrapper, were being fed device tensors, and internally they do a blocking .to("cpu") on each of qo_indptr, kv_indptr, and kv_len_arr. A blocking D2H waits for everything in flight on the stream, including the draft graph that is still executing. So every step, the CPU was pinned to GPU progress right after the draft launch; the roughly 1 ms of cudaGraphLaunch CPU cost had no GPU-busy window left to hide in; and the scheduler tail serialized behind both.
Structurally this is the resolve_seq_lens_cpu pin again: a host-side blocking read of a device-resident value that resets run-ahead to zero every step, in an unrelated subsystem. The rule it suggests: at batch 1, look for blocking reads of device values on the host path before anything else, because each one converts the entire host loop from hidden work into a GPU bubble.
Host-fed plans
Those three arrays never needed to come from the device. The DFLASH family guarantees that the verify and draft ForwardBatch carry seq_lens_cpu = prefix + draft_token_num, asserted at three independent call sites, and that equals exactly the kv length the device-side path computes. The host already knew the answer it was stalling to read back.
- fa2 side. Install fast_prefill_plan on the per-batch-size target-verify wrappers at capture time, gated on the DFLASH verify input type so EAGLE's target-verify is untouched, plus an assertion that no custom mask is present (fast plans do not support one; DFLASH never has one).
- MLA side. Build the plan kwargs from seq_lens_cpu in pure host arithmetic with zero D2H, write kv_indices directly into the wrapper's CUDA-graph buffer through a new kv_indices_buf parameter, and call fast_mla_decode_plan(causal=True), skipping three blocking D2Hs and four device buffer refreshes. Capture still runs the real plan(), which is what populates the cached module and the wrapper's buffers.
The other two fixes required no extra work. graph.replay() was always a pure enqueue; nothing prevented the CPU from queueing draft graph → verify prep → verify graph back to back except the D2H standing in the middle. With it removed, verify metadata prep and both graph launches are enqueued while the draft graph is still executing, and the two graphs run back to back on the GPU.
結果
Each environment flag was A/B'd on its own before anything was combined:
| Flag (measured individually) | Accept length | Mean TPOT | Verdict |
|---|---|---|---|
| none (overlap on, radix cache off) | 4.49 | 1.48 ms | clean baseline |
SGLANG_OPT_FUSED_KDA_VERIFY=1 | 4.68 | 1.34 ms | safe, kept |
The flag-level trajectory, at a fixed speculation configuration, all at 8192-in / 1024-out and concurrency 1: synchronous scheduling 1.67 ms → overlap scheduling with the radix cache off 1.48 ms (the scheduler tail's idle window collapsed from 1118 µs to 85 µs) → fused KDA verify 1.34 ms.
The deployed configuration, measured over 1000 requests at concurrency 1: accept 9.95, mean TPOT 0.78 ms, median TPOT 0.51 ms, 1120 tok/s output throughput, 1945 tok/s peak. The 9.95 accept length was measured with a block_size 16 DSpark draft; the released draft checkpoint uses block_size 8. DSpark takes no speculative-num-steps / draft-tokens flags; those are NEXTN-only.
Multiplying median TPOT by mean accept length gives 0.51 × 9.95 ≈ 5.1 ms, close to the step time the earlier trace measured (about 5.3 ms in total, before the KDA fusion). Read that only as a rough consistency check: it mixes a median with a mean, and against a distribution this wide it is not the median step time. Measuring step time directly from the trace is the way to close it, and we have not done that for the DSpark configuration. What the trace does support is the qualitative conclusion: the host is out of the way again, and what remains is on the GPU.
Where the time goes now
MoE grouped GEMM 1215 µs, router / activation / glue small kernels 1127 µs, all-reduce 951 µs, dense GEMM 918 µs, KDA 488 µs, MLA attention at 8k context 244 µs, plus 400 µs of residual idle. The host is fully hidden; what remains is GPU work, and weight bandwidth dominates it.
This census is the NEXTN configuration; DSpark redistributes the step (a wider verify window, a second draft-model graph) but not the conclusion.
MLA attention at 8k context is 244 µs. Long context is not the problem here, a consequence of the hybrid architecture. MoE plus dense GEMM is about 2.1 ms, nearly all of it weight bandwidth.
So the roadmap is short:
- fp8 weights are the remaining large lever. Halving the bytes on 2.1 ms of bandwidth-bound work is a structural 15-20%, far outside the metric's noise band. The accept-length remedy already exists (bf16 draft), and the block-quantization TP constraint is known: with moe_intermediate_size = 768 and block 128, TP4 is not feasible; it requires --ep-size 4.
- Router fusion has reached its sensible endpoint. Folding the gate matvec into the top-k kernel would collapse parallelism from 129×M CTAs to M/BLOCK_M. PDL chaining is the right stopping point for that path.
- Host environment engineering. Core pinning and GC tuning for the scheduler processes, which is really a way of defending run-ahead slack rather than a kernel optimization.
Reproducing
SGLANG_ENABLE_METADATA_GLUE_GRAPH=1 \
SGLANG_OPT_FUSED_KDA_VERIFY=1 \
SGLANG_ENABLE_FUSED_VERIFY_EXTEND_GRAPH=1 \
python3 -m sglang.launch_server \
  --model-path inclusionAI/Ling-3.0-flash \
  --tp-size 4 --trust-remote-code \
  --speculative-algorithm NEXTN \
  --speculative-num-steps 5 \
  --speculative-eagle-topk 1 \
  --speculative-num-draft-tokens 6 \
  --attention-backend trtllm_mla \
  --flashinfer-allreduce-fusion-backend auto \
  --mem-fraction-static 0.85
For the DSpark configuration, swap the speculation flags for a DSpark draft checkpoint:
SGLANG_OPT_FUSED_KDA_VERIFY=1 \
python3 -m sglang.launch_server \
  --model-path inclusionAI/Ling-3.0-flash \
  --tp-size 4 --trust-remote-code \
  --speculative-algorithm DSPARK \
  --speculative-draft-model-path inclusionAI/Ling-3.0-flash-dspark \
  --attention-backend trtllm_mla \
  --flashinfer-allreduce-fusion-backend auto \
  --disable-radix-cache
Either configuration is benchmarked the same way:
python3 -m sglang.bench_serving --backend sglang \
  --dataset-name random --num-prompts 1000 \
  --random-input-len 8192 --random-output-len 1024 \
  --random-range-ratio 1.0 --max-concurrency 1
Acknowledgments
This work was a collaboration between the RadixArk SGLang Team and the Ant Ling Infra Team. Thanks to DeepInfra and Novita for serving Ling-3.0-flash on SGLang.
Ant Ling Infra Team, Ant Group (sorted alphabetically by last name): Tiwei Bie, Yuan Luo, Dayu Qiu, Jianfeng Tan, Tongli Wang, Yue Yu, Kaihong Zhang. inclusionAI, Ant Group (sorted alphabetically by last name): Xiang Cao, Guoshan Lu, Junbo Zhao.
今日のまとめ
AIデイリーブリーフで今日の重要ニュースをまとめ読み