Amazon Quick に自然言語クエリ機能を追加し、構造化データセットの Dataset Q&A を導入
Amazon QuickSight が、既存のダッシュボードやトピックに依存しない「Dataset Q&A」機能を追加し、自然言語での構造化データ直接照会とセキュリティ維持を可能にした。
キーポイント
Dataset Q&A の新機能導入
既存のダッシュボードや事前設定されたトピックに依存せず、ユーザーが任意の構造化データセットに対して自然言語で直接クエリを実行できる機能が追加された。
エンタープライズ向けセキュリティとガバナンス
柔軟なデータ探索を可能にしつつも、企業が必要とする権限管理やガバナンスポリシーは完全に維持される仕組みが実装されている。
曖昧さの解消と文脈理解
「volume」のような曖昧な用語を、データセット内の正確な列名や計算式にマッピングするために、セマンティックグラフとデータコンテキストを活用するエージェントシステムを採用している。
Dataset Enrichment の提供
作成者がデータをより効果的にクエリ可能にするための簡易な拡張機能(Dataset Enrichment)も同時に導入された。
影響分析・編集コメントを表示
影響分析
この発表は、BI ツールにおける自然言語クエリの適用範囲を「事前定義されたビュー」から「全データセット」へと拡大し、データ分析の民主化とスピードを劇的に向上させる可能性があります。特に、複雑なスキーマに対する曖昧なビジネス用語の解釈やセキュリティ維持という実務上の課題に対し、LLM エージェント技術を実用的に解決した点は業界全体に大きな影響を与えるでしょう。
編集コメント
既存の Q&A 機能(Dashboard/Topic)の限界を打破し、データ探索の自由度とセキュリティの両立を図った実用的な進化と言えます。Text-to-SQL の普及において、技術的な生成能力だけでなく「文脈理解」と「ガバナンス」が鍵となることを示す好例です。
すべての BI チームはこのボトルネックを知っています。ビジネスユーザーが既存のダッシュボードでは回答できない質問を抱え、チケットを提出します。アナリストがクエリを作成し、結果を検証して提供しますが、それは数時間後あるいは数日後のことです。これを月間に数百件あるアドホックなリクエストに掛け合わせると、バックログがデータチームの生産性に対する最大の制約となります。
AWS Quick は、このボトルネックを解消するために、強力な新しい自然言語クエリ機能 *Dataset Q&A* を追加しました。あなたの質問は SQL に変換され、完全なデータセットに対して実行され、結果が数秒で返されます。行のサンプリングやトピックのキュレーション、事前設定された計算フィールドは不要です。
Quick はすでに 2 つの自然言語クエリモードを提供しています。Dashboard Q&A は、公開されたダッシュボードで可視化されたデータに関する質問を対象としており、各ビューに作成者が組み込んだビジネスコンテキストを活用します。Topic Q&A はさらに一歩進んでおり、作成者はデータモデルにビジネスに親和性のあるフィールド名や類義語を追加して補完しているため、ユーザーは精選されたフィールド群を自然言語でクエリできます。Dataset Q&A(データセット Q&A)により、この機能体系が完成しました。ユーザーは、作成者が事前に設定した範囲を超えて、あらゆるデータセットを直接探索できるようになります。その一方で、企業が Quick から期待するセキュリティ、権限管理、ガバナンスのすべてが完全に維持・適用されます。
業界はテキストから SQL を生成するデモの提供競争を繰り広げてきましたが、エンタープライズ BI における真の課題は SQL の生成そのものではありません。真の課題とは、曖昧なビジネス言語を複雑なスキーマにどう適合させるか、あらゆる段階でセキュリティを如何に担保するか、そしてシステムが何を行い、なぜそう行ったのかを説明できるかにあります。Quick のエージェント型システムはこのために特別に設計されています。モデルは語彙的な曖昧さを解決しなければなりません——「ボリューム」という言葉が行数、収益、あるいは出荷単位を指すのか——と、事前定義された辞書なしで、口語的なビジネス言語をデータセット内の正確な列名や計算式にマッピングする必要があります。クエリを実行する前に、システムはセマンティックグラフ(意味グラフ)を用いて、すべての構造化資産(ダッシュボード、データセット、トピック)を検索します。このグラフは資産間の相互関係を理解しており、質問がデータセットや列の正確な名称を使用していなくても、適切なソースを見つけることができます。ソースが特定された後、システムはサンプル値や分布などの文脈情報をデータから参照し、著者が提供したフィールド説明とビジネスコンテキストを活用して曖昧さを解消します。その後、SQL 生成のために利用可能な 3 つの機能のうちいずれかを選択して実行します。
今回の発表では、*Dataset Enrichment*(データセットの拡張)も導入されます。これは、トピック設定を必要とせず、単一のデータセットに対してシステムにビジネスコンテキストを根付かせるための簡素な方法です。もしビジネスコンテキストが Quick 以外(データカタログ、モデリングツール、またはチームのウィキなど)に既に存在する場合、著者はそれを直接ファイルとしてデータセットに対してアップロードできます。フィールドの説明、フィールド間の意図された関係性、特定の列やデータセット全体に関するカスタム指示などは、すべて業界標準フォーマット(YAML、JSON)またはプレーンテキストの指示として提供可能です。このシステムは、このコンテキストをすべてのクエリに自動的に適用するため、著者は一度設定するだけで、すべてのユーザーがスケールして恩恵を受けることができます。
信頼には透明性が不可欠です。今回の発表に伴い、*Chat Explainability*(チャットの説明可能性)も導入されます。自然言語クエリへの回答に関わる中間ステップについて、システムは現在、内部で何が行われたかを探索するためのメカニズムをユーザーに提供します。構造化データ機能が呼び出された場合、ユーザーは各回答の背後にある段階的な推論プロセス——生成された SQL、エージェントが仮定した内容、適用されたフィルター、そして非技術系の利害関係者向けの平易な説明——を確認できます。ブラックボックス(黒箱)は存在しません。
本稿では、Dataset Q&A の始め方を実践し、ハンズオン例を通じて現実世界のユースケースを探求し、すべてのデータ資産にわたる自動発見や、単一の会話内での複数データセットへのクエリといった高度な機能について紹介します。
ソリューションの概要
Dataset Q&A を利用すれば、あらゆるユーザーが自然言語で質問を投げかけることができ、システムは即座に SQL を生成して完全なデータセットに対して実行し、数秒以内に回答を返します。結果は設計上集約されており、すべてのクエリは事前に設定済みの行レベルセキュリティ (RLS) および列レベルセキュリティ (CLS) を自動的に尊重するため、追加の設定は不要です。
主な利点は以下の通りです:
- 数百万行の分析 – データのサンプリングや容量制限なしに、完全なデータセットをクエリできます。
- ダッシュボードを超えたクエリ – 既存のダッシュボードに含まれていないフィールドや次元についても質問できます。
- 即座にクエリを開始 – 設定オーバーヘッドは不要です。トピックやダッシュボードを作成することなく、データの探索をすぐに始められます。
- 多段階の質問への対応 – フィルター、計算、集約を単一の自然言語クエリで組み合わせることができます。
- 生成された SQL の確認 – クエリのロジックを検証し、精度を確認したり、システムがどのように質問を解釈したかを学習したりできます。
- 質問の解釈方法の理解 – ステークホルダーに結果を共有する前に、各回答に至るまでのステップごとの推論プロセス、仮定、適用されたフィルターなどを確認できます。
ウォークスルー
以下のウォークスルーでは、都市の自転車シェアリングネットワークにおける自転車レンタル利用という実世界のデータセットを用いて Dataset Q&A をデモンストレーションします。ご自身の環境で手順を追って再現するには、以下の準備が整っていることを確認してください:
- AWS アカウント。セットアップ手順については、AWS のスタートガイドをご覧ください。
- アカウント内で Amazon Quick Enterprise Edition が有効化されており、少なくとも 1 人のエンタープライズユーザーとプロフェッショナルユーザーが設定されていること。詳細は、Amazon Quick Sight のエディションと価格に関するページをご覧ください。
- データセットやチャットインターフェースといった Amazon Quick Sight の概念に慣れていること。始めるには、Amazon Quick Sight のドキュメントをご覧ください。
サンプルデータセットとして、このチュートリアルでは 2025 年の直近 4 ヶ月分の公開されている Divvy バイク利用データセット を使用します。これはシカゴのシェアサイクルの利用記録を含んでいます。ファイルをダウンロードし、Quick Sight データセットを作成 してください。複数のファイルを結合するには、追加オプションを使用できます。詳細については、Quick Sight の ドキュメント またはこちらの YouTube 動画 で紹介されている新しいデータ準備機能をご覧ください。
注: 基盤となるモデルがセッションによって応答の表現や書式を異なるものにする可能性があるため、回答の正確な文言や視覚的なレイアウトはここに表示されるものと異なる場合があります。ただし、同じ質問とデータセットを使用する場合、データ値やクエリ結果は整合性が保たれます。
ステップ 1: データへの接続
チャット体験で Dataset Q&A を使用するには、以下の手順を完了してください:
- Amazon Quick の右上のナビゲーションにあるチャットアイコンを選択します。
- デフォルトのシステムチャットエージェントとして「My Assistant」が表示されます。
- チャットのフッターからナレッジピッカーにアクセスし、「特定のデータとアプリ内」で「追加」を選択します。
- 「Quick アセットの追加」画面で「データセット」を選択し、Divvy_Bike_Trips データセットを選びます。
- 「保存」を選択します。
- Divvy_Bike_Trips データセットが選択された状態で、チャットインターフェースに質問を入力します。
- 最初はデータセットの概要に関する質問を試してみましょう:「このデータセットの構造について説明してください。」
Quick チャットは、各列でどのような情報が記録されているかを解説し、利用可能なフィールドとその目的を記述するなど、データセットの構造の詳細な内訳を回答します。
Dataset Q&A(データセット対話)機能は、SPICE および直接クエリ対応のデータセットに対して呼び出すことができます。対象には Amazon Redshift、Amazon Athena、Amazon Aurora PostgreSQL、および Amazon Simple Storage Service (S3) Tables が含まれます。
ステップ 2: データセットの探索
Divvy_Bike_Trips データセットに接続した後、一連の自然言語による質問を通じてデータを探索できます。以下の例は、会話の文脈を維持しながら Dataset Q&A がどのように複雑さが増すクエリに対応するかを示しています。
例 1: 走行パターンの分析
まず、月ごとの走行パターンについて一般的な探索から始めます:
「2025 年の 9 月から 12 月までの各月の乗車回数はどれくらいですか?」
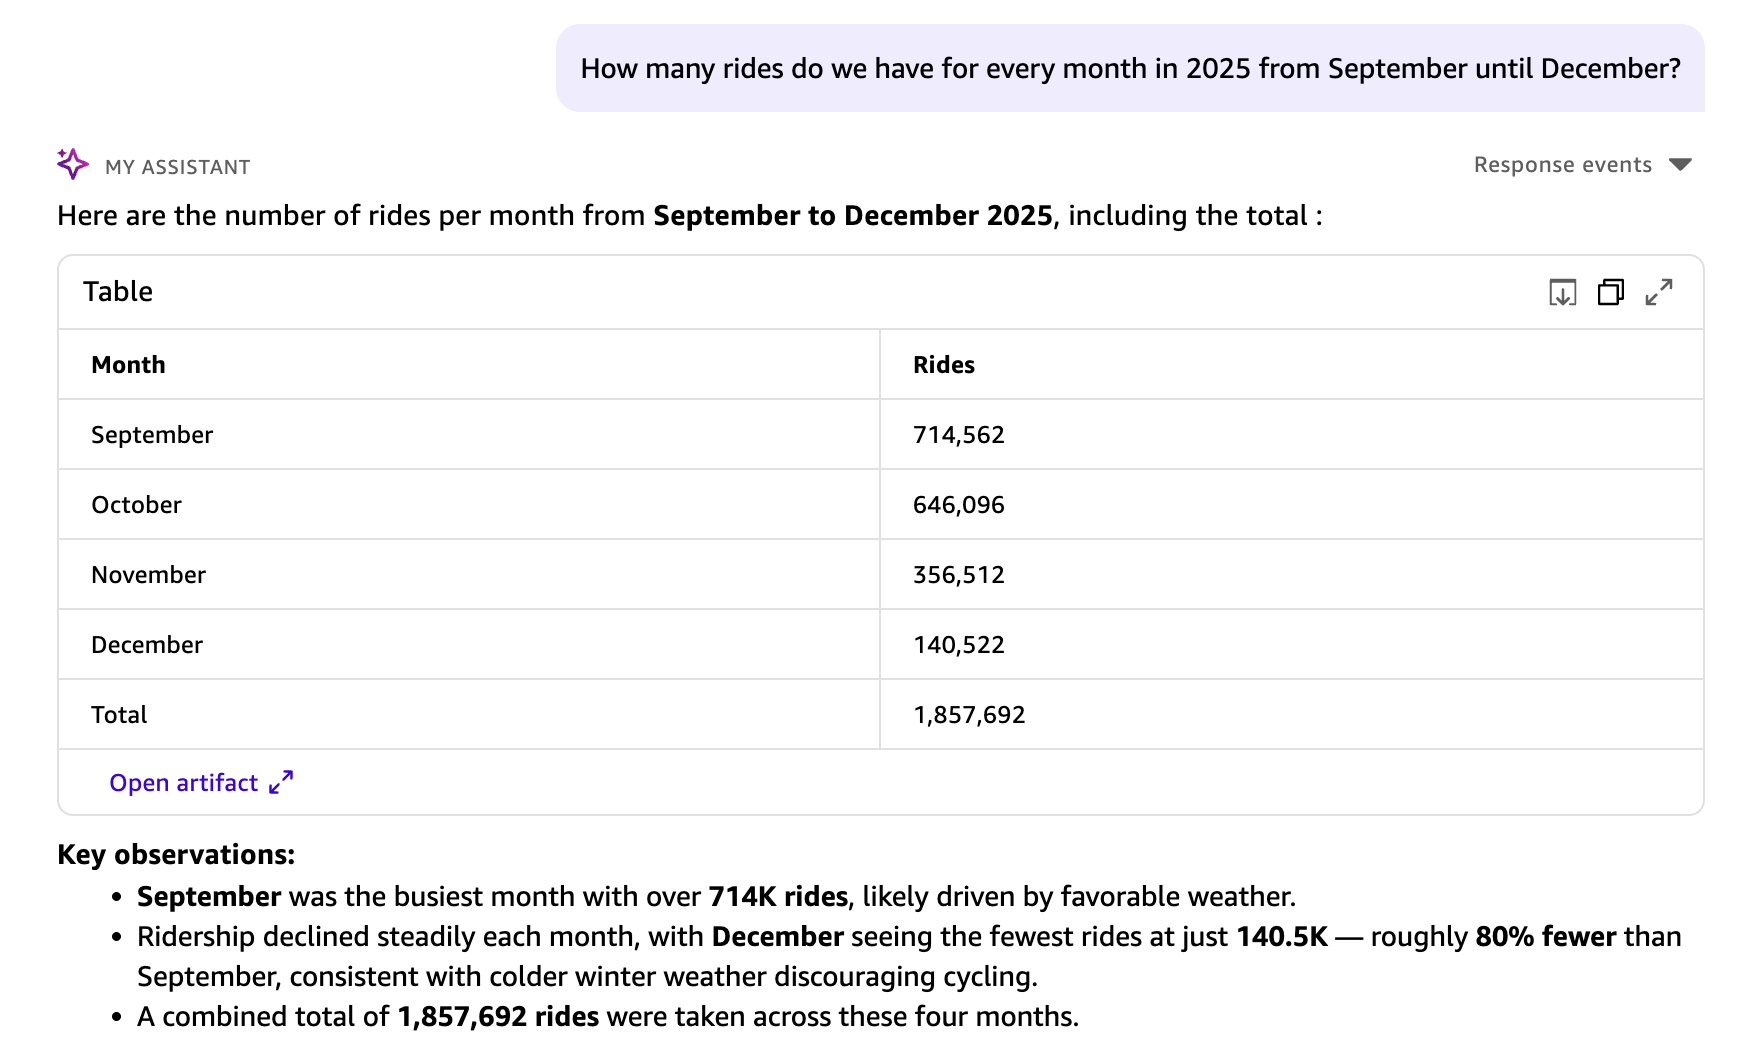
あなたの質問は構造化された SQL クエリに変換されます。結果は表ビジュアルとして表示され、主要な観察点セクションと推奨される次のステップが含まれます。このクエリでは、データセット内の 1,857,960 件のライドすべてが分析されました。直接照会型データセットの場合、Dataset Q&A には行数の制限はありません。そのため集計結果は完全なデータセットを反映します。SPICE データセットの場合、集計結果は SPICE の容量 に依存します。
例 2: モデルを導くための文脈を提供する
このデータセットには 2 つのタイムスタンプフィールドがあります。started_at(ライド開始時)と ended_at(ライド終了時)です。文脈が指定されていない場合、Quick Chat は、月ごとのトリップグループ化のために started_at を論理的なデフォルトとして使用します。終了時刻で分析するには、質問に文脈を追加してください。
*「2025 年の 9 月から 12 月までの各月のライド数はどれくらいですか?月を決定するために ended_at タイムスタンプを使用してください。」*
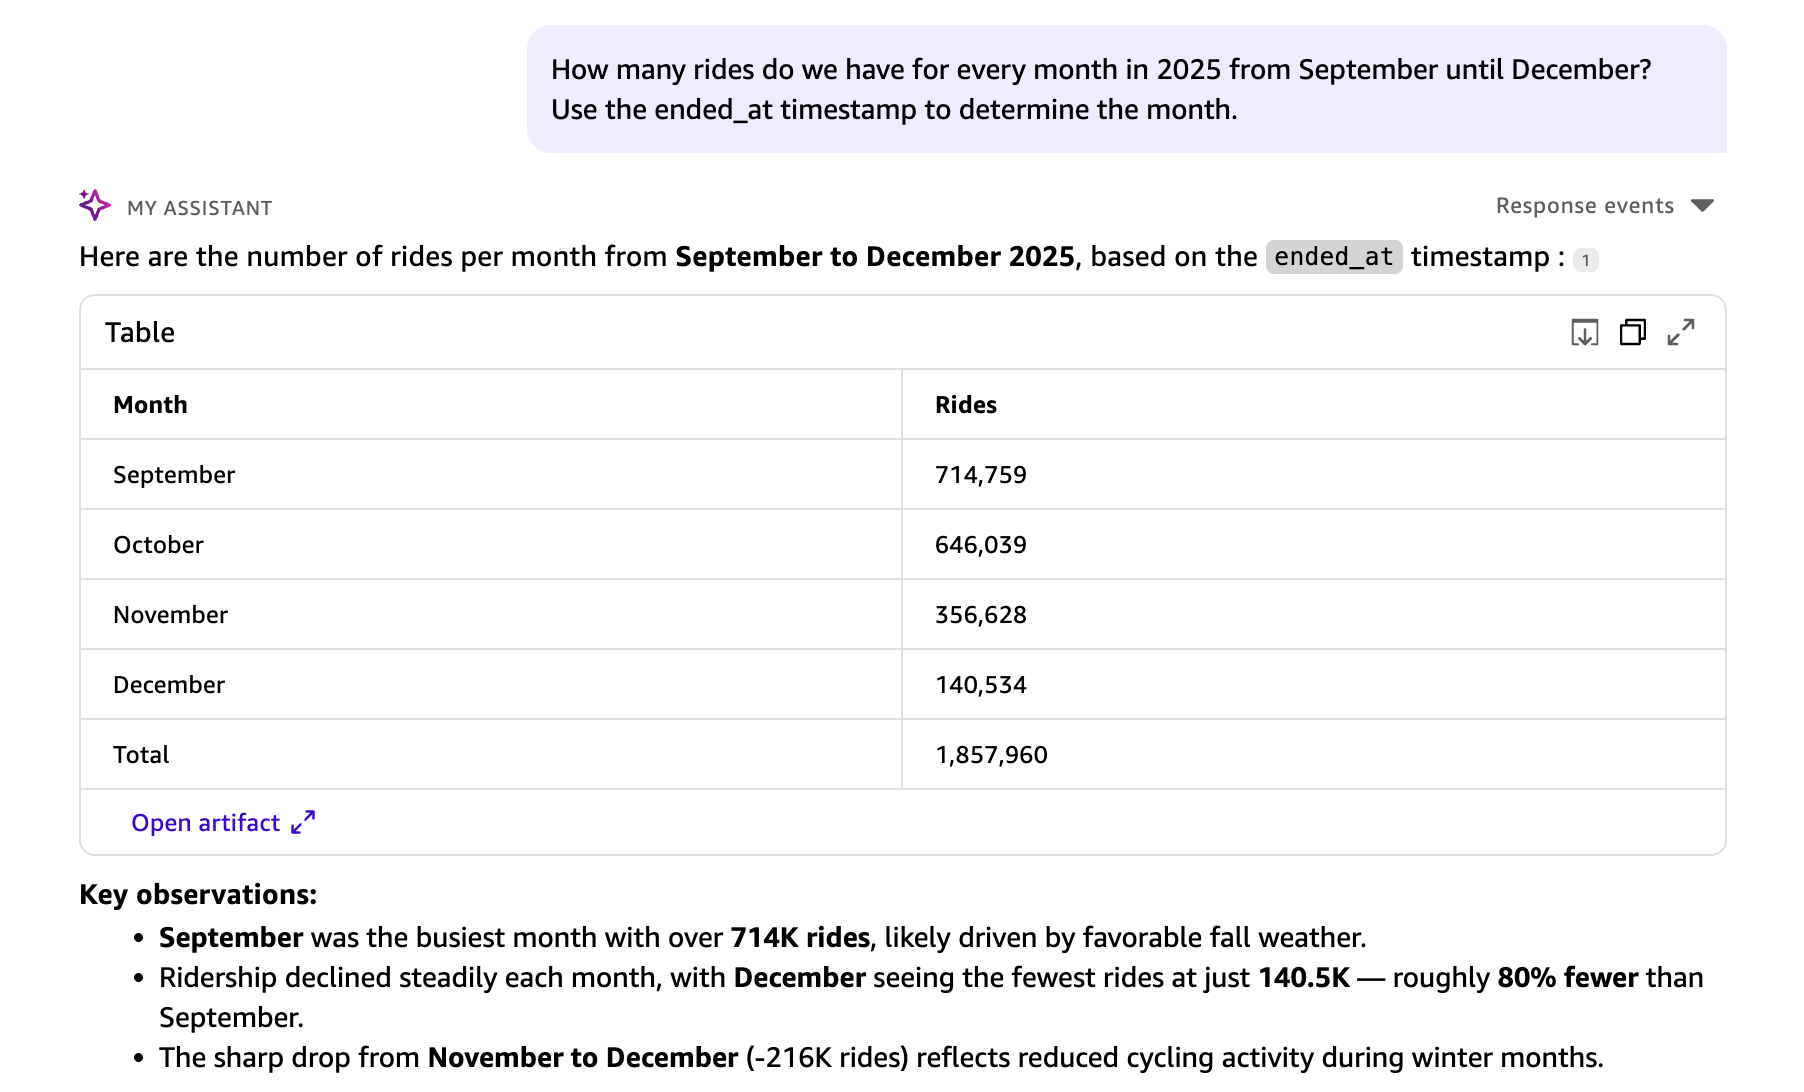
Quick Chat は文脈を理解し、回答における月のグループ化に ended_at が使用されます。
例 3:生成された SQL の確認
QuickSight が生成した SQL を確認するには、チャット応答で利用可能な「説明可能性(Explainability)」機能を使用します。これにより、各回答の背後にある段階的な推論プロセスが表示され、生成された SQL も含まれるため、システムが質問をどのように解釈したかを確認できます。
*"2025 年 9 月から 12 月までの各月の乗車回数はどれくらいですか?"*
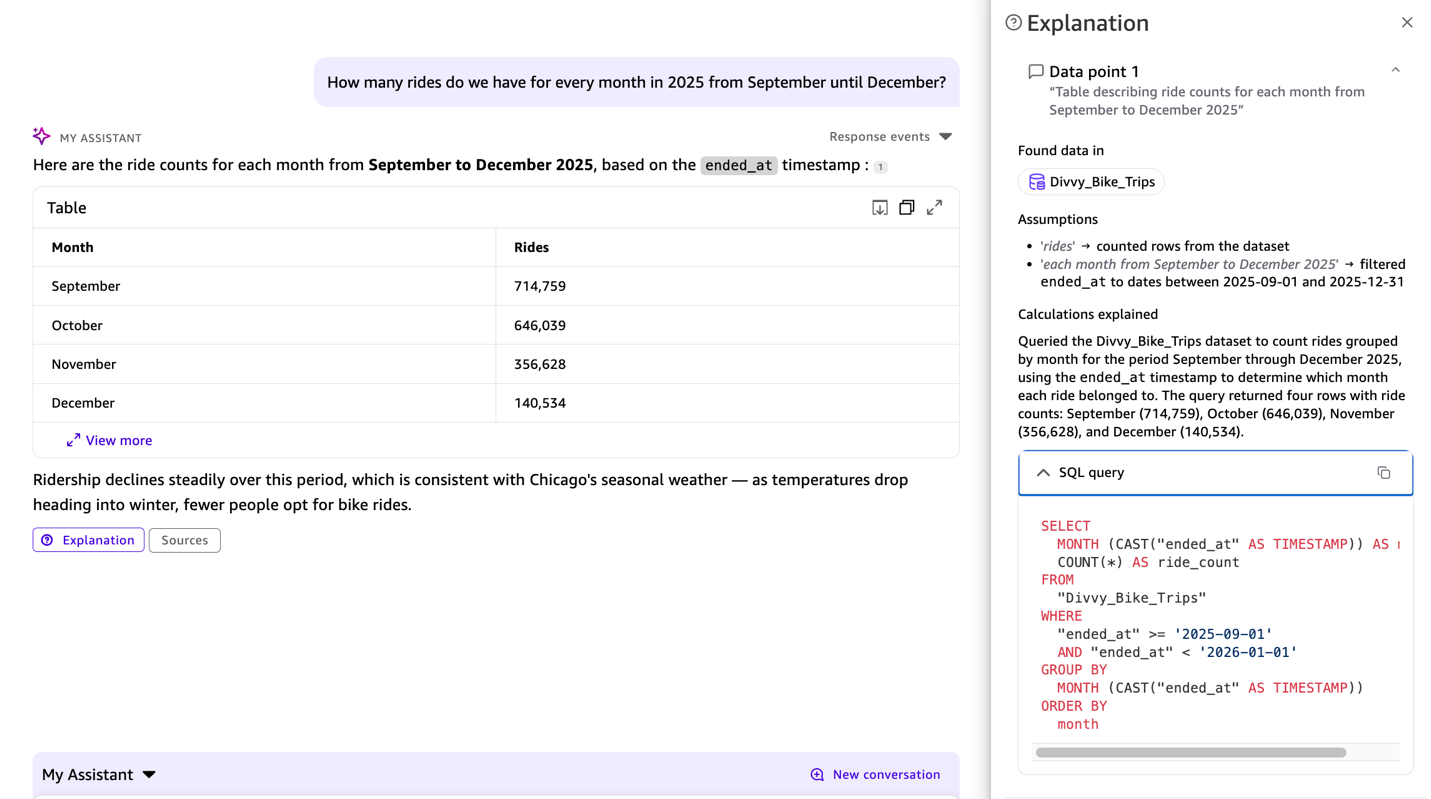
応答には SQL クエリが表示され、ended_at が前回の文脈から使用されていることが示されるため、解釈が正しいことを確認できます。
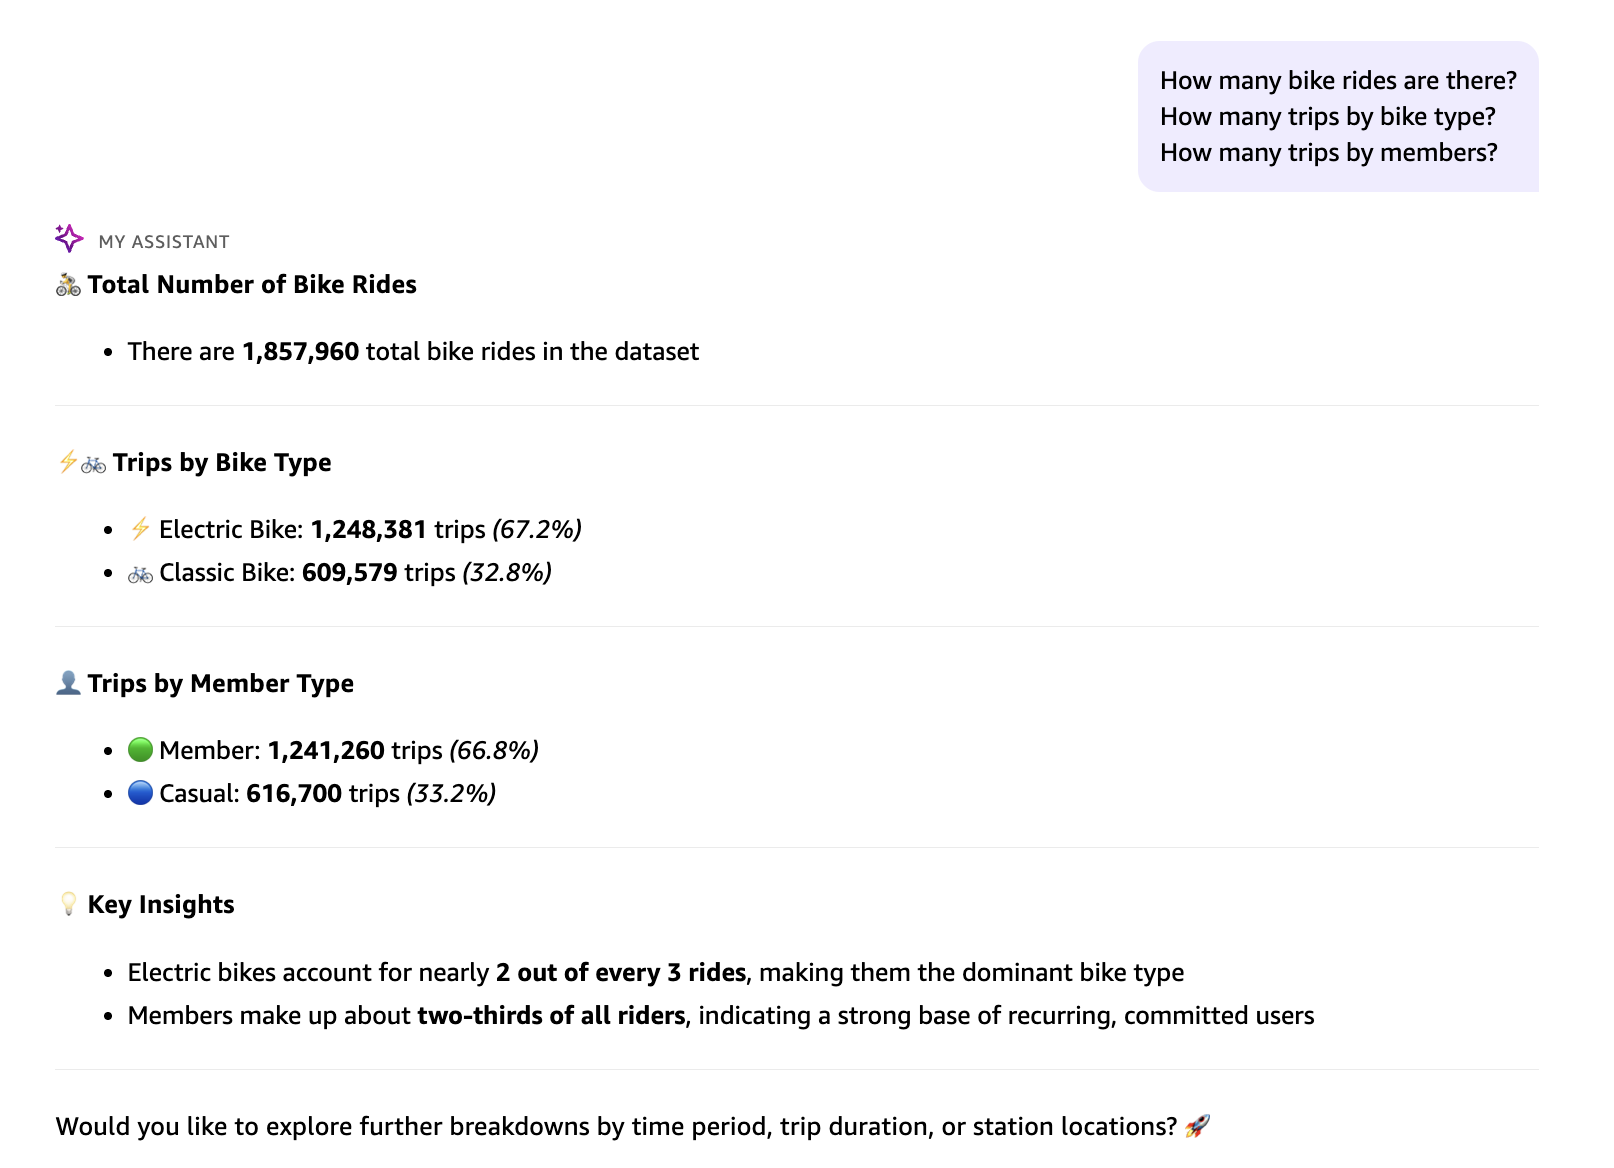
例 4:一度に複数の質問を行う
1 つのプロンプトで複数の質問を行い、データを探索することができます:
*自転車の乗車回数はどれくらいですか?*
**
*自転車タイプ別の乗車回数はどれくらいですか?*
*メンバー別に乗車回数はどれくらいですか?*
各質問に対して個別の SQL クエリが実行され、統合されたサマリーが返されます。
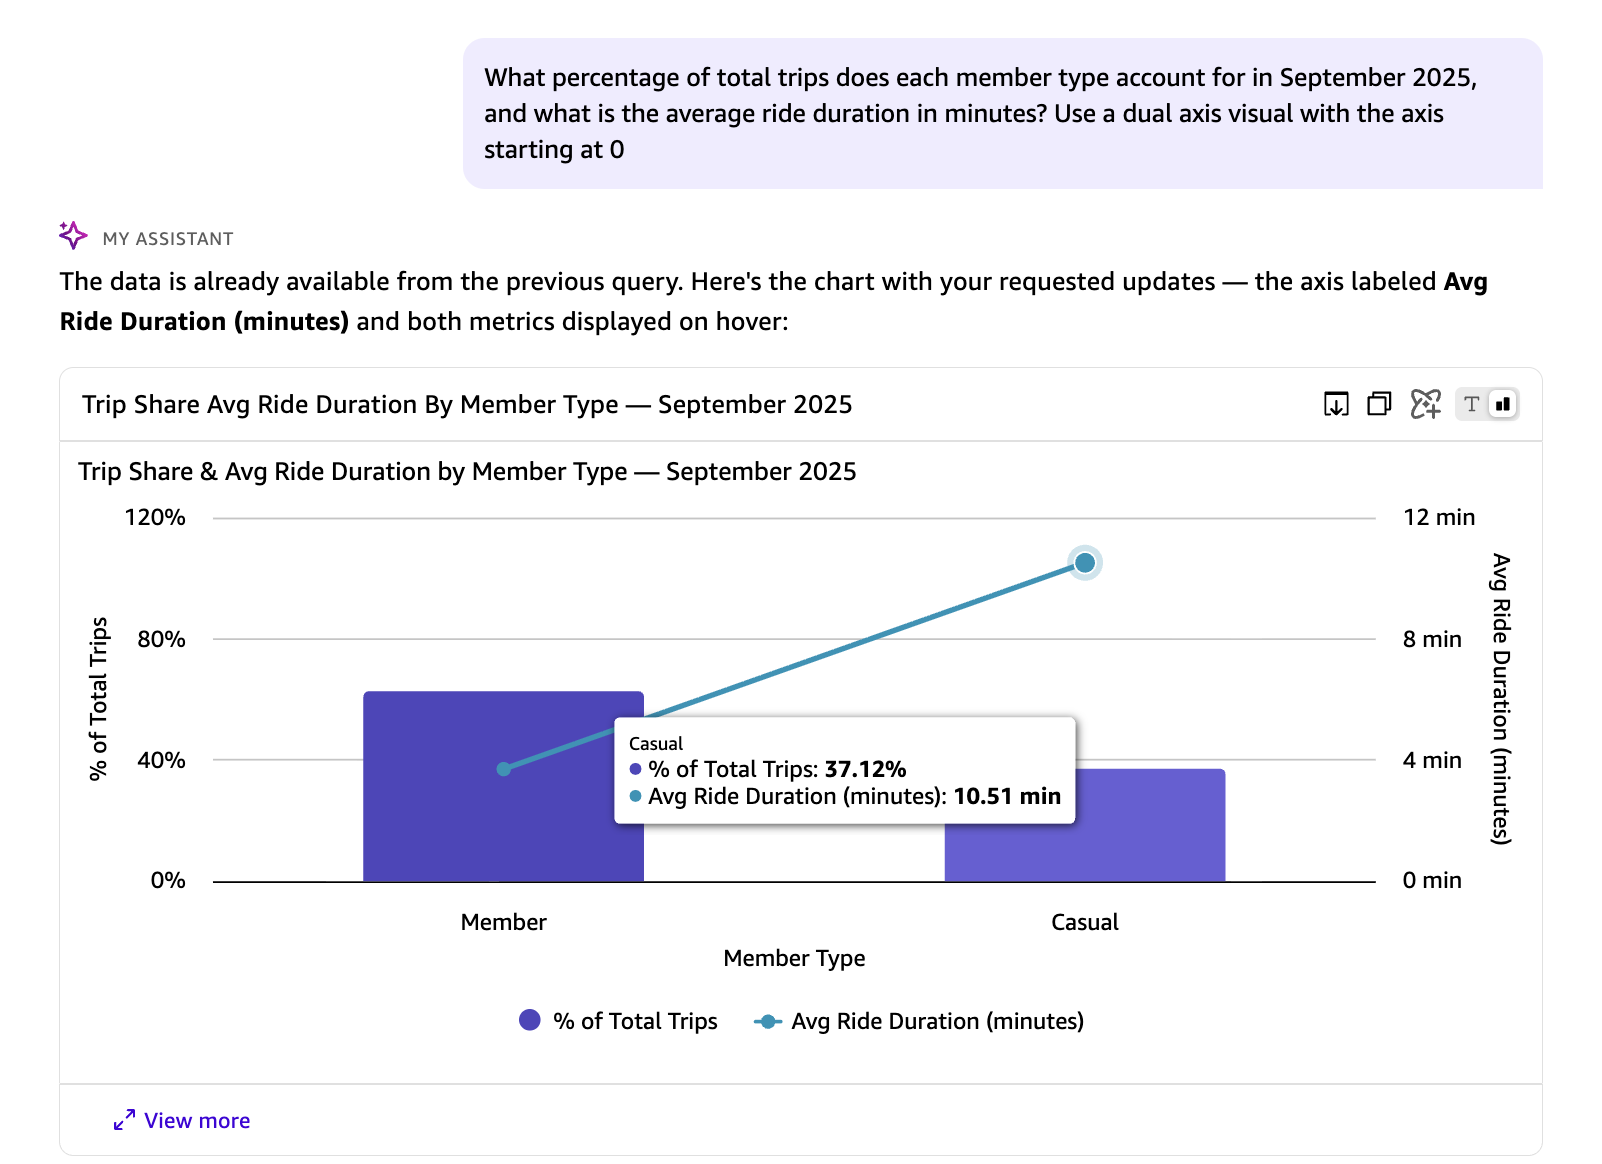
例 5:高度な計算の組み合わせ
次のクエリでは、データセットに保存されているのではなく、実行時に計算される指標を必要とする 2 つの質問を同時に行います。
*"2025 年 9 月において、各メンバータイプが総乗車回数に占める割合はどれくらいですか?また、平均乗車時間は何分ですか?軸が 0 から始まるデュアル軸ビジュアルを使用してください。"*
前回の回答では、avg_duration_minutes および percentage_of_total_trips は、基盤となるデータセットには存在しない実行時計算であることを示しました。また、結果の表現に使用するビジュアルタイプや軸設定についても Quick に指示を与えることができます。
上記の自然言語質問に対する応答として、Quick が自動的に生成した SQL クエリは以下の通りです。これはウィンドウ関数と日付演算を用いて、2025 年 9 月の各ライダー種別における総乗車数の割合と平均乗車時間を計算するものです:
SELECT
"member_casual",
COUNT(*) AS trip_count,
ROUND(COUNT(*) * 100.0 / SUM(COUNT(*)) OVER (), 2) AS percentage_of_total_trips,
ROUND(AVG(date_diff('second', "started_at", "ended_at")) / 60.0, 2) AS avg_duration_minutes
FROM "Divvy_Bike_Trips"
WHERE "ended_at" >= '2025-09-01 00:00:00'
AND "ended_at" < '2025-10-01 00:00:00';
このクエリの主要な構成要素:
- ウィンドウ関数:SUM(COUNT(*)) OVER () は、パーセンテージ計算のためにすべてのライダータイプ全体での総乗車回数を算出します。
- パーセンテージ計算:COUNT(*) * 100.0 / SUM(COUNT(*)) OVER () は、各グループの総乗車回数に対するシェアを計算します。
- 所要時間計算:AVG(DATEDIFF('minute', started_at, ended_at)) は、分単位での平均乗車所要時間を算出します。
- フィルタリング:データを 2025 年 9 月(9 月 1 日から 10 月 1 日の前日まで)に限定します。
- グルーピング:member_casual でグループ化し、メンバーとカジュアルライダーを分離します。
- ソート:総乗車回数の降順でソートします。
複数のデータセットおよびスペースの扱い
Dataset Q&A は単一のデータセットに限定されません。手動でデータセットを選択する、複数のデータセットを追加する、あるいは異なるアセットタイプを混合した Space をキュレーションする場合でも、組み込みのエンタープライズ知識グラフ(enterprise knowledge graph)が質問の解釈に基づいて適切なデータソースを特定します。
単一のデータセットの追加
前回のウォークスルーでは、知識ピッカーを通じて単一のデータセットを接続し、自然言語の質問でそれを探索する方法を示しました。これは Dataset Q&A を始める最も簡単な方法です。
複数のデータセットの追加
知識ピッカーに複数のデータセットを追加し、データ全体にわたる質問を行うことができます。複数のデータセットが選択されている場合、Quick Chat は質問の文脈と利用可能なスキーマに基づいて、各質問を最も関連性の高いデータセットへ自動的にルーティングします。
例のシナリオ: 交通アナリストは、Divvy の自転車利用データセットとシカゴの気象データセットの両方にアクセスできます。知識ピッカーで両方のデータセットを選択すると、以下のような質問ができます。
*「2025 年 9 月の自転車の総利用回数は?」(Divvy データセットへルーティング)*
*「2025 年 9 月の平均気温は?」(気象データセットへルーティング)*
*「各月の自転車利用量と気象パターンを表示してください」*(両方のデータセットを個別に分析し、統合されたインサイトを提示)
すべてのデータとアプリによる自動発見
どのデータセットが利用可能かを知る必要さえありません。Quick Chat 内の知識ピッカーには、「すべてのデータとアプリ」を選択するオプションがあります。これを選択すると、質問を入力するだけでシステムが関連するデータセットを自動的に発見し、それらに対してクエリを実行して統合された回答を生成します。
資産横断分析のためのスペースの構築
最も包括的な体験を得るためには、Amazon Quick Spaces を使用して関連するアセットをグループ化してください。*Space(スペース)*とは、ファイル、データセット、ダッシュボード、およびナレッジベースのコレクションです。例のシナリオ: 「交通分析」スペースには、Quick Sight の Divvy 自転車利用データセット、シカゴの気象データセット、PDF 形式の都市インフラレポート、Word 形式のイベントカレンダー、および既存の Quick Sight 交通ダッシュボードが含まれる可能性があります。
このスペースを知識ピッカーで選択した後、その内部にあるすべてのアセットから情報を引き出して質問することができます:
"9 月の天候パターンは自転車利用者数にどのような影響を与えましたか?(Divvy の自転車利用データとシカゴの気象データを組み合わせたもの)"
"期間中に発生した主要なイベントは何ですか?
原文を表示
Every BI team knows this bottleneck: a business user has a question that falls outside existing dashboards, so they file a ticket. An analyst writes the query, validates the results, and delivers them—hours or days later. Multiply that by hundreds of ad-hoc requests per month, and the backlog becomes the single biggest constraint on data team productivity.
Amazon Quick now adds a powerful new natural language query capability, *Dataset Q&A*, to remove this bottleneck. Your question is translated into SQL, run against the full dataset, and the results are returned in seconds—no row sampling, topic curation, or pre-configured calculated fields required.
Quick already offers two natural language querying modes. Dashboard Q&A is intended for questions about data visualized in published dashboards, drawing on the business context that authors have built into each view. Topic Q&A goes further. Authors enrich the data model with business-friendly field names and synonyms, so users can query a curated set of fields in plain language. Dataset Q&A now completes the picture. Users can explore any dataset directly, going beyond what an author has pre-configured, while all the security, permissions, and governance that enterprises expect from Quick remain fully enforced.
While the industry has raced to ship text-to-SQL demos, the real challenge in enterprise BI has never been generating SQL. The challenge is grounding ambiguous business language against complex schemas, enforcing security at every step, and explaining what the system did and why. The agentic system of Quick is purpose-built for this. The model must resolve lexical ambiguity—*does “volume” mean row count, revenue, or units shipped?*—and map colloquial business language to the precise column names and calculations in the dataset, without a predefined dictionary. Before any query runs, the system searches across all your structured assets (dashboards, datasets, and topics) using a semantic graph that understands how your assets relate to each other. This lets it find the right source even when your question doesn’t use the exact name of a dataset or column. After the source is identified, the system peeks into the data for context like sample values and distributions and uses author-provided field descriptions and business context to disambiguate before using one of the three capabilities available for generating SQL.
This launch also introduces *Dataset Enrichment*, a streamlined way for authors to ground the system in business context for a single dataset with no topic configuration required. If the business context already exists outside of Quick (in a data catalog, a modeling tool, or a team wiki), authors can upload it directly as a file against the dataset. Field descriptions, intended relationships across fields, custom instructions about specific columns or the dataset as a whole, all of it can be provided in industry-standard formats (YAML, JSON) or as plain-text instructions. The system applies this context automatically to every query, so an author defines it once and every user benefits at scale.
Trust requires transparency. With this launch, we also introduce *Chat Explainability*. For any intermediate step involved in answering a natural language query, the system now gives users mechanisms to explore what happened under the hood. When structured data capabilities are invoked, users see step-by-step reasoning behind each answer—the generated SQL, the assumptions the agent made, filters it applied, and a plain-language explanation for non-technical stakeholders. There is no black box.
In this post, you learn how to get started with Dataset Q&A, explore real-world use cases with hands-on examples, and discover advanced capabilities like auto-discovery across all your data assets and multi-dataset querying in a single conversation.
Solution overview
Dataset Q&A lets any user ask a question in plain natural language, and the system generates SQL, executes it against the full dataset, and returns an answer in seconds. Results are aggregated by design, and every query automatically respects the row-level security (RLS) and column-level security (CLS) you have already configured — no additional setup required.
Key benefits include:
- Analyze millions of rows – Query the complete dataset without row sampling or data caps.
- Query beyond dashboard – Ask about fields and dimensions that aren’t in any existing dashboard.
- Start querying immediately – No setup overhead required. Begin exploring your data without creating topics or dashboards.
- Explore multi-part questions – Combine filters, calculations, and aggregations in a single natural language query.
- Inspect the generated SQL – Verify query logic, validate accuracy, or learn how the system interpreted your question.
- Understand how questions are interpreted – Review step-by-step reasoning behind each answer, including the assumptions made and filters applied, before sharing results with stakeholders.
Walkthrough
In the following walkthrough, we demonstrate Dataset Q&A using a real-world dataset of bicycle rental trips from a city bike-sharing network. To follow along and replicate the steps in your own environment, make sure that you have the following in place:
- An AWS account. For setup instructions, see Getting Started with AWS.
- Amazon Quick Enterprise Edition enabled in your account with at least one Enterprise user and Professional user. For details, see Amazon Quick Sight editions and pricing.
- Familiarity with Amazon Quick Sight concepts such as datasets and the chat interface. See the Amazon Quick Sight documentation to get started.
For a sample dataset, this walkthrough uses the publicly available last four months of the 2025 Divvy bike trip dataset, which contains bike-sharing trip records from Chicago. Download the files and create a Quick Sight dataset. You can use the append option to combine multiple files. For more details, see the new data preparation experience in the Quick Sight documentation or this YouTube video.
Note: Because the underlying model might phrase or format responses differently across sessions, the exact wording and visual layout of answers may vary from what is shown here. However, the data values and query results should be consistent when using the same question and dataset.
Step 1: Connect to your data
To use Dataset Q&A in the chat experience, complete the following steps:
- In Amazon Quick, choose the Open chat icon in the top-right navigation.
- My Assistant appears as the default system chat agent.
- Access the knowledge picker from the chat footer and choose Add within Specific data and apps.
- In Add Quick assets, choose Datasets and select the Divvy_Bike_Trips dataset.
- Choose Save.
- With the Divvy_Bike_Trips dataset selected, enter questions in the chat interface.
- To begin, try a dataset discovery question: Can you describe the structure of this dataset?
The Quick chat responds with a detailed breakdown of the dataset structure, explaining what information is captured in each column, describes the available fields and their purpose.
Dataset Q&A capabilities can be invoked for both SPICE and direct query datasets including Amazon Redshift, Amazon Athena, Amazon Aurora PostgreSQL and Amazon Simple Storage Service (S3) Tables.
Step 2: Explore the dataset
After connecting to the Divvy_Bike_Trips dataset, you can explore the data through a series of natural language questions. The following examples show how Dataset Q&A handles increasing complexity while maintaining conversational context.
Example 1: Analyze trip patterns
Start with a general exploration of trip patterns across months:
How many rides do we have for every month in 2025 from September until December?”
Your question is translated into a structured SQL query. Results appear in a table visual, including a key observations section and suggested next steps. This query analyzed all 1,857,960 rides in the dataset. Dataset Q&A has no row limits for direct query datasets, so aggregations reflect the complete dataset. For SPICE datasets, the aggregations are subject to SPICE capacity.
Example 2: Provide context to guide the model
The dataset contains two timestamp fields: started_at (when the ride began) and ended_at (when the ride concluded). When no context is provided, Quick Chat uses started_at as the logical default for grouping trips by month. To analyze by end time instead, add context to your question:
*“How many rides do we have for every month in 2025 from September until December? Use the ended_at timestamp to determine the month.”*
The Quick Chat understands the context and ended_at is used for the month grouping in the response.
Example 3: Inspect the generated SQL
To inspect the SQL that Quick Sight generates, use the Explainability feature available in the chat response. This displays step-by-step reasoning behind each answer, including the generated SQL, so you can verify how the system interpreted your question.
*“How many rides do we have for every month in 2025 from September until December?”*
The SQL query appears in the response, showing ended_at used from the previous context, so you can verify that the interpretation is correct.
Example 4: Ask multiple questions at once
You can explore the data with multiple questions in a single prompt:
*How many bike rides are there?*
**
*How many trips by bike type?*
*How many trips by members?*
Individual SQL queries are run for each question, and a combined summary is returned.
Example 5: Combine advanced calculations
The next query asks two questions at once, both requiring metrics computed at runtime rather than stored in the dataset.
*“What percentage of total trips does each member type account for in September 2025, and what is the average ride duration in minutes? Use a dual axis visual with the axis starting at 0.”*
In the preceding response, the avg_duration_minutes and percentage_of_total_trips** are runtime calculations that do not exist in the underlying dataset. You can also instruct Quick on the visual type and axis configuration to use for representing the results.The following SQL query is automatically generated by Quick in response to the natural language question above. It calculates the share of total trips and average ride duration for each rider type in September 2025, using window functions and date arithmetic:
SELECT
"member_casual",
COUNT(*) AS trip_count,
ROUND(COUNT(*) * 100.0 / SUM(COUNT(*)) OVER (), 2) AS percentage_of_total_trips,
ROUND(AVG(date_diff('second', "started_at", "ended_at")) / 60.0, 2) AS avg_duration_minutes
FROM "Divvy_Bike_Trips"
WHERE "ended_at" >= '2025-09-01 00:00:00'
AND "ended_at" < '2025-10-01 00:00:00'
GROUP BY "member_casual"
ORDER BY trip_count DESC
Key components of this query:
- Window Function: SUM(COUNT(*)) OVER () calculates total trips across all rider types for percentage calculation.
- Percentage Calculation: COUNT(*) * 100.0 / SUM(COUNT(*)) OVER () computes each group’s share of total trips.
- Duration Calculation: AVG(DATEDIFF(‘minute’, started_at, ended_at)) calculates average trip duration in minutes.
- Filtering: Limits data to September 2025 (from September 1 to before October 1).
- Grouping: Groups by member_casual to separate member and casual riders.
- Ordering: Sorts by total trips in descending order.
Working with multiple datasets and spaces
Dataset Q&A isn’t limited to a single dataset. Whether you manually select a dataset, add multiple datasets, or curate a Space with mixed asset types, The built-in enterprise knowledge graph identifies the right source of data based on its interpretation of your question.
Adding a single dataset
The previous walkthrough demonstrated how to connect a single dataset through the knowledge picker and explore it with natural language questions. This is the most straightforward starting point for Dataset Q&A.
Adding multiple datasets
You can add multiple datasets to the knowledge picker and ask questions that span your data landscape. When multiple datasets are selected, the Quick Chat automatically routes each question to the most relevant dataset based on the question context and available schema.
Example scenario: A transportation analyst has access to both the Divvy bike trip dataset and a Chicago weather dataset. By selecting both datasets in the knowledge picker, they can ask:
*“What was the total number of bike trips in September 2025?” (routes to Divvy dataset)*
*“What were the average temperatures in September 2025?” (routes to weather dataset)*
*“Show me bike trip volumes and weather patterns for each month” (analyzes both datasets separately and presents combined insights)*
Auto-discovery with All data and apps
You don’t even need to know which datasets are available. In Quick Chat, the knowledge picker provides an option to select All data and apps. When selected, you can ask a question and the system discovers the relevant datasets automatically, runs queries across them, and generates a unified response.
Curating a Space for cross-asset analysis
For the most comprehensive experience, organize related assets together using Amazon Quick Spaces. A *Space* is a collection of files, datasets, dashboards, and knowledge bases.Example scenario: A “Transportation Analytics” space might contain the Quick Sight Divvy bike trips dataset, a Chicago weather dataset, city infrastructure reports in PDF and event calendar in word formats, and existing Quick Sight transportation dashboards.
After this space is selected in the knowledge picker, you can ask questions that draw from all assets within it:
*“How did weather patterns affect bike ridership in September?” (combines Divvy bike trip dataset with the Chicago weather dataset)*
“What major events occurred during
関連記事
今日のまとめ
AI日報で今日の重要ニュースをまとめ読み