公開データから大規模な現実的な電力送電網データの構築:パイプラインの紹介
Microsoft Research は、公開データのみを用いて米国全土の送電網を再現するパイプラインと大規模オープンデータを公開し、AI や物理ベースの研究におけるデータの壁を打破した。
キーポイント
公開データによる大規模モデル構築
機密情報や商用ライセンスに依存せず、公開されたデータのみから米国全 48 州および相互接続網を含む送電網のトポロジと電気パラメータを推定・構築するパイプラインを開発した。
AC-OPF分析対応の実用性
生成されたモデルは AC 最適潮流(AC-OPF)解析に対応しており、混雑、容量制約、需要立地などの物理ベースのシミュレーションを制限なく実施可能である。
AI・データ駆動型研究への貢献
大規模で物理的に妥当なグリッドデータの不足が課題となっていた中、このオープンデータセットは AI 学習やアルゴリズム評価のための基盤として機能し、送電網の拡張やデータセンター立地などの分析を加速する。
公開データのみによる大規模グリッドモデルの構築
OpenStreetMap や EIA、国勢調査などの公開データを組み合わせることで、48州および大陸全体をカバーする地理的・電気的に整合性のある送電網モデルを構築できる。
AC-OPF 解析による物理的妥当性の検証
単なるトポロジーの模倣ではなく、最適潮流計算(OPF)が解けることを条件にすることで、送電容量や電圧制限などの物理制約を反映した実用的なモデルであることを保証している。
不確実性の明示と汎用性
詳細な運用パラメータが不明な箇所については透明性のある実現可能性レポートとして不確実性を扱い、同様の公開データ源を持つ他の地域への適用も可能に設計されている。
大規模な公開データに基づくAC-OPFの解決
36州、20,000以上のバスからなる東部連系網全体で、公開データのみから導き出されたモデルが収束する交流最適潮流(AC-OPF)解を生成できることを実証した。
影響分析・編集コメントを表示
影響分析
この発表は、電力システム研究における最大のボトルネックである「高品質な機密データの欠如」を解消する画期的な一歩です。特に AI や機械学習を用いたグリッド最適化アルゴリズムの開発において、物理的に妥当な大規模データセットが利用可能になることで、実社会での応用可能性が劇的に向上します。これにより、再生可能エネルギーの統合やインフラ強化計画など、気候変動対策における意思決定プロセスが加速することが期待されます。
編集コメント
機密情報の壁を打破し、AI 研究コミュニティが実際に使える「物理的に正しい」大規模電力網データを提供した点は極めて重要です。これにより、従来は学術的仮説に留まっていた送電網の AI 最適化シミュレーションが、より現実的な検証段階へと移行できるでしょう。

一言で言うと
私たちは、公開されているデータのみを用いて地理的に根拠があり、電気的に整合性の取れた電力網モデルを構築し、米国の 48 州および複数州にまたがる相互接続をカバーするデータセットを公開しました。
これらのモデルは交流最適潮流(AC-OPF: AC Optimal Power Flow)解析をサポートしており、制限されたデータなしで、混雑、容量、需要立地に関する物理ベースの研究を可能にします。
私たちは、送電網拡張の可能性、特定の系統線のアップグレード、大規模データセンター負荷の配置といった応用例を実証しました。
Microsoft Research は、公開されているデータから導き出された米国電力網の近似送電網トポロジーを含むオープンデータセットを公開することを嬉しく思います。
送電レベルでの電力網挙動を研究できる能力は、現代の電力システム研究において不可欠です。混雑、送電網拡張、需要成長、システムの回復力に関する分析はすべて、現実的なトポロジー、電気パラメータ、地理的根拠を持つネットワークモデルに依存しています。
アメリカを含む世界のほとんどの地域では、現実的な送電レベルのグリッドデータは重要インフラ情報に分類され、厳格なアクセス制限の対象となっています。これらの制限には正当な理由が存在しますが、その結果として生じる現実的なグリッドモデルの欠如が、電力システムが直面する課題をますます悪化させています。新たな負荷をどこに追加できるか、またそれを支えるために追加の送電資産をどのように展開すべきかといった意思決定は、数年かかることも珍しくない、長期かつ不透明なプロセスによって制限されることが多いです。新しいツールやアルゴリズムを開発する研究者にとって、アクセスには長い承認サイクル、厳格な再配布禁止契約、あるいは高価な商用ライセンスが必要となるのが一般的です。
その結果、多くの人が数十個のバス(節点)しかない小さな「おもちゃ」ネットワークか、実際のインフラに対応していない合成モデルかの二者択一を迫られています。この現実的で共有可能なモデルの欠如は、グリッド分析や計画のためのトレーニングおよび評価手法に物理的に妥当な大量のグリッドデータを必要とするデータ駆動型および AI ベースのアプローチにおいて、特に制限要因となっています。
このような背景を踏まえると、自然と以下の疑問が浮かび上がります:
オープンデータのみを用いて、米国の電力システムが現代のストレスにどのように応答するかを実質的に理解し、かつそのシステムに対する実行可能な解決策の開発を促進することは可能でしょうか?
本研究では、専有または制限されたデータセットに依存することなく、既存のネットワークを現実的に近似する大規模な送電レベルの電力網モデルを構築するための、オープンデータ由来のパイプラインを紹介します。私たちはこのプロセスから導き出されたオープンデータセットを提供しており、これは 48 の米国州および相互接続スケールのネットワークにわたる送電レベルのモデルで構成されています。そのサイズは、わずか 11 バスからなる小規模システムから、21,697 バスを接続する東部相互接続グリッド全体まで多岐にわたります。このパイプラインは、十分なオープンな地理情報、エネルギーデータ、人口統計データが利用可能な米国本土において検証されており、同様の公開データソースを有する他の地域にも一般化できるように設計されています。
公開アクセス可能なデータセットのみを使用し、このパイプラインは州レベル、複数州にわたるレベル、および相互接続スケールで地理的に根ざし、電気的に整合性のある送電モデルを生成します。これらのモデルは、オープンデータから推定された送電回廊、変電所、発電所の地理的構造を保持しつつ、詳細な運用パラメータが利用できない場合には、透明性の高い実現可能性報告を通じて不確実性を明示的に考慮しています。
重要なのは、これらが玩具のネットワークや抽象的なベンチマークではないということです。生成されたモデルは広範な規模にわたって交流最適電力潮流(AC-OPF)解析をサポートし、送電容量が物理的に制約される場所、新たな需要を吸収できる場所、インフラの変更が現実的なネットワークレイアウトを通じてどのように伝播するかといった問いを、オープンデータのみを用いて物理ベースで調査することを可能にします。
本稿では、このアプローチを高レベルで説明し、それが可能にするシステムレベルの問いについて強調します。
パイプラインの仕組み
このパイプラインは、公開されている地理情報およびエネルギーデータを、地理的に根ざした電力潮流解析に使用可能な送電レベルのグリッドモデルに変換します。
出発点は OpenStreetMap(新しいタブで開く)であり、これは送電回廊、変電所、発電所の物理的レイアウトを符号化しています。この地理的な骨格には、発電容量、燃料ミックス、需要、運用境界(米国エネルギー情報局のエネルギー統計および米国国勢調査データを含む)を記述するオープンデータセットが追加され、モデルがトポロジーを超えて電力が生産・消費される様子を表現できるようにします。
重要なテストは解けるかどうかです。電力システム解析において、最適潮流(OPF)問題を解くことは、ネットワーク記述が電気的に整合しており実用的に関連性があるかを実践的に確認する手段となります。OPF は、送電線の容量や電圧制限、発電機の能力といった物理的制約を遵守しつつ、需要を満たすためにどのように発電を配分できるかを決定します。推定されたまたは合成されたネットワークの多くはこのテストに最初から失敗します:トポロジーは概ね正しく見えるかもしれませんが、他の重要な工学パラメータが欠落しているのです。
決定的な点は、このアプローチが小規模なベンチマークや「おもちゃ」のようなネットワークを超えていることです。具体的には、公開データソースのみから導出された東部連系網全体(36州にまたがり、20,000 以上のバスを有する)で交流最適潮流(AC-OPF)を解いています。これは、オープンデータ由来のモデルが大陸規模で収束する AC-OPF 解を生み出し得ることを示しています。
明確にしておきますが、これらのモデルは運用中の送電網の完全な複製ではなく、市場予測や電力需給調整当局によるリアルタイムの運用意思決定を意図したものではありません。電気パラメータは標準的な工学文献から推定され、並列回路は網羅的に列挙するのではなく近似されており、需要はオープンデータから導出された公開プロキシを用いて配分されています。
目標は、オープンデータのみを使用して、個々の州から大規模な多地域システムに至るまで地理的構造とスケールを保持しつつ、構造的および電気的に現実的なモデルを作成することです。完全な方法論の詳細、検証結果、および限界については、補完的な研究論文で説明されています。
今日のエネルギー課題にとってなぜこれが重要なのか
解可能で地理的に根ざしたグリッドモデルへのアクセスは、大規模データセンター、AI ワークロード、再生可能エネルギー発電、そして極端な気象事象によって駆動されるエネルギーシステムの進化に伴い、ますます緊急性を増している問いに答える鍵となります。私たちは、当パイプラインから導出されたモデルに基づく具体的な分析を通じて、これらの能力を具体化します。
新しい送電線は物理的にどこに収まるのか?
グリッドに必要な新容量がどれほどかを問う前に、計画担当者はまず、さらに多くの電線を敷設することが物理的に可能かどうかを問わなければなりません。送電回廊には、収容できる回路数に物理的な限界があります:各回路は 3 本の導体(コンダクター)を必要とし、ほとんどの鉄塔構造は 1 から 3 の回路(3 から 9 本の導体)に対応しています。それを超えて容量を増やす場合、通常は完全に新しい通行権(ライツ・オブ・ウェイ)の取得が必要となり、これは費用がかかり、法的に複雑であり、都市部では政治的に実行不可能なケースも少なくありません。
当モデルは OpenStreetMap から得た実際の送電回廊の地理的構造を保持しているため、各経路に沿った並列回路数を数え、グリッドがすでに物理的に飽和している場所を可視化することができます。

 image図 1. 連続する米国本土(上部)全体において、モデルは 31,488 の異なる送電回廊を特定しました。圧倒的多数(27,506)が単一の回路(緑色)を運んでおり、並行線の設置が容易な状態です。オレンジから赤にかけての約 4,000 の回廊ではすでに 2 つ以上の並行回路が運用されており、最も密集した箇所では単一の経路に 10 の回路(30 本の導体)が詰め込まれています。カリフォルニア州(下部)にズームインすると、パターンはより明確になります。サクラメント以北の赤い回廊や、ベイエリアおよび LA ベース周辺にあるオレンジ色のクラスターは、すでに物理的に密集している送電網の場所を示しており、モハベ砂漠を横断してネバダ州へと伸びる長い緑色の放射状線には、まだ拡張の余地が残されています。
発電量や需要に関わらず、送電網が物理的に限界に達している場所を特定することは、最適化問題ではありません。これは地理的に根ざしたモデルだけが回答できる空間的な実現可能性に関する問いです。
必要な場所に容量を追加したらどうなるでしょうか?
密集した都市部では、従来の送電線の増設は現実的ではないことが多い。建物が密接に立ち並び、道路や複雑な地下インフラが存在するため、高圧線の通行権を確保する余地がほとんど残されていない。都市部の電力網拡張を支えるために、代替的な電力伝送ソリューションが検討されることもある。例えば、高温超伝導(HTS)ケーブルシステムは、同じ断面積に対して約1桁高い電流容量を提供し、より低い電圧で大量の電力を転送可能とし、許可手続きの簡素化も実現する。
短距離の点対点超伝導電力リンクはすでに米国各地で実証されている:オハイオ州コロンバス、ニューヨーク州アルバニー、ニューヨーク州ロングアイランド(廃止済み)、そしてシカゴ(稼働中)。
これらの接続がどのような成果をもたらすかを探索するため、マサチューセッツ州の送電網において2つの仮想的なHTSリンクをモデル化し、それぞれボストンの北西にある変電所と都市に近い負荷中心を結んだ。その後、交流最適潮流(AC-OPF)を再計算し、その結果を修正前のベースラインと比較した。

 image図 2. ベースライン(上)では、送電線 1 本が熱定格を超え(≥100%、濃い赤色)、さらに 2 本が 90% を超えて稼働しています。一方、2 つの高温超伝導(HTS: High-Temperature Superconducting)リンクを追加した下図(破線)では、ネットワーク内のすべての送電線の負荷率が 90% 未満に低下します。エネルギー価格は 42% 下落し、$22.7/MWh から $13.1/MWh となりました。これは、以前は制約された回廊の背後でボトルネックとなっていた発電量が、供給可能になったためです。
これはまさに、公開されている価格データからは得られない洞察の典型例です。卸電力価格は混雑の有無を反映しますが、システムが混雑にどの程度近づいているか、あるいは新たな資産が追加された際に潮流がどのように変化するかまでは示しません。定格熱容量の 95% で稼働している送電線と 50% のものは、市場データ上では同じように見えます——片方が容量限界に達するまでです。物理ベースモデルはこの余裕を直接明らかにし、建設前に介入効果を評価することを可能にします。
新たな需要はどこへ向けるべきか?
電力需要の急速な成長は、既存の市場シグナルでは不十分である問いを提起しています:ネットワーク上のどこに新たな消費を吸収させれば、混雑を引き起こさずに済むのか。
卸電力価格は、限界発電コスト、送電網における現在の混雑パターン、および通常は小さい送電損失を反映していますが、システムがその限界にどれだけ近づいているかという点は捉えられません。したがって、価格のみに基づいて立地判断を行うと、インフラの増強なしに新たな需要に対応できるかを決定する物理的な余裕を見逃すことになります。
これを説明するために、仮想的な 500MW のデータセンターをメリーランド州内の2つの異なる場所に配置し、それぞれに対して交流最適潮流計算(AC-OPF)を再実行しました(場所の選定は任意であり、マイクロソフトのデータセンターポートフォリオや拡張計画を反映するものではありません)。これら2つのサイトは、市場観点から見て妥当な代替案であり、人口密度が類似しており、電気料金が同等で、主要な負荷中心地に近いという共通点があります:
サイトA(ボルティモア地域):既存の発電複合体および密集した送電インフラに隣接する、ボルティモア大都市圏内の変電所
サイトB(ワシントンDC郊外):ワシントン–ボルティモア回廊内にある同様に人口密度の高い郊外地域を供給する、モンゴメリー郡の変電所
これらの類似点にもかかわらず、物理的な結果は異なります。データセンターをサイトAに追加すると、近隣の送電線が熱的過負荷状態に陥りますが、同じ負荷をサイトBに配置しても既存のネットワークによって吸収され、送電線の制限値を超えることはありません。2つのサイトの距離は50マイル未満ですが、一方では送電網の強化が必要となる一方で、他方では不要となります。
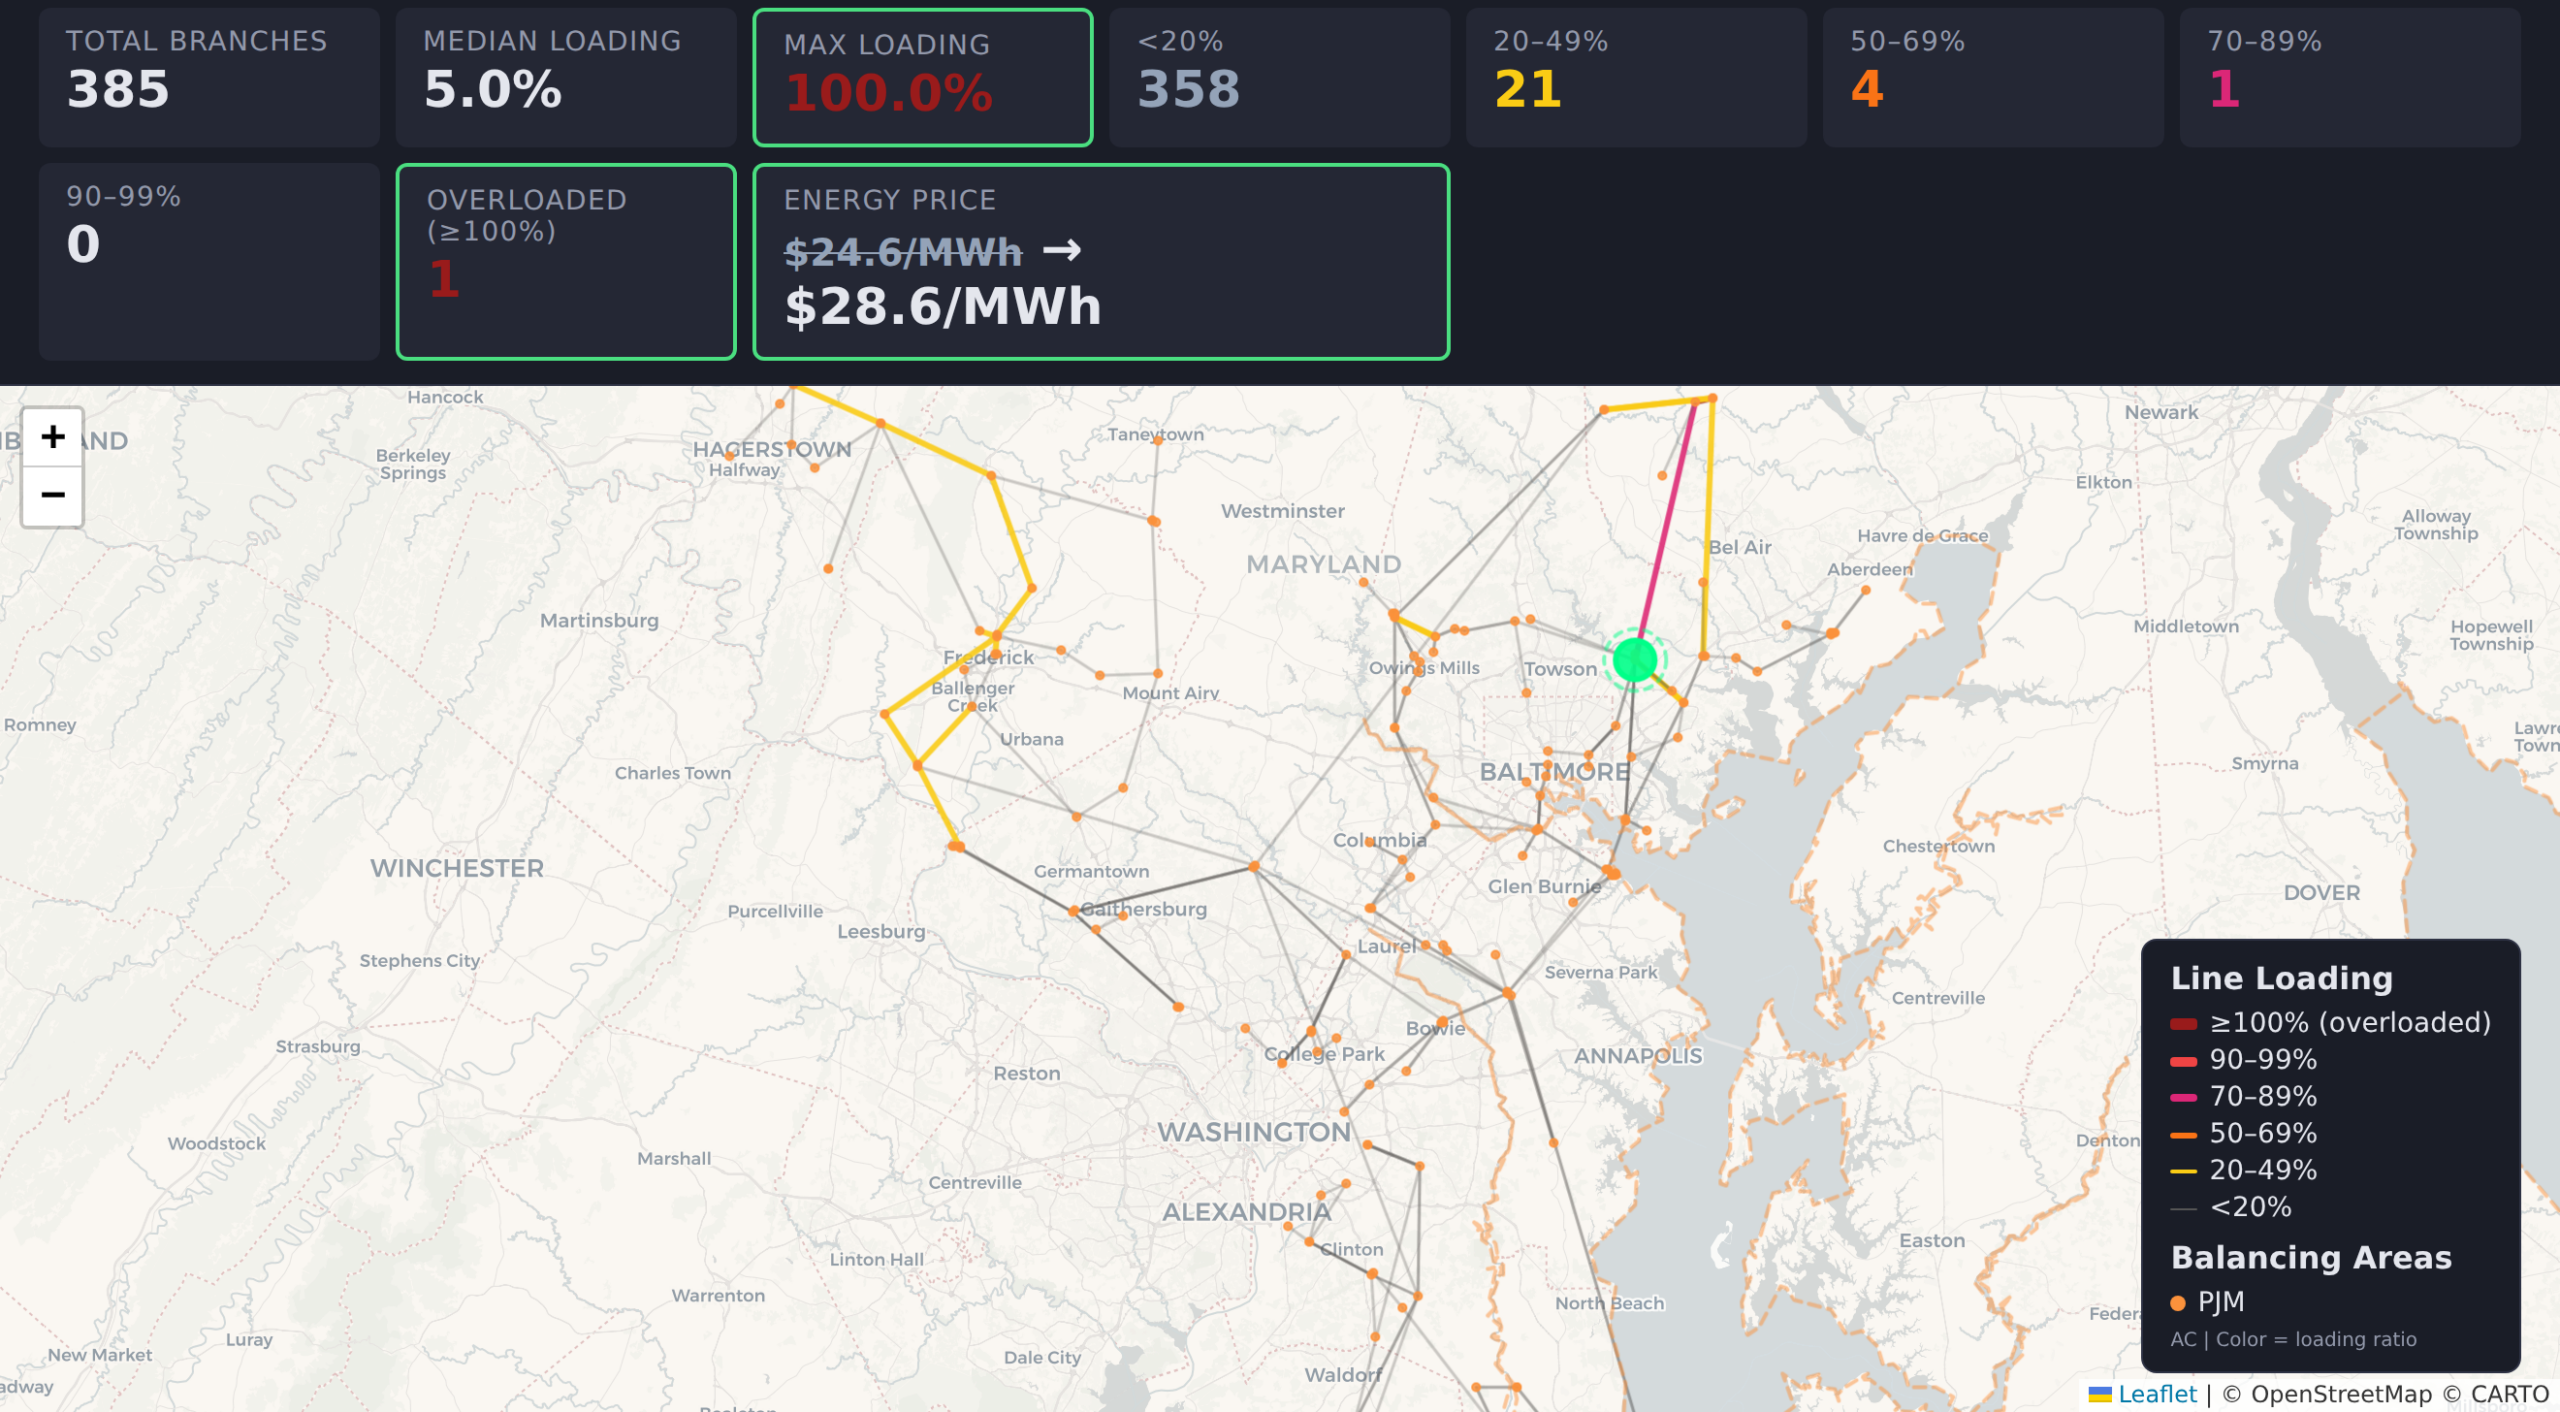
 image図 3. データセンターをボルチモア近郊に配置する(上段)と、送電線のいずれかが過負荷(≥100%)となり、エネルギー価格がベースラインの$24.6/MWhから$28.6/MWhへ上昇します(+16.1%)。一方、同じ需要を DC 郊外に配置した場合(下段)、すべての送電線は95%未満に保たれ、価格は$26.4/MWh(+7.4%)に上昇するのみです。ボルチモア地点の価格は MWh あたり$2.1高くなりますが、これは 500 MW の需要に対して時間あたり約$9,100、年間では約$80百万ドルの違いとなります。
この違いは価格データ上ではほとんど目に見えませんが、より直接的な第一原理に基づく送電レベルの電力潮流解析から直接導き出されます。これは、ストレスのかかるグリッドにおける需要立地決定には、地理的根拠に基づいた物理ベースモデルが必要であることを浮き彫りにしています。
今後の展望
本研究は、制限されたインフラストラクチャデータへのアクセスがなくても、現実的な規模で送電レベルのグリッド挙動を研究可能であることを示しています。モデルを実際の地理に根ざさせ、不確実性を明示的に扱うことで、オープンデータから導出されたグリッドは、小規模なベンチマークや純粋に合成されたネットワークでは困難または不可能である分析をサポートすることができます。
ここで紹介する例は米国に焦点を当てていますが、このアプローチは同等のオープンデータが利用可能な他の地域にも一般化可能です。より広く言えば、私たちはこの機能を、混雑・実現可能性・システムストレスの研究を改善するための基盤層と捉えています。これは、計画調査やシナリオ分析、あるいは現実的なグリッド構造を必要とするデータ駆動型手法など、あらゆる文脈で活用されるものです。
私たちは、48 の米国州および 6 つの多州間連系網にまたがるグリッドモデルのオープンデータを公開します。対象は数十本のバスからなる小規模システムから大陸規模のネットワークまで多岐にわたります。すべてのモデルは交流最適潮流(AC-OPF)の下で求解可能であり、必要に応じて制御された緩和を適用することで、オープンデータ入力における不確実性を考慮しています。これらのモデルはピーク需要時とオフピーク需要時の両方の条件下で求解されており、一連の運転シナリオにわたって一貫した分析を可能にします。
本記事は 2 部構成シリーズの第 1 弾です。第 2 弾では、これらのグリッドモデルを学習対象とした学習ベースの交流最適潮流(AC-OPF)代理モデル「GridSFM」を紹介します。私たちは、これが数ミリ秒で完全な交流運転点を予測し、計画規模での高速スクリーニングのために実現可能性を分類し、下流の数値ソルバーの加速のためのウォームスタート(warm-start)シードとして機能する方法を示します。
GitHub
Hugging Face
新しいタブで開きます。記事「Building realistic electric transmission grid dataset at scale: a pipeline from open dataset」は、Microsoft Research のウェブサイトに最初に掲載されました。
原文を表示
At a glance
We construct geographically grounded, electrically coherent power grid models entirely from publicly available data and release a dataset spanning 48 U.S. states and multi-state interconnections.
The models support AC optimal power flow (AC‑OPF) analysis, enabling physics-based study of congestion, capacity, and demand siting without restricted data.
We demonstrate applications including transmission expansion potential, targeted line upgrades, and placement of large datacenter loads.
Microsoft Research is excited to release an open dataset of approximate transmission topology of the U.S. power grid derived from publicly available data.
The ability to study transmission-level power grid behavior is essential for modern power systems research. Analyses of congestion, transmission expansion, demand growth, and system resilience all depend on network models with realistic topology, electrical parameters, and geographic grounding.
In most of the world, including the United States, realistic transmission-level grid data is classified as critical infrastructure information and subject to strict access controls. These restrictions exist for good reasons, but the resulting lack of realistic grid models is increasingly exacerbating the challenges power systems face. Decisions about where new load can be added – and how additional transmission assets can be deployed to support it – are often gated behind lengthy and opaque processes that can take years. For researchers developing new tools and algorithms, access typically requires long approval cycles, strict non-redistribution agreements, or costly commercial licenses.
As a result, many are left choosing between small “toy” networks with dozens of buses, or synthetic models that do not correspond to real infrastructure. This lack of realistic, shareable models is particularly limiting for data-driven and AI-based approaches, which require large volumes of physically plausible grid data for training and evaluation methods for grid analysis and planning.
Against this backdrop, a natural question arises:
Can we meaningfully understand how the U.S. power grid responds to modern stresses – and facilitate the development of actionable solutions for the system – using only open data?
In this work, we introduce an open-data-derived pipeline for constructing large-scale, transmission-level power grid models that realistically approximate existing networks without relying on proprietary or restricted datasets. We provide an open dataset derived from this process, consisting of transmission-level models spanning 48 U.S. states as well as interconnection-scale networks, ranging in size from small systems with as few as 11 buses to the full Eastern Interconnection grid connecting 21,697 buses. The pipeline has been validated across the continental United States, where sufficient open geographic, energy, and demographic data are available, and is designed to generalize to other regions with comparable public data sources.
Using only publicly accessible datasets, the pipeline produces geographically grounded, electrically coherent transmission models at state, multi-state, and interconnection scales. These models preserve the geographic structure of transmission corridors, substations, and generators inferred from open data, while explicitly accounting for uncertainty where detailed operational parameters are unavailable through transparent feasibility reporting.
Importantly, these are not toy networks or abstract benchmarks. The resulting models support alternating current optimal power flow (AC-OPF) analysis across a wide range of scales, enabling physics-based investigation of questions such as where transmission capacity is physically constrained; where new demand can be absorbed; and how infrastructure changes propagate through realistic network layouts – using only open data.
In this post, we describe the approach at a high level and highlight the system level questions it enables.
How the pipeline works
The pipeline turns publicly available geographic and energy data into transmission-level grid models that are geographically grounded and usable for power flow analysis.
The starting point is OpenStreetMap (opens in new tab), which encodes the physical layout of transmission corridors, substations, and power plants. This geographic skeleton is then augmented with open datasets describing generation capacity, fuel mix, demand, and operational boundaries (including U.S. EIA energy statistics and U.S. Census data), allowing the models to go beyond topology and represent how electricity is produced and consumed.
The key test is solvability. In power system analysis, solving optimal power flow (OPF) problems is a practical check on whether a network description is electrically coherent and practically relevant. OPF determines how generation can be dispatched to meet demand while respecting physical constraints such as transmission line capacities, voltage limits, and generator capabilities. Many inferred or synthetic networks fail this test outright: the topology may appear roughly correct, but other important engineering parameters are not.
Crucially, this approach moves beyond small benchmark or “toy” networks. In particular, we solve AC-OPF across the entire Eastern Interconnection, spanning 36 states and more than 20,000 buses, derived exclusively from public data sources. This demonstrates that open-data-derived models can produce convergent AC-OPF solutions at a continental scale.
To be clear, these models are not exact replicas of the operational grid, nor are they intended for market forecasting or real-time operational decision making by power balancing authorities. Electrical parameters are estimated from standard engineering references, parallel circuits are approximated rather than exhaustively enumerated, and demand is allocated using public proxies derived from open data.
The goal is to produce structurally and electrically realistic models that preserve geographic structure and scale from individual states to large multi-region systems using only open data. Full methodological details, validation results, and limitations are described in a companion research paper.
Why this matters for today’s energy challenges
Access to solvable, geographically grounded grid models unlocks questions that have become increasingly urgent as the energy system evolves, driven by large-scale datacenters, AI workloads, renewable generation, and extreme weather events. We illustrate these capabilities with concrete analyses on models derived from our pipeline.
Where can new transmission physically fit?
Before asking how much new capacity the grid needs, planners must first ask where more wires are even possible. Transmission corridors have a physical limit on how many circuits they can carry: each circuit requires three conductors, and most tower structures accommodate one to three circuits (three to nine conductors). Beyond that, adding capacity typically requires acquiring entirely new rights-of-way – which is expensive, legally complex, and often politically infeasible in urban areas.
Because our models preserve the geographic structure of real transmission corridors from OpenStreetMap, we can count the number of parallel circuits along each path and visualize where the grid is already physically saturated.
imageFigure 1. Across the contiguous United States (top), the model identifies 31,488 distinct transmission corridors. The overwhelming majority (27,506) carry a single circuit (green), making parallel lines easier. The roughly 4,000 corridors in orange through red already carry two or more parallel circuits, with the densest packing ten circuits (30 conductors) onto a single path. Zooming into California (bottom), the pattern becomes more discernable. The red corridor north of Sacramento and the orange clusters around the Bay Area and LA basin show where the grid is already physically dense, while the long green radials across the Mojave and into Nevada still have room to grow.
Identifying where the grid is physically boxed in, regardless of generation or demand, is not an optimization problem. It is a spatial feasibility question that geographically grounded models are uniquely positioned to answer.
What if we add capacity where it is needed most?
In dense urban areas, adding new traditional transmission lines is often impractical. The combination of tightly packed buildings, roadways, and complex underground infrastructure leaves little room to establish rights-of-way for high-voltage lines. Alternative power‑transmission solutions are sometimes explored to support urban grid expansion. For example, high-temperature superconducting (HTS) cable systems offer an order-of-magnitude higher ampacity for a given cross-section, enabling the transfer of large amounts of power at lower voltages and simplifying permitting requirements.
Short point-to-point superconducting power links have already been demonstrated in U.S. cities: Columbus, Ohio, Albany, New York, Long Island, New York (decommissioned), and Chicago (operational).
To explore what such connections might accomplish, we modeled two hypothetical HTS links in the Massachusetts grid, each connecting a substation northwest of Boston to load centers closer to the city. We then re-solved AC-OPF and compared the results to the unmodified baseline.
imageFigure 2. In the baseline (top), one transmission line exceeds its thermal rating (≥100%, dark red) and two more operate above 90%. After adding two HTS links (bottom, dashed lines), every line in the network drops below 90% loading. The energy price falls 42%, from $22.7/MWh to $13.1/MWh, as generation that was previously bottlenecked behind constrained corridors becomes deliverable.
This is precisely the kind of insight that publicly available price data cannot provide. Wholesale electricity prices reflect whether congestion exists, but not how close the system is to congestion nor how power flows change when new assets are added. A line operating at 95% of its thermal limit and one at 50% look identical in market data – until one of them reaches capacity. Physics-based models expose that margin directly, making it possible to evaluate interventions before they are built.
Where should new demand go?
Rapid growth in electricity demand raises a question that existing market signals answer poorly: where on the network can new consumption be absorbed without triggering congestion?
Wholesale electricity prices reflect marginal generation costs, current congestion patterns in the transmission grid, and transmission losses, which are typically small – but they do not capture how close the system is to its limits. Siting decisions based solely on price therefore miss the physical margin that determines whether new demand can be served without infrastructure upgrades.
To illustrate this, we placed the same hypothetical 500 MW datacenter at two locations in the Maryland grid and re-solved AC-OPF for each (locations were chosen arbitrarily and do not reflect Microsoft’s datacenter portfolio or expansion plans). The two sites are plausible alternatives from a market perspective, with similar population density, comparable electricity prices, and proximity to major load centers:
Site A (Baltimore area): a substation in the Baltimore metropolitan region, near an existing generation complex and dense transmission infrastructure
Site B (Washington, DC suburbs): a substation in Montgomery County, serving a similarly dense suburban area within the Washington–Baltimore corridor
Despite these similarities, the physical outcomes differ. Adding the datacenter at Site A pushes a nearby transmission line into thermal overload, while placing the same load at Site B is absorbed by the existing network without violating line limits. The two sites are less than 50 miles apart, yet one would require transmission reinforcement and the other would not.
imageFigure 3. Placing the datacenter near Baltimore (top) pushes one transmission line into overload (≥100%) and raises the energy price from $24.6/MWh (baseline) to $28.6/MWh (+16.1%). The same load placed near the DC suburbs (bottom) keeps all lines below 95% and raises the price to $26.4/MWh (+7.4%). The Baltimore site yields a price $2.1/MWh higher – a difference that, across the 500 MW load, amounts to roughly $9,100 per hour or ~$80 million per year.
This distinction – largely invisible in price data – emerges directly from a more direct first-principle transmission-level power flow analysis. It highlights why geographically grounded, physics-based models are necessary for demand-siting decisions in a stressed grid.
Looking ahead
This work shows that it is possible to study transmission-level grid behavior at realistic scales without access to restricted infrastructure data. By grounding models in real geography and making uncertainty explicit, open-data-derived grids can support analyses that are difficult or impossible with small benchmarks or purely synthetic networks.
While the examples here focus on the United States, the approach generalizes to other regions where comparable open data is available. More broadly, we see this capability as an enabling layer: a way to improve the study of congestion, feasibility, and system stress – whether for planning studies, scenario analysis, or data-driven methods that require realistic grid structure.
We are releasing an open dataset of grid models spanning 48 U.S. states and six multi-state interconnections, ranging from small systems with tens of buses to continental-scale networks. All models can be solved under AC-OPF, with controlled relaxations applied when necessary to account for uncertainty in open data inputs. These models are solved for both peak and off-peak demand conditions, enabling consistent analysis across a range of operating scenarios.
This post is the first in a two-part series. In the second post, we introduce GridSFM, a learning-based AC-OPF surrogate trained on these grid models. We show how it predicts a full AC operating point in milliseconds, classifies feasibility for fast screening at planning scale, and serves as a warm-start seed that accelerates downstream numerical solvers.
GitHub
Hugging Face
Opens in a new tabThe post Building realistic electric transmission grid dataset at scale: a pipeline from open dataset appeared first on Microsoft Research.
関連記事
今日のまとめ
AI日報で今日の重要ニュースをまとめ読み