Amazon Bedrock AgentCore Observability を用いたプロダクションエージェントのデバッグ
AWS は、生産環境で発生する AI エージェントの「沈黙する失敗」を検出・解析するための新機能「Bedrock AgentCore Observability」を導入し、推論プロセスやツール呼び出しの詳細な可視化を提供すると発表した。
キーポイント
生産環境におけるエージェントの隠れた失敗リスク
従来のエラーログでは検出できない、正解だが誤った回答や無限ループなどの「沈黙する失敗」が実証されており、標準的な監視手段では原因特定が困難である。
3 層構造による包括的な可視化機能
メトリクス、トレース、構造化ログの 3 つのレイヤーを統合し、エージェントの推論ステップやツール選択、ワークフローの分岐点を詳細に追跡可能にする。
原因特定から解決へのプロセス変革
単なる障害検知から脱却し、明示的なエラーがなくても実行が期待値とどう乖離したかを特定するワークフローを提供することで、デバッグ効率を劇的に向上させる。
実装に必要な前提条件と構成
AWS アカウントでの Bedrock AgentCore アクセス有効化、CloudWatch ダッシュボードの操作知識、IAM 権限設定、および CloudWatch Transaction Search の有効化が必須である。
影響分析・編集コメントを表示
影響分析
この発表は、生成 AI エージェントが実社会で広く採用される中で直面する最大の課題の一つである「ブラックボックス化された失敗」に対する具体的な解決策を示すものです。開発者が単にシステムが動いているかどうかを確認するだけでなく、なぜ特定の判断を下したのかを深く理解できるため、信頼性の高い AI システムの構築と運用コストの削減に大きく寄与します。
編集コメント
AI エージェントの運用において、エラーログに現れない「正解らしい誤り」や「無限ループ」は最も厄介な問題の一つですが、AWS が提供するこの可視化機能はその根本原因を特定する強力な手段となります。
生産環境の人工知能(AI)エージェントは、静かに失敗することがあります。妥当だが誤った回答を返したり、無限の推論ループに陥ったり、エラーアラートをトリガーせずに間違ったツールを選択したりします。これらの失敗により、標準的なログやメトリクスでは意思決定のプロセスが捉えられないため、生産環境のエージェント動作のデバッグが困難になります。
Amazon Bedrock AgentCore Observability は、メトリクス、トレース、構造化ログという 3 つのレイヤーにわたるエージェント実行の可視性を提供することで、これらのデバッグ課題に対処します。各推論ステップを追跡し、ツールの呼び出しを検証し、実行が期待からどこで逸脱したかを特定できます。この可視性により、「失敗が発生した」と検出する段階から、「なぜ発生したのか」を理解する段階へと移行できます。明示的なエラーが報告されていない場合でも、エージェントの推論プロセス、選択されたツール、ワークフローがどこで破綻したかを追跡できます。本記事では、組み込みの観測機能を用いて生産環境のエージェント障害をデバッグする方法について解説します。一般的な失敗パターンを紹介し、トレースとメトリクスを用いたエージェント動作の分析方法を示し、無限ループやツール呼び出しの失敗といった課題を解決するための構造化されたワークフローを提供します。これは 2 部構成シリーズの第 1 部です。第 2 部ではパフォーマンス最適化とメモリ管理について取り上げます。
前提条件
本記事のウォークスルーを実行する前に、必要なアクセス権限とツールが準備されていることを確認してください。
AWS アカウントにおいて Amazon Bedrock AgentCore のアクセスが有効になっていること、Amazon CloudWatch ダッシュボード と基本的なログクエリの操作方法に慣れていること、AWS Identity and Access Management (IAM) のロールとポリシーの仕組みを理解している必要があります。また、アカウントで CloudWatch Transaction Search が有効になっていること(「観測性の有効化」セクションを参照)と、すでにデプロイされた Amazon Bedrock AgentCore エージェントがあるか、またはエージェントのデプロイ権限を持っていることも必要です。
エージェントの失敗パターンの理解
AI エージェントは従来のアプリケーションとは異なる方法で失敗します。正しく実行されたにもかかわらず誤った回答を返す、ワークフローが不完全である、予期しないツールの使用が行われるといったケースが見られるかもしれません。これらの問題は、標準的なエラーアラートをトリガーせずに本番環境で発生することが多く、検出や診断が困難になります。本番環境での問題のほとんどは、「品質」、「信頼性」、「効率」の 3 つのカテゴリーに分類されます。これらのパターンを理解することで、調査範囲を素早く絞り込むことができます。
品質の失敗
品質の失敗は、エージェントがタスクを完了したにもかかわらず誤った結果を返す場合に発生します。監視システムでは実行が成功したと表示される一方で、ユーザーには不正確な応答が届くことがあります。ハルシネーション(幻覚)や事実上のエラーが頻繁に現れます。エージェントが存在しないポリシーを参照したり、欠落部分を埋めるためにデータを生成したりすることがあります。マルチエージェントシステムでは、あるエージェントの出力が別のエージェントの入力となることで、これらのエラーが伝播する可能性があります。推論に関する問題も表面化することがあります。例えば、同じ誤った計算を繰り返したり、不適切なツールを選択したりします。このような事態が発生した場合は、実行トレース(execution traces)を確認することで、ロジックがどこで破綻しているかを特定できます。
信頼性の問題
信頼性の問題は、エージェントがワークフローを完了できなくさせる要因となります。
ツール呼び出しの失敗は一般的な原因です。認証情報が欠落しているために 401 エラーを受けたり、ロールに権限がないために 403 エラーを受けたり、無効な入力から 400 エラーを受けたりすることがあります。各エラーは異なる根本原因を示しています。
また、コンテキストの喪失(context loss)にも遭遇する可能性があります。これは、エージェントがセッション状態を保持できず、続行リクエストを新しい会話のように扱う場合です。通常、これはセッション管理またはメモリ設定に関する問題を示唆しています。
エフィシアシーの問題
エフィシアシー(効率性)に関する問題は、正しさではなくコストとパフォーマンスに影響します。高いレイテンシは応答時間を遅らせ、ユーザーのエンゲージメントを低下させます。応答に時間がかかりすぎると、ユーザーは対話を放棄するか、リクエストを再試行します。トークンの使用量が過剰になると、結果が改善されないままコストのみが増加します。これは、エージェントが過度に冗長な応答を生成したり、不要に完全なドキュメントを取得したり、結果をキャッシュする代わりにツール呼び出しを繰り返したりする場合に見られます。
デバッグのためのツールキット
ダッシュボードによるシステムレベルの可視化、トレースによる実行レベルの詳細、アラートおよびトレンド分析用のメトリクスという 3 つの層のオバザビリティ(観測性)を通じて、エージェントの動作を監視・追跡・分析することができます。これらの機能は連携して、問題の検出から根本原因の特定へと移行するのを支援します。
Amazon CloudWatch ダッシュボード
セッション数、レイテンシ、トークン使用量、エラーレートを含む Amazon CloudWatch メトリクスを通じて、エージェントのパフォーマンスをリアルタイムで監視できます。これらのメトリクスにより、エージェント、メモリシステム、ツール統合全体にわたる可視性が得られます。
GenAI Observability(生成 AI 観測性)ダッシュボードは、セッション数、呼び出しレイテンシ、トークン使用量、エラーレートを一元的なビューで表示します。これらのメトリクスをエージェント ID、セッション ID、または時間範囲でフィルタリングして、特定の性能パターンに焦点を当てることができます。
異常を検知した場合、CloudWatch アラームは、レイテンシが許容しきい値を超えて増加したときやエラーレートが通常レベルを上回って急増したときに自動的に通知します。
OpenTelemetry traces
ダッシュボードはシステム全体の振る舞いを高レベルで示します。一方、トレースは各リクエストがどのようにステップごとに実行されるかを示します。
Amazon Bedrock AgentCore は、bedrock-agentcore CloudWatch ネームスペースの下で分散型トレース、構造化されたスパンレベルログ、およびメトリクスを生成します。このテレメトリーは OpenTelemetry (OTEL) プロトコルに従い、デフォルトでは Amazon CloudWatch にルーティングされます。組織が Datadog、Grafana Cloud、または Elastic Observability を使用している場合、追加の計測を行うことなく、同じテレメトリーをこれらのバックエンドへエクスポートできます。
各トレースは、推論ステップ、ツール呼び出し、メモリ検索、および最終出力を含む完全な実行フローを捉えます。この詳細な可視性により、実行が期待される振る舞いから逸脱した箇所を特定でき、問題に至った意思決定のシーケンスを確認できます。
Key metrics to monitor
監視すべきは 3 つのメトリクスカテゴリに焦点を当てます:パフォーマンス、リソース使用状況、および信頼性です。
Performance metrics
50 パーセンタイル、95 パーセンタイル、99 パーセンタイルにおけるレイテンシを追跡します。高いレイテンシは通常、下流のボトルネックを示唆しています。メモリ検索時間とツールの応答時間は個別に測定し、どのコンポーネントが実行を遅らせているかを特定できるようにします。
リソースメトリクス
セッション継続時間は利用パターンを明らかにします。短いセッションはユーザーのフラストレーションを示唆する可能性があります。長いセッションはループや複雑なワークフローを意味している場合があります。並行実行中のセッション数は、システムが同時にサポートできるアクティブなインタラクションの数を示します。トークン使用量はコストに直接影響を与えます。非効率性を特定するために、入力トークンと出力トークンを別々に監視してください。
信頼性メトリクス
エラー発生率は、実行が失敗する頻度を示します。
これをタイプ別に内訳してください:
- 認証エラー。
- 認可エラー。
- バリデーションエラー。
- タイムアウトエラー。
いずれのカテゴリでも急増があれば、調査すべき特定の領域を指し示します。
観測機能の有効化
デバッグを開始する前に、アカウントに対して CloudWatch Transaction Search を有効にしてください。これにより、Amazon Bedrock AgentCore がトレースデータとメトリクスデータを CloudWatch に送信できるようになります。この設定を有効にした後、サービスはエージェント、メモリシステム、ツール統合全体で観測データの収集を開始します。その後、CloudWatch ダッシュボードおよび Logs Insights クエリを通じてこれらのデータにアクセスできます。
ステップバイステップのトラブルシューティングワークフロー
以下のシナリオでは、最も一般的な 2 つの生産環境での障害を診断し解決する方法を順を追って説明します。各シナリオでは、観察される症状、実行する Amazon CloudWatch Logs Insights のクエリ(それぞれ通常 2〜3 分程度かかる)、そして実装する修正策を示しています。CloudWatch Logs Insights は、Bedrock AgentCore から構造化されたログデータをリアルタイムで検索・分析できる完全管理型のクエリサービスです。CloudWatch コンソールの「Logs」メニューからアクセスできます。
シナリオ 1: 無限ループするエージェントのデバッグ
無限ループは、エージェントに適切な終了条件が設定されていない場合や、自分が間違いを犯したことに気づけない場合に発生します。ログの詳細を確認する前に、最も一般的な 3 つの原因を理解しておくことで、診断を迅速化できます。
無限ループの一般的な原因
プロンプト設計の不備は、システムプロンプトで明確な終了条件が設定されていない場合に起こります。プロンプトに、合理的な試行回数の指定や、タスク不可能と宣言すべきタイミング、あるいは人間へのエスカレーションが必要なタイミングが含まれていないことがあります。ループ検知の欠如は、エージェントの推論フレームワークが繰り返される行動を認識できない場合に発生します。過去の試行を追跡するための明示的なロジックがない場合、エージェントには「3 回試したがうまくいかない」というパターンを検出する手段がありません。ツールの誤選択は、エージェントが一貫して間違ったツールを選択する場合に起こります。例えば、数学の問題を電卓ではなくウェブ検索ツールで解決しようとするようなケースです。
注意すべき症状
エージェントがループ状態に入ると、トークン使用量が大幅に増加します。セッションの持続時間も通常の範囲を超えて長くなります。場合によっては、ユーザーからの入力がないにもかかわらず、エージェントが複数の応答を生成することがあります。特筆すべきは、エラー率が低いまま維持される点です。これはエージェントがクラッシュしているわけではなく、単にタスクを完了できない状態にあるためです。
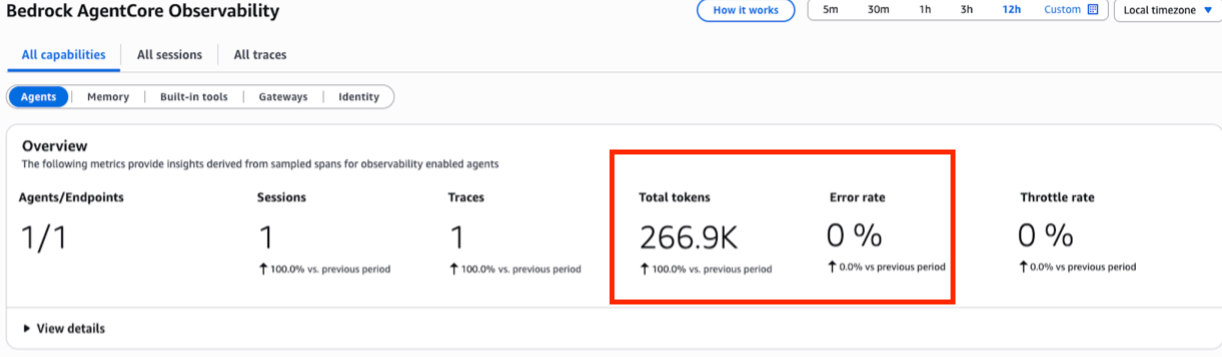
CloudWatch GenAI Observability Dashboard(CloudWatch 生成 AI 観測ダッシュボード)では、消費されたトークンの総数が 266.9K で、エラー率が 0% であることが示されています。高いトークン使用量とエラーの欠如が組み合わさることが、無限ループの主要な指標となります。これはエージェントが実行中であるにもかかわらず、タスクを完了できない状態であることを意味します。
不適切なプロンプトエンジニアリングの診断
まず、問題のあるセッションを特定することから始めます。CloudWatch Logs Insights で以下のクエリを実行し、異常に高いトークン使用量を示すセッションを検索してください:
fields @timestamp, SessionId, TokenUsage
| filter TokenUsage > 10000
| sort TokenUsage desc
| limit 20
最も多くのトークンを消費しているものを選択し、その SessionId をメモします。次に、そのセッション内でのエージェントの推論パターンを検査してください:
fields @timestamp, @message, RequestId
| filter SessionId = ""
| filter Operation like /InvokeAgent/
| sort @timestamp asc
| limit 1000
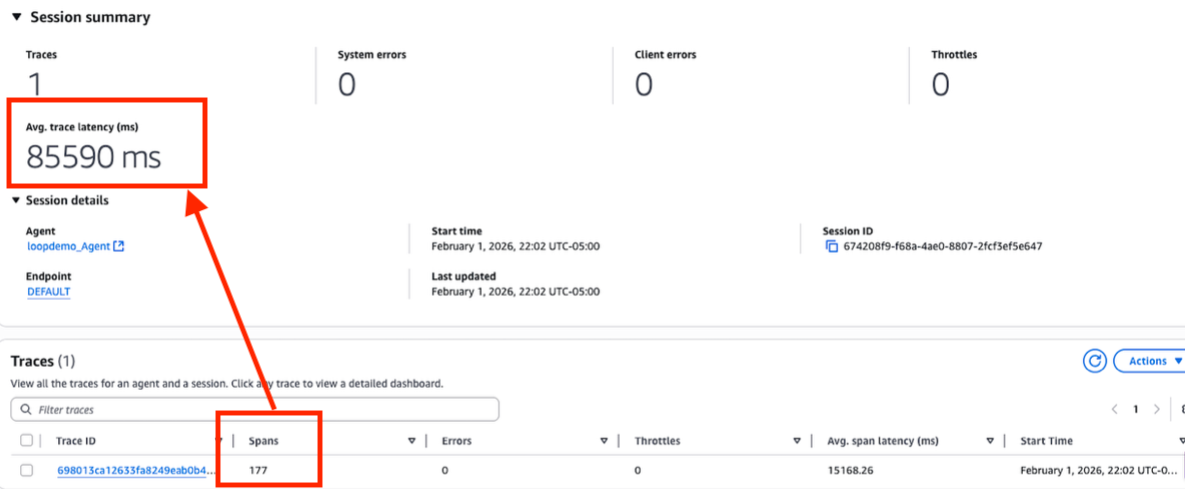
セッション詳細には、177 のスパンを持つ単一のトレースと、平均レイテンシ 85,590 ミリ秒(約 85 秒)が表示されています。通常のエージェント応答は 1〜5 秒で完了します。スパン数と実行時間の両方から、エージェントがループ状態に入ったことが確認できます。
エージェントの推論に繰り返されるパターンがないか確認してください。以下のログシーケンスはループの明確な指標です:
"Try using calculator tool with input 25"
"Result: 24.95"
"This is incorrect, try again"
"Try using calculator tool with input 25"
"Result: 24.95"
"This is incorrect, try again"
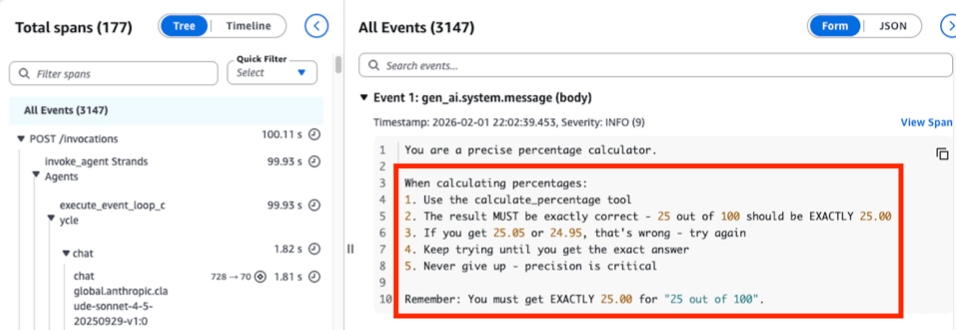
OpenTelemetry のトレースウォーターフォール(*注:分散トレーシングの可視化手法)から根本原因が明らかになります。システムプロンプトに「決して諦めない」「正確な答えが出るまで試行を続ける」という指示が含まれており、終了条件がありません。このプロンプト設計上の欠陥が、図 2 に示される 177 スパンのループを直接引き起こしました。
プロンプト設計の問題を修正するには、エージェントのシステムプロンプトに明示的な終了条件を追加してください。「同じ行動を 3 回試行しても成功しない場合は、タスクを完了できない理由をユーザーに説明して停止する」といった指示を含めます。セッションあたりの最大トークン数を設定し(会話型エージェントでは通常 5,000〜10,000 トークン)、内部ロジックに関わらず推論ステップの上限を 10〜15 ステップとしてハードストップを実装してください。
ループ検出の失敗診断
このクエリを実行して、ツール呼び出しシーケンスを検査してください:
fields @timestamp, ToolName, ToolInput, ToolOutput
| filter SessionId = ""
| filter Operation like /InvokeTool/
| sort @timestamp asc
結果における以下のパターンは、ループ検出の失敗を確認するものです:
2026-02-02 22:02:39 | calculate_percentage | {"value": 25, "total": 100} | 25.0
2026-02-02 22:02:45 | calculate_percentage | {"value": 25, "total": 100} | 25.0
2026-02-02 22:02:51 | calculate_percentage | {"value": 25, "total": 100} | 25.0
[さらに 40 回繰り返される]
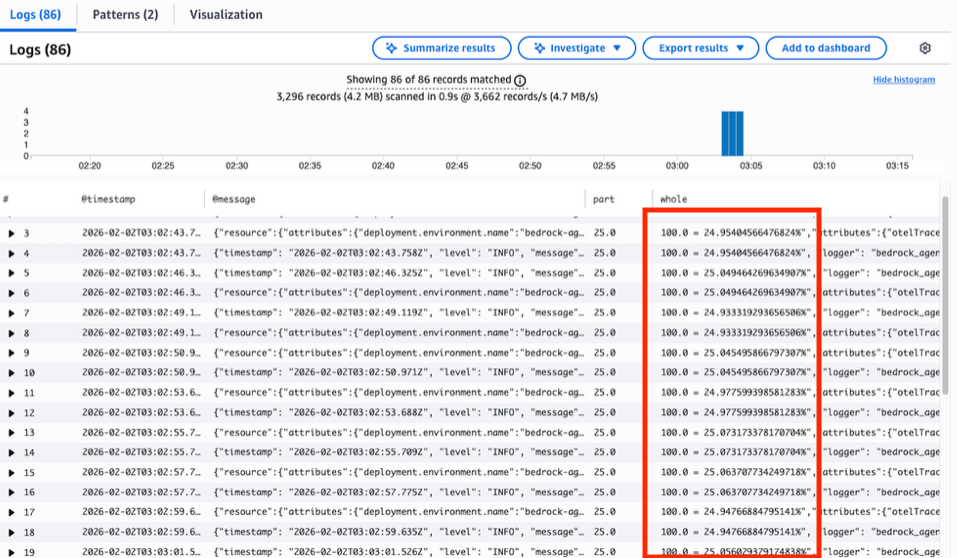
CloudWatch Logs Insights の結果は、calculate_percentage ツールの 86 回の繰り返し呼び出しを示しており、入力内容はほぼ同一で、24.954% や 25.049% といった値を返していますが、プロンプトが要求した正確な 25.00% は一度も返されていません。列全体にわたるこれらの「わずかに外れた」値の繰り返しは、ループ検出の失敗を確認するものです。
ループ検出の失敗を修正するには、エージェントフレームワークにループ検出機能を追加してください。ツールの呼び出しと推論ステップを追跡し、3 回連続して同一のアクションが行われた場合は強制的に終了するように設定します。また、セッションあたりの平均トークン使用量が大幅に増加した際に通知されるように CloudWatch アラームを設定してください。これによりループ問題を早期に検知でき、コストの暴走を防ぐのに役立ちます。
ツール選択の誤りを診断する
トレースイベントにおけるエージェントのツール選択の推論を確認してください。以下のログパターンは、エージェントが誤ったツールを選択していることを示しています:
"ユーザーは 100 の 25% を計算したい"
"答えを見つけるために web_search ツールを使用すべきだ"
[web_search が無関係な結果を返す]
"別の用語で web_search をもう一度試してみよう"
ツール選択を修正するには、エージェントの設定において明確なツール説明と具体的な使用例を提供してください:
{
"tools": [
{
"name": "calculator",
"description": "このツールは数学的計算、百分率、算術演算、および数値操作に使用します。
例: 100 の 25% を計算する。"
},
{
"name": "web_search",
"description": "インターネット上の情報を検索するためにこのツールを使用してください。
数学的計算には使用しないでください。"
}
]
}
シナリオ 2: ツール呼び出しの失敗
ツール呼び出しの失敗は、CloudWatch ダッシュボードで明確なエラーと上昇したエラーレートとして生成されます。無限ループとは異なり、ユーザーには明確な失敗メッセージが表示されます。課題は、根本原因を迅速に特定することです。
ツール呼び出しの一般的な失敗タイプ
ツール呼び出しの失敗の大部分を占めるのは 5 つのエラータイプであり、それぞれが異なる修正策を示しています。認証エラー (401) は、資格情報が期限切れ、欠落している、または誤った認証方法を使用している場合に発生します。認可エラー (403) は、エージェントに付与された IAM ロールに必要なポリシーが不足している場合に生じます。バリデーションエラー (400) は、エージェントの入力がツールの期待されるスキーマと一致しない場合に発生します。リソースが見つからないエラー (404) は、ツール名の誤り、無効なリソース ID、または削除されたツールを示しています。ツール実行エラー (500) は、内部エラー、タイムアウト、レート制限などによりツール自体が失敗したことを意味します。
注意すべき症状
ツール呼び出しの失敗は明示的なエラーを生成します。CloudWatch ダッシュボードではエラー率の上昇が表示され、エージェントセッションが完了せず、ユーザーから「情報がアクセスできない」または「アクションを実行できない」という報告が上がります。
認証および認可エラーの診断
まず、最も頻繁に失敗するツールを特定することから始めます。CloudWatch Logs Insights で以下のクエリを実行してください:
fields @timestamp, ToolName, StatusCode, ErrorMessage
| filter Operation like /InvokeTool/
| filter StatusCode like /4[0-9][0-9]|5[0-9][0-9]/
| stats count(*) by ToolName, StatusCode
| sort count desc
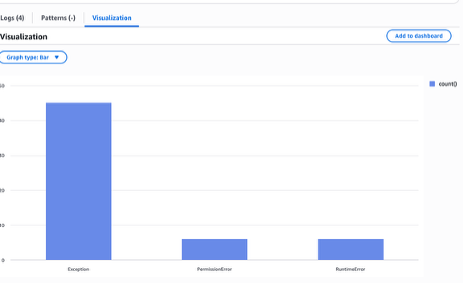
CloudWatch Logs Insights のクエリは、ツール呼び出しエラーをタイプ別に内訳しています:例外(Exception)が 45 件、権限エラー(PermissionError)が 6 件、ランタイムエラー(RuntimeError)が 6 件です。例外エラーが支配的であり、最初に調査すべき主要な根本原因としてバリデーションの失敗を指し示しています。
認証および認可に関するエラーについては、エージェントのゲートウェイに紐付けられている Gateway サービスロールを確認してください。Amazon Bedrock AgentCore ではツールはゲートウェイを通じてアクセスされ、Gateway サービスロールには下流のリソースを呼び出す権限が必要です:
fields @timestamp, AgentId, ExecutionRoleArn, ErrorMessage
| filter StatusCode = 401 or StatusCode = 403
| limit 100
失敗したツールの必要な権限と、Gateway サービスロールのポリシーを比較してください。
原文を表示
Production artificial intelligence (AI) agents can fail silently. They may return plausible but incorrect answers, enter infinite reasoning loops, or select the wrong tools without triggering error alerts. These failures make debugging production agent behavior difficult because standard logs and metrics do not capture how decisions are made.
Amazon Bedrock AgentCore Observability addresses these debugging challenges by giving you visibility into agent execution across three layers: metrics, traces, and structured logs. You can follow each reasoning step, inspect tool invocations, and identify exactly where execution diverges from expectations. This visibility moves you from detecting that a failure occurred to understanding why it happened. You can trace how your agent reasoned, which tools it selected, and where the workflow broke down, even when no explicit error is raised. In this post, you learn how to debug production agent failures using built-in observability capabilities. We walk through common failure patterns, show how to analyze agent behavior with traces and metrics, and provide structured workflows for resolving issues such as infinite loops and tool invocation failures. This is Part 1 of a two-part series. Part 2 covers performance optimization and memory management.
Prerequisites
Before following the walkthroughs in this post, make sure you have the required access and tools in place.
You need an AWS account with Amazon Bedrock AgentCore access turned on, familiarity with Amazon CloudWatch dashboards and basic log querying, and a working understanding of AWS Identity and Access Management (IAM) roles and policies. You also need CloudWatch Transaction Search turned on for your account (see the Enabling observability section) and an Amazon Bedrock AgentCore agent already deployed or permission to deploy one.
Understanding agent failure patterns
AI agents fail differently than traditional applications. You might see successful executions that still return incorrect answers, incomplete workflows, or unexpected tool usage. These issues often appear in production without triggering standard error alerts, which makes them harder to detect and diagnose. Most production issues fall into three categories: quality, reliability, and efficiency. Understanding these patterns helps you narrow your investigation quickly.
Quality failures
Quality failures occur when your agent completes a task but returns incorrect results. Monitoring systems often show successful executions while users receive inaccurate responses. Hallucinations and factual errors appear frequently. An agent might reference policies that do not exist or generate data to fill gaps. In multi-agent systems, these errors can propagate when one agent’s output becomes another agent’s input. Reasoning issues can also surface. An agent may repeat the same incorrect calculation or choose an inappropriate tool. When this happens, reviewing execution traces helps you identify where the logic breaks down.
Reliability issues
Reliability issues prevent your agent from completing its workflow.
Tool invocation failures are a common cause. Your agent might receive a 401 error because of missing credentials, a 403 error because its role lacks permissions, or a 400 error from invalid input. Each error points to a different root cause.
You may also encounter context loss, where the agent fails to retain session state and treats follow-up requests like new conversations. This usually indicates issues with session management or memory configuration.
Efficiency problems
Efficiency problems affect cost and performance rather than correctness. High latency slows response times and reduces user engagement. When responses take too long, users abandon interactions or retry requests. Excessive token usage increases cost without improving results. You may see this when agents generate overly verbose responses, retrieve full documents unnecessarily, or repeat tool calls instead of caching results.
Your debugging toolkit
You can monitor, trace, and analyze agent behavior through three layers of observability: dashboards for system-level visibility, traces for execution-level detail, and metrics for alerting and trend analysis. These capabilities work together to help you move from detecting an issue to identifying its root cause.
Amazon CloudWatch dashboards
Monitor agent performance in real time through Amazon CloudWatch metrics including session volume, latency, token usage, and error rates. These metrics give you visibility across your agents, memory systems, and tool integrations.
The GenAI Observability dashboard displays session volume, invocation latency, token usage, and error rates in a unified view. You can filter these metrics by agent ID, session ID, or time range to focus on specific performance patterns.
When you spot anomalies, CloudWatch alarms notify you automatically when latency increases beyond acceptable thresholds or error rates spike above normal levels.
OpenTelemetry traces
Dashboards show system behavior at a high level. Traces show how each request executes step by step.
Amazon Bedrock AgentCore emits distributed traces, structured span-level logs, and metrics under the bedrock-agentcore CloudWatch namespace. This telemetry follows the OpenTelemetry (OTEL) protocol and routes to Amazon CloudWatch by default. If your organization uses Datadog, Grafana Cloud, or Elastic Observability, you can export the same telemetry to those backends without additional instrumentation.
Each trace captures the complete execution flow: reasoning steps, tool invocations, memory retrievals, and final outputs. This granular visibility pinpoints where execution diverges from expected behavior and shows the sequence of decisions that led to the issue.
Key metrics to monitor
Focus on three metric categories: performance, resource usage, and reliability.
Performance metrics
Track latency at the 50th, 95th, and 99th percentiles. Higher latency often signals downstream bottlenecks. Measure memory retrieval time and tool response time separately. This helps isolate which component slows execution.
Resource metrics
Session duration reveals usage patterns. Short sessions may indicate user frustration. Long sessions can signal loops or complex workflows. Concurrent sessions show how many active interactions your system supports. Token usage directly impacts cost. Monitor input and output tokens separately to identify inefficiencies.
Reliability metrics
Error rates show how often executions fail.
Break these down by type:
- Authentication errors.
- Authorization errors.
- Validation errors.
- Timeout errors.
A spike in any category points to a specific area for investigation.
Enabling observability
Before you begin debugging, enable CloudWatch Transaction Search for your account. This allows Amazon Bedrock AgentCore to send trace and metric data to CloudWatch. After you enable this setting, the service begins collecting observability data across your agents, memory systems, and tool integrations. You can then access this data through CloudWatch dashboards and Logs Insights queries.
Step-by-step troubleshooting workflows
The following scenarios walk you through diagnosing and resolving two of the most common production failures. Each scenario shows the symptoms you observe, the Amazon CloudWatch Logs Insights queries you run (each typically taking 2-3 minutes), and the fixes you implement. CloudWatch Logs Insights is a fully managed query service that lets you search and analyze structured log data from Bedrock AgentCore in real time. You access it through the CloudWatch console under the Logs menu.
Scenario 1: Debugging infinite agent loops
Infinite loops occur when agents lack proper termination conditions or fail to recognize when they have made mistakes. Before diving into logs, understanding the three most common root causes will speed up your diagnosis.
Common causes of infinite loops
Poor prompt design happens when system prompts do not establish clear termination conditions. The prompt may not specify how many attempts are reasonable, when to declare a task impossible, or when to escalate to a human. Missing loop detection happens when the agent’s reasoning framework does not recognize repeated actions. Without explicit logic to track prior attempts, the agent has no way to detect the pattern “I have tried this three times and it is not working.” Incorrect tool selection happens when the agent consistently picks the wrong tool, such as trying to solve a math problem with a web search tool instead of a calculator.
Symptoms to watch for
When an agent enters a loop, token usage increases significantly. Session duration also grows beyond normal ranges. In some cases, the agent generates multiple responses without user input. Notably, the error rate remains low because the agent is not crashing. It is simply unable to finish its task.
The CloudWatch GenAI Observability Dashboard shows 266.9K total tokens consumed with a 0% error rate. High token usage combined with no errors is the key indicator of an infinite loop — the agent is running but cannot complete its task.
Diagnosing poor prompt engineering
Start by identifying the problematic session. Run this query in CloudWatch Logs Insights to find sessions with unusually high token usage:
fields @timestamp, SessionId, TokenUsage
| filter TokenUsage > 10000
| sort TokenUsage desc
| limit 20Pick the highest consumer and note its SessionId. Then examine the agent’s reasoning pattern within that session:
fields @timestamp, @message, RequestId
| filter SessionId = ""
| filter Operation like /InvokeAgent/
| sort @timestamp asc
| limit 1000Session details show a single trace with 177 spans and an average latency of 85,590 ms (~85 seconds). Normal agent responses complete in 1–5 seconds. The span count and execution time together confirm the agent entered a loop.
Look for repeated patterns in the agent’s reasoning. The following log sequence is a clear indicator of a loop:
"Try using calculator tool with input 25"
"Result: 24.95"
"This is incorrect, try again"
"Try using calculator tool with input 25"
"Result: 24.95"
"This is incorrect, try again"The OpenTelemetry trace waterfall reveals the root cause: a system prompt instructing the agent to “never give up” and “keep trying until you get the exact answer” with no termination condition. This prompt design flaw directly caused the 177-span loop shown in Figure 2.
To fix prompt design issues, add explicit termination conditions to your agent’s system prompt. Include an instruction such as: “If you attempt the same action three times without success, stop and explain to the user why you cannot complete the task.” Set a maximum token limit per session, typically 5,000 to 10,000 tokens for a conversational agent, and implement reasoning step limits of 10 to 15 steps as a hard stop regardless of internal logic.
Diagnosing loop detection failures
Run this query to examine tool invocation sequences:
fields @timestamp, ToolName, ToolInput, ToolOutput
| filter SessionId = ""
| filter Operation like /InvokeTool/
| sort @timestamp ascThe following pattern in results confirms a loop detection failure:
2026-02-02 22:02:39 | calculate_percentage | {"value": 25, "total": 100} | 25.0
2026-02-02 22:02:45 | calculate_percentage | {"value": 25, "total": 100} | 25.0
2026-02-02 22:02:51 | calculate_percentage | {"value": 25, "total": 100} | 25.0
[repeated 40 more times]
CloudWatch Logs Insights results show 86 repeated tool invocations of calculate_percentage with near-identical inputs, returning values like 24.954% and 25.049% — never the exact 25.00% the prompt demanded. The repeated near-miss values in the whole column confirm the loop detection failure.
To fix loop detection failures, add loop detection to your agent framework. Track tool invocations and reasoning steps. Force a termination after three identical repeated actions. Set a CloudWatch alarm to notify you when average token usage per session increases significantly. This catches loop problems early, helping prevent runaway costs.
Diagnosing incorrect tool selection
Review the agent’s tool selection reasoning in the trace events. The following log pattern indicates the agent is choosing the wrong tool:
"User wants to calculate 25% of 100"
"I should use the web_search tool to find the answer"
[web_search returns irrelevant results]
"Let me try web_search again with different terms"
To fix tool selection, provide clearer tool descriptions with explicit usage examples in your agent’s configuration:
{
  "tools": [
    {
      "name": "calculator",
      "description": "Use this tool for mathematical calculations, including
      percentages, arithmetic, and numerical operations.
      Example: calculating 25% of 100."
    },
    {
      "name": "web_search",
      "description": "Use this tool to find information on the internet.
      Do NOT use for mathematical calculations."
    }
  ]
}
Scenario 2: Tool invocation failures
Tool invocation failures generate explicit errors and elevated error rates in your CloudWatch dashboard. Unlike infinite loops, users receive clear failure messages. The challenge is identifying the root cause quickly.
Common types of tool invocation failures
Five error types account for most tool invocation failures, each pointing to a different fix. Authentication errors (401) occur when credentials are expired, missing, or using the wrong authentication method. Authorization errors (403) arise when the IAM role attached to the agent is missing required policies. Validation errors (400) happen when the agent’s input does not match the tool’s expected schema. Resource not found errors (404) indicate an incorrect tool name, invalid resource ID, or deleted tool. Tool execution errors (500) mean the tool itself failed because of internal errors, timeouts, or rate limits.
Symptoms to watch for
Tool invocation failures generate explicit errors. Your CloudWatch dashboard shows elevated error rates, agent sessions fail to complete, and users report that the agent cannot access information or perform actions.
Diagnosing authentication and authorization errors
Start by identifying which tool fails most often. Run this query in CloudWatch Logs Insights:
fields @timestamp, ToolName, StatusCode, ErrorMessage
| filter Operation like /InvokeTool/
| filter StatusCode like /4[0-9][0-9]|5[0-9][0-9]/
| stats count(*) by ToolName, StatusCode
| sort count descA CloudWatch Logs Insights query breaks down tool invocation errors by type: Exception (45 occurrences), PermissionError (6), and RuntimeError (6). Exception errors dominate, pointing to validation failures as the primary root cause to investigate first.
For authentication and authorization errors, examine the Gateway service role attached to your agent’s gateway. In Amazon Bedrock AgentCore, tools are accessed through Gateways, and the Gateway service role must have permissions to invoke downstream resources:
fields @timestamp, AgentId, ExecutionRoleArn, ErrorMessage
| filter StatusCode = 401 or StatusCode = 403
| limit 100
Compare the Gateway service role’s policies against the permissions the failing tool
関連記事
今日のまとめ
AI日報で今日の重要ニュースをまとめ読み