世界を埋め込む:大規模な航空画像のための多モーダル AI による検索可能化
AWS と Vexcel の連携により、自然言語検索で航空画像から特定情報を抽出するシステムが実証され、業界標準の検索手法に新たなパラダイムをもたらした。
キーポイント
従来の課題と解決策
従来は手動でのタイル確認や個別の画像認識モデル訓練が必要だったが、マルチモーダル埋め込みとベクトル検索により自然言語クエリで即座に検索可能になった。
AWS 技術スタックの活用
Amazon Bedrock と Amazon OpenSearch Serverless を基盤とし、大規模な航空画像データをインデックス化して効率的なセマンティック検索を実現した。
評価と実証実験
OpenStreetMap の正解データを用いた評価で、Amazon Nova Multimodal Embeddings が最も高い F1 スコアを達成し、設計選択の優位性を示した。
影響分析・編集コメントを表示
影響分析
この記事は、大規模な地理空間データの分析において、高コストかつ時間のかかる個別モデル訓練の必要性を解消し、自然言語による直感的な検索を可能にする実用的な解決策を示しています。AWS と Vexcel の具体的な連携事例は、マルチモーダル AI が産業レベルでどのように展開され、ビジネス価値を生み出しているかを明確に示しており、業界全体のデータ活用プロセスを加速させる重要な転換点となります。
編集コメント
個別の画像認識モデルを構築する手間を省き、自然言語で質問できるシステムの実現は、地理空間データ活用の民主化に向けた大きな一歩です。特に、特定の商品やサービス名に依存しない汎用的な技術スタックとしての価値が明確に示されている点が高く評価されます。
航空画像のライブラリを自然言語検索可能な知識ベースに変換することは、地理空間データに依存するすべての業界(保険、不動産、政府、インフラ、農業)に関わる課題です。従来のアプローチでは、タイルごとに手動で検査するか、新しい質問ごとに独自のカスタムコンピュータビジョンモデルを訓練する必要がありました。マルチモーダル埋め込み、大規模言語モデル(LLM)によるキャプション生成、および AWS 上のベクトル検索は、より迅速な代替手段を提供します:一度インデックスを作成すれば、後は自然言語でクエリを実行するだけです。
私たちは、世界最大級の航空画像プログラムの一つを運営している航空画像・地理空間データプロバイダーである Vexcel と協力し、マルチビュー航空画像における埋め込みモデル、融合戦略、キャプション統合、検索手法の評価を行いました。独自のセンサーと専用飛行機隊を保有する Vexcel は、45 以上の国と地域で高解像度データを収集し、オルソモザイク画像、複数の角度からの斜視画像、および標高モデルを提供しています。データは存在し、ユースケースも多数ありますが、数十億のピクセルを実世界に関する回答に変換するには、より迅速な道筋が必要です。
本稿では、問題領域の概要、Amazon Bedrock および Amazon OpenSearch Serverless 上で構築したアーキテクチャ、OpenStreetMap の正解データに基づく評価手法、埋め込みモデル・融合戦略・キャプション生成・検索手法を比較した 4 つの実験、そして同様のシステム構築時に適用可能な実践的なガイダンスについて解説します。地理空間セマンティック検索においてどの設計選択が効果をもたらすか、特に当社の評価において Amazon Nova Multimodal Embeddings が両方のベンチマーククエリで最も高い F1 スコアを示した理由などをお伝えします。ここで紹介された研究は、検索可能な画像製品である Vexcel Intelligence へと発展しました。
特徴ごとの学習なしに数百万枚の航空画像を検索する
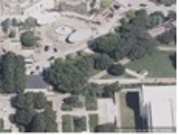
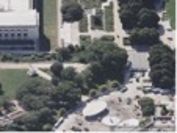
顧客が郊外のプールを検索したい場合や、開発区域の道路網を特定したい場合、あるいは都市全体の太陽光パネル数を数えたい場合、誰かが数百万枚の画像にわたってタイルごとに手動で検索(各地図タイルを順次検査)する必要があります。代替案として、各特徴に対してコンピュータビジョンモデルを訓練する方法がありますが、これにはラベル付きデータ、エンジニアリング時間、継続的な再学習が必要です。次に顧客が「側面に落書きがある倉庫」を検索したい場合(図 1 を参照)、同じサイクルを繰り返すことになります。ベクトル埋め込みによって駆動されるセマンティック検索は、この特徴ごとの学習ステップを排除し、自然言語によるクエリを数秒で結果に変換します。
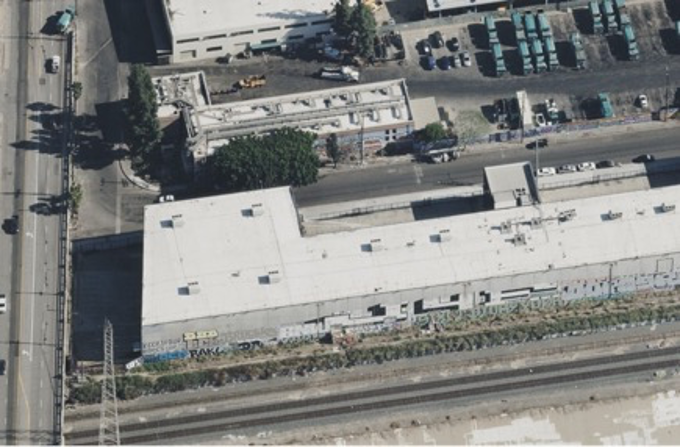
*Figure 1. A typical oblique image from Vexcel, providing models rich 360-degree vision of the world*
Vexcel はこの問題に対し、画像と不動産データを組み合わせたエージェントベースのアプローチ、類似度検索のためのプロパティ埋め込みシステム、大規模言語モデル(LLM)によって生成されたキャプションを備えたタイル状のマルチモーダル埋め込みパイプラインという 3 つの前回の概念実証(POC)を通じて取り組んできました。3 つ目のアプローチは有望な結果を示しましたが、同時に重要な疑問点を提起しました:どの埋め込みモデルを使用すべきか、1 つの場所に対する複数の視点データをどう扱うべきか、そしてキャプションが実際に検索結果を改善するのか、それとも単にコストを増加させるだけなのかという点です。
AWS Generative AI Innovation Center(GenAIIC)は、Vexcel と連携し、マルチビュー航空画像におけるセマンティック検索のための最適な組み合わせとは何かという焦点を絞った問いに答えました。具体的には、埋め込みモデル、融合戦略、キャプション生成アプローチ、および検索手法の最適化です。Vexcel はドメイン専門知識と実世界のデータを提供し、GenAIIC は機械学習アーキテクチャ、 ingestion から評価までの完全なパイプライン、そして AWS サービスとの統合を担当しました。その結果、Vexcel は現在プレビュー段階にある製品 Vexcel Intelligence へとこのシステムを進化させました。これは同社の画像ライブラリを検索可能で AI によるクエリが可能なソリューションへと変換するものです。
なぜ地理空間画像検索は異なるのか
地理空間画像の検索は、消費者向け写真の検索とは根本的に異なります。Google 画像で「スイミングプール」というクエリを実行すると、単一の視点からの独立した写真が取得されます。しかし、航空画像はそのように機能しません。
1 つの地図タイルは単なる画像ではありません。それは同じ場所の7つの補完的な視点です。
各タイルには、上空から見た RGB 画像であるオルソフォト、北・南・東・西の4方向から撮影された斜め写真、構造物を含む標高情報を符号化したデジタル表面モデル(DSM: Digital Surface Model)、および裸地の高さを表すデジタル地形モデル(DTM: Digital Terrain Model)が含まれています。以下の図は、1 つのタイルにおけるこれら7つの視点がどのように見えるかを示しています。それぞれが同じ地理的な場所について異なる詳細を捉えています。
 image
image
*Figure 2. Seven complementary views of the same tile (top row: Ortho, North oblique, South oblique, East oblique; bottom row: West oblique, DTM, DSM)*
これらの視点は、劇的に異なる詳細を明らかにします。直前の図では、建物の正面ファサード(キオスクのような窓が特徴)は南斜め角度からのみ確認可能であり、オルソ写真、残りの斜め視点、および標高モデルからは完全に見逃されています。一方、DSM(デジタル表面モデル:Digital Surface Model)は、RGB 画像では地面の地物を隠してしまう樹木の冠部を捉えており、DTM(デジタル地形モデル:Digital Terrain Model)は植生を完全に除去しています。一つの視点しか見ない埋め込みモデルは不完全な情報に基づいて動作します。一方、7 つの視点を把握するモデルには、それらを統合するための戦略が必要です。
## The ground truth challenge
消費者向け画像検索には、ImageNet、COCO、Open Images といった数十年にわたるラベル付きデータセットが存在します。しかし、この規模での航空写真特徴検出にはそのようなものがありません。事前ラベル付けされたコーパスなしで検索品質を評価する方法が必要であり、それが OpenStreetMap を自動的な正解(グランドトゥルース)ソースとして採用するに至りました。この決定が、評価フレームワーク全体を形作ることとなりました。
正解とみなされるものの曖昧さ
3 つ目の課題は曖昧さであり、これはビュー選択よりもさらに深い問題です。例えば「水泳プール」という検索で、オルソ写真ではプールが確認できるが、斜め視点のいずれの写真でも確認できないタイルが返された場合、その結果が正しいのかどうか不明確です。逆のパターンも同様に曖昧です。南側の斜め視点からはプールが見えるが、上空からの視点では見えないタイルの場合です。
ズームレベルはこの問題をさらに複雑にします。タイルの解像度によっては、1 つのタイルが市街地のブロック全体をカバーすることもあれば、近隣地区全体をカバーすることもあります。密集した郊外地域では、1 つのタイルの中に dozen 個もの水泳プールが含まれる可能性があります。正解データ(グランドトゥルース)は、システムが *1 つでも* 一致する特徴を含むタイルを返せばよいのか、それともそのタイル内の *すべての* インスタンスを考慮すべきなのかという点です。タイルレベルでのマッチング(少なくとも 1 つのプールが存在すること)と、特徴レベルでのマッチング(すべてのプールが対象となること)は、根本的に異なる評価基準であり、それぞれが異なるシステム動作を評価するものです。「正しい」とは何を意味するのかを定義しなければ、それを測定することはできませんでした。
研究課題の共設計
最適化コードを1行も書く前に、私たちは評価ハッチ(評価基盤)を構築しました。これは意図的な選択でした:調整する前に測定せよ。検索品質を厳密に測定する方法がなければ、あらゆるアーキテクチャ上の決定は単なる意見に過ぎません。
この取り組みは、検索品質に影響を与える特定のアーキテクチャ的決定をそれぞれ対象とした以下の6つの質問を中心に構成されました:
- エアリアル画像を最もよく理解する埋め込みモデルはどれでしょうか?Amazon Nova Multimodal Embeddings、Amazon Titan Multimodal Embeddings G1、Cohere Embed v4 を比較しました。これらはすべて Amazon Bedrock で利用可能です。Amazon Bedrock は、主要な AI 企業から高パフォーマンスなファウンデーションモデル(FMs)を単一の API を通じて選択できる、完全に管理されたサービスです。一方、Amazon Nova は Amazon Bedrock を通じて提供されるファウンデーションモデルのファミリーです。
- 地理的な場所ごとに 7 枚の画像をどのように扱うべきでしょうか?ビューごとの埋め込み、後期融合(平均プーリングおよび最大プーリング)、LLM 重み付けアテンション融合、Cohere のネイティブ多画像バッチエンコーディングを検証しました。
- LLM 生成キャプションは検索精度を向上させるでしょうか?私たちは、ファウンデーションモデルに対して同じ地理的場所の補完的なビューとして 7 枚の画像を同時に分析し、各画像タイプ(オルソ写真、斜角写真、DSM、DTM)を特定し、土地利用、建築環境、インフラ、自然特徴、物体、空間関係にわたる統合された記述を合成するよう指示するカスタムキャプションプロンプトを設計しました。このプロンプトは明示的にモデルに対して視点を相互参照するよう指示しています:あるビューで不明瞭なものが現れた場合、他の角度や標高データを使用してそれを解決するようにします。このプロンプトは Amazon Bedrock 上の Amazon Nova 2 Lite と Anthropic の Claude でテストされ、画像埋め込みとともにこれらのキャプションをインデックス化することが検索の取得(retrieval)を改善するかどうかを測定しました。
- LLM 抽出メタデータはフィルタリングを改善できるでしょうか?私たちは、生成された各キャプションから最大 25 のキーワードタグ(例:"swimming pool"、"mature trees"、"commercial district")を抽出するために、2 回目のファウンデーションモデル処理を使用し、埋め込みとともに Amazon OpenSearch Serverless のテキストフィールドに保存しました。クエリ実行時には、ユーザーの検索クエリに対して同じ抽出が実行されます。Amazon OpenSearch Serverless の k-nearest neighbor(k-NN)フィルタリングは、その後ベクトル類似度を実行する前に、これらのタグを事前フィルタとして使用し、タグがクエリ用語と一致するドキュメントに候補セットを絞り込みます。これは、構造化メタデータとセマンティック検索を組み合わせるためにネイティブのフィルター付き k-NN を利用しています。
- 異なる特徴タイプに対してどの検索戦略が最も効果的でしょうか?基本的な k-NN、多視点融合検索、ハイブリッド画像+キャプションスコアリング、メタデータフィルタ付き検索、テキストのみ検索を比較しました。
- 公開されているグランドトゥルース(正解データ)を使用して自動評価フレームワークを構築できるでしょうか?OpenStreetMap から Overpass API を経由してグランドトゥルースを取得し、手動ラベル付けなしで反復可能なベンチマークを実現可能としました。
評価エリアはシカゴのグラントパークとし、2 つのベンチマーククエリを設定しました:"swimming pools"(離散物体検出)および "roads"(分散インフラ検出)。これらの次元にわたって約 100 の異なる構成をテストしました。
アーキテクチャの概要
本システムは、5 つの段階からなるパイプライン(図 3)に従っており、各段階は A/B テストのために独立して交換可能です。
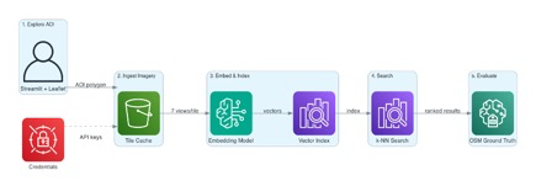
*図 3. 5 つの段階からなるパイプラインアーキテクチャ*
第 1 ステージ:関心領域(AOI)の探索。 ユーザーはインタラクティブな地図上で多角形を描画し、関心領域を定義します。この AOI は再現性を確保するために Amazon Simple Storage Service (Amazon S3) に永続化されます。
第 2 ステージ:画像の取り込み。 システムは、AOI と交差するすべての地図タイルについて、設定可能なズームレベルで Vexcel の API からタイルを取得します。各タイルからは最大 7 枚の画像が得られます。レート制限(1 秒あたり 100 リクエスト)と Amazon S3 のキャッシュ機能により、重複した API 呼び出しを防ぎます。認証情報は AWS Secrets Manager を通じて管理されます(図 4)。
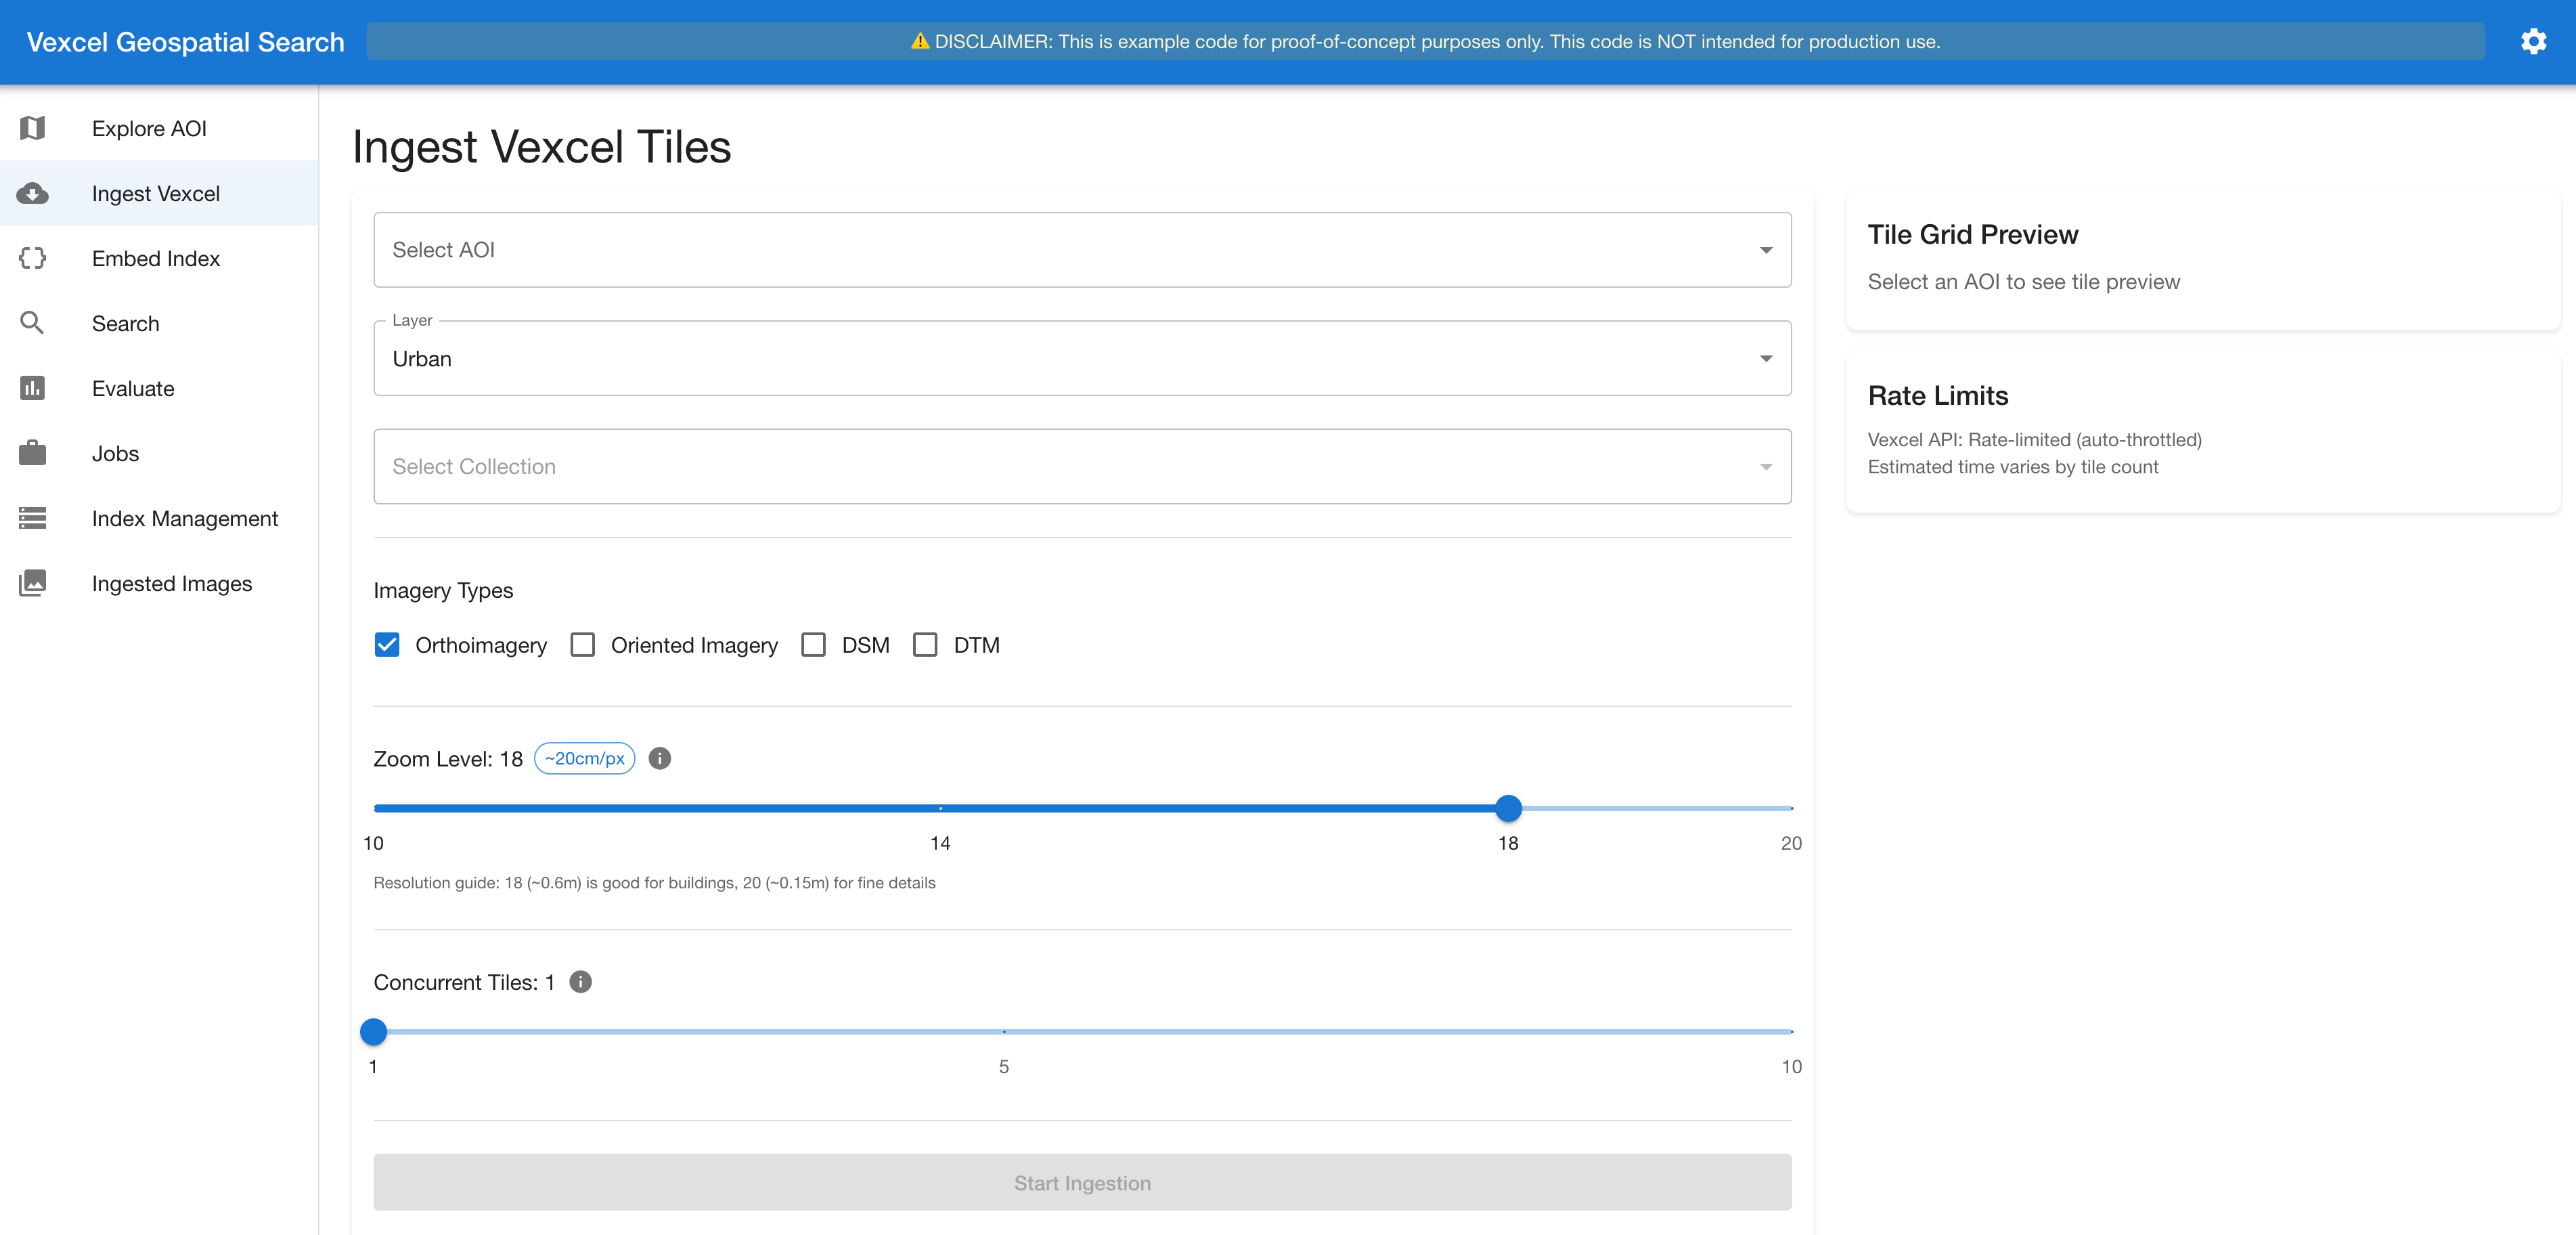
*図 4. 取り込みインターフェース:画像タイプとズームレベルの選択*
ステージ3:埋め込みとインデックス化。 各画像は選択されたAmazon Bedrockの埋め込みモデルを通過します。オプションとして、7つのビューをビジョンLLM(Amazon Nova 2 Lite または Anthropic の Claude)に送信し、構造化されたテキスト説明を生成することもできます。その後、埋め込みベクトルとキャプションが Amazon OpenSearch Serverless または Amazon S3 Vectors にインデックスされます。このインターフェースには、キャプション生成の制御機能、リアルタイムの次元影響分析、埋め込みモデル、および融合戦略の選択機能(図5および図6)が提供されています。
ステージ4:検索。 自然言語クエリは同じモデルを使用して埋め込まれ、その後インデックスと照合されます。システムはインデックス内に存在するフィールド(各ビューごとの埋め込みベクトル、融合された埋め込みベクトル、キャプションテキスト、キャプションの埋め込みベクトル)を自動的に検出し、インデックスがサポートする検索メソッドのみを動的に有効化します。
ステージ5:評価。 検索結果は、精度(precision)、再現率(recall)、F1 スコアを用いて OpenStreetMap の正解データに対してスコアリングされます。評価フレームワークは、有効になっているすべての検索メソッドに対して同一のクエリを実行し、比較指標を報告します。
モジュール型設計が主要なアーキテクチャ上の決断でした。各コンポーネント(埋め込みモデル、融合戦略、検索方法、ベクトルストア)は共通インターフェースを通じて接続されています。Amazon Nova Multimodal Embeddings を Cohere Embed v4 に置き換える場合でも、コードの変更ではなく設定変更で済みます。これにより、私たちは数週間ではなく数時間で約100通りの構成をテストすることが可能になりました。
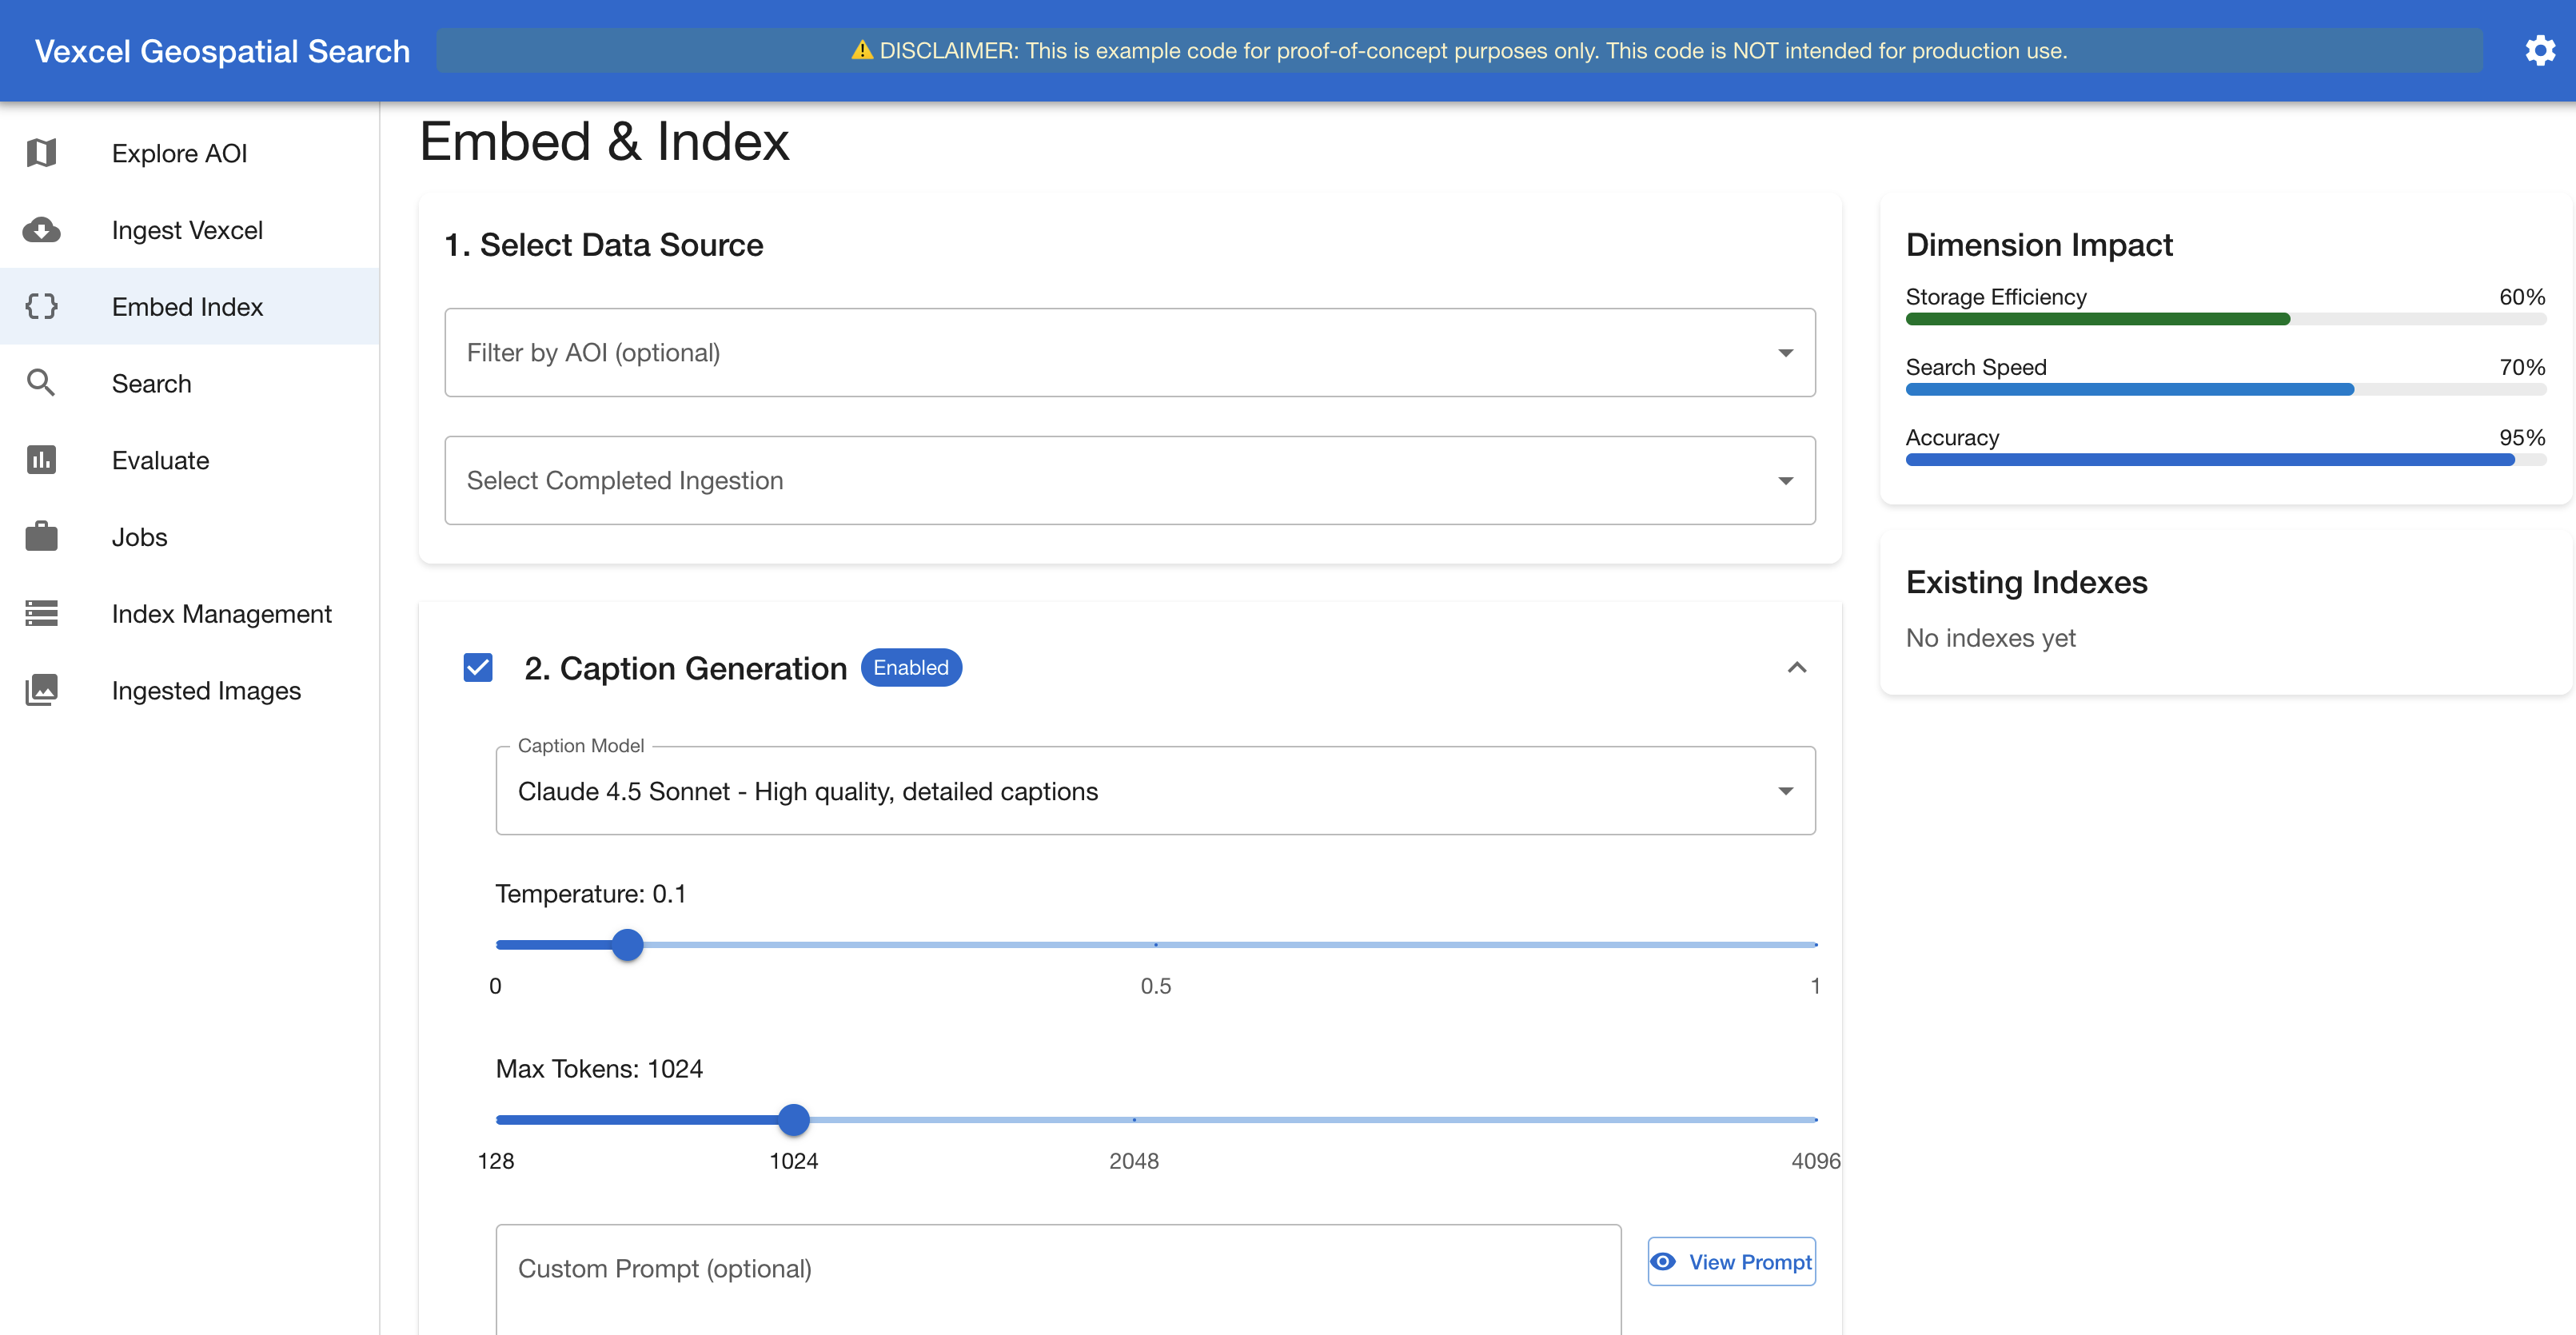
*図 5. 「埋め込みとインデックス作成」インターフェース – キャプション生成セクション*
次の図は、埋め込み設定パネルを示しています。ここではユーザーがインデックス作成実行に使用する埋め込みモデルと融合戦略を選択します。
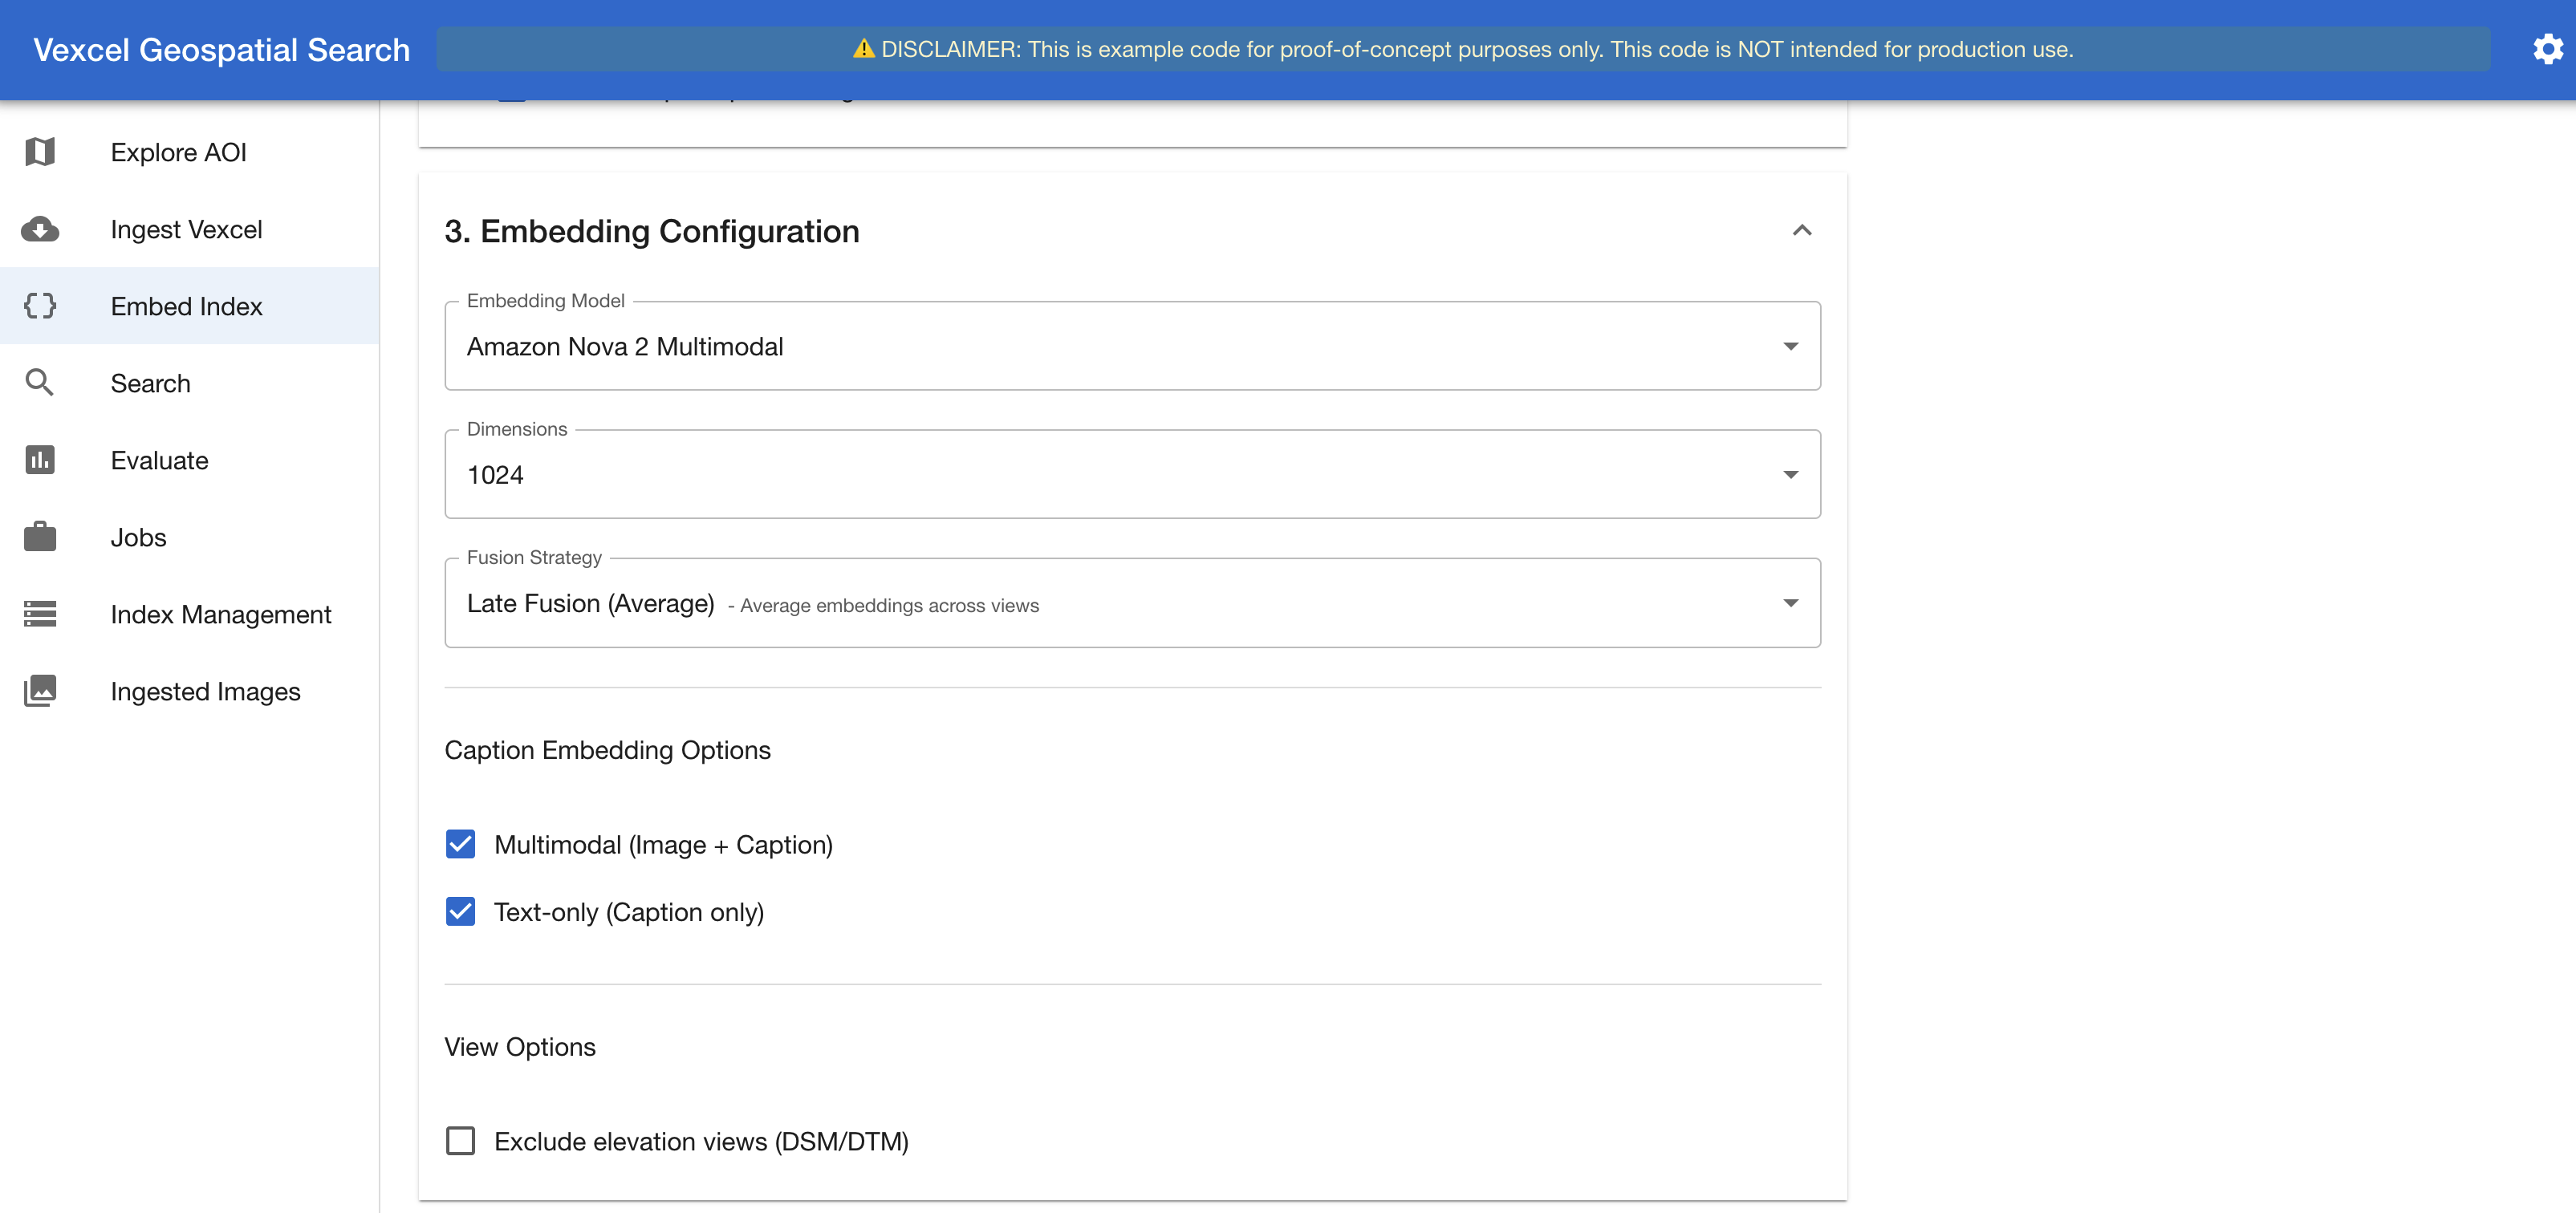
*図 6. 「埋め込みとインデックス作成」インターフェース – 埋め込み設定セクション*
適切な K の選択
すべてのベクトル検索は、上位 k 最近傍 (k-NN) 結果を返します。K は実質的な影響を持つレバーであり、その適切な値はデータセット内での特徴の出現頻度によって異なります。
ある特徴が希少(数百枚のタイルに点在する数個のプールなど)である場合、大きな K の値を設定すると、関連性の低いタイルで結果が溢れてしまいます。システムは、K 件の関連タイルが存在するかどうかに関わらず、K 件分の結果を抽出します。例えば、8 枚のタイルにのみプールが含まれている状況で K=50 と設定すると、そのうち 42 件がノイズとなります。これにより精度 (Precision) が崩壊し、F1 スコアもそれに追随して低下します。
一方、ある特徴が豊富(ほとんどのタイルに道路が存在するなど)である場合、小さな K の値は再現率 (Recall) を人為的に制限することになります。例えば、60 枚のタイルに道路が含まれている状況で K=5 と設定すると、そのうち 8% しか発見できません。これにより再現率が崩壊し、F1 スコアもそれに追随して低下します。
この関係は機械的なものです。Precision@K = 関連するタイル数 / K です。もし K が関連するタイルの総数を上回る場合、精度が 1.0 に達することはありません。Recall@K = 関連するタイル数 / 全関連タイル数です。もし K が全関連タイル数より小さい場合、完全な再現率は達成できません。
私たちは複数の K 値(K = 3, 5, 7, 10, 15, 20, 25, 30, 50)を同時に評価し、精度、再現率、F1 スコアがその範囲でどのように変化するかを追跡しました。最適な K は常に、実世界のデータ(ground truth)における関連タイルの実際の数に近い値に収束します。これは本番環境では事前にわからない数値です。実際には、一般的なクエリに対しては K=10〜20 から始め、評価結果で精度と再現率のトレードオフを観察し、機能カテゴリごとに調整してください。この評価フレームワークにより、このような較正が迅速に行えます。異なる K 値で再実行するコストは数秒であり、数時間ではありません。
測定方法の二通り:タイルベース評価とエンティティベース評価
*何がヒットとしてカウントされるか* によって、単一の指標では重要な挙動を見逃す可能性があります。私たちは異なる問いに答えるための、2 つの補完的なモードを備えた評価フレームワークを構築しました。
タイルベース評価は、「正しい場所を見つけられたか?」という問いを立てます。タイルは関連する(特徴の少なくとも 1 つのインスタンスを含む)か、しないかのどちらかです。あるタイルに水泳プールが 1 つあろうとも 12 あろうとも、いずれの場合も 1 つの関連タイルとしてカウントされます。精度、再現率、F1 スコアはタイル単位で計算されます。
エンティティベースの評価は、「最も多くの特徴を検出できたか?」を問うものです。各個別のエンティティ(各池、各道路区間)は別々にカウントされます。5 つの池を含むタイルは関連する合計値に 5 を貢献します。そのタイルを見つけ出すことで 5 つのエンティティが復元され、見逃せば 5 つを失うことになります。
特徴の分布が不均等な場合、この二つのモードは分岐します。空中画像においては、それはほぼ常に起こり得ます。私たちの評価から示されるシナリオを考えてみましょう:
原文を表示
Turning a library of aerial imagery into a natural-language-searchable knowledge base is a problem that touches every industry that relies on geospatial data — insurance, real estate, government, infrastructure, and agriculture. The traditional path requires either manual tile-by-tile inspection or training a bespoke computer vision model for each new question. Multimodal embeddings, large language model (LLM) captioning, and vector search on AWS offer a faster alternative: index once, then query using natural language.
We worked with Vexcel, an aerial imagery and geospatial data provider that operates one of the largest aerial imagery programs in the world, to evaluate embedding models, fusion strategies, caption integration, and search methods over multi-view aerial imagery. Using its own sensors and a dedicated fleet of aircraft, Vexcel collects high-resolution data across 45+ countries and territories, delivering orthomosaic imagery, oblique imagery from multiple angles, and elevation models. The data exists, and the use cases are numerous, but turning billions of pixels into answers about the real world requires a faster path.
In this post, we walk through the problem space, our architecture on Amazon Bedrock and Amazon OpenSearch Serverless, the evaluation methodology we built on OpenStreetMap ground truth, four experiments that compared embedding models, fusion strategies, captioning, and search methods, and the practical guidance you can apply when building a similar system. You’ll learn which design choices move the needle for geospatial semantic search, including why Amazon Nova Multimodal Embeddings delivered the highest F1 scores across both benchmark queries in our evaluation. The work described here evolved into Vexcel Intelligence, a searchable imagery product.
Searching millions of aerial images without per-feature training
When a customer needs to locate swimming pools in a suburb, identify road networks in a development zone, or count solar panels across a city, someone has to manually look tile-by-tile (inspecting each map tile in turn) across millions of images. The alternative is training a computer vision model for each feature, which requires labeled data, engineering time, and ongoing retraining. When the next customer wants to find warehouses with graffiti on the side (see Figure 1), they repeat the cycle. Semantic search powered by vector embeddings removes this per-feature training step and turns natural-language queries into results in seconds.
*Figure 1. A typical oblique image from Vexcel, providing models rich 360-degree vision of the world*
Vexcel had explored this problem through three prior POCs: an agent-based approach combining imagery with property data, a property embedding system for similarity search, and a tiled multimodal embedding pipeline with captions generated by a large language model (LLM). The third showed promise but raised key questions: which embedding model to use, how to handle multiple views per location, and whether captions actually improve results or just add cost.
The AWS Generative AI Innovation Center (GenAIIC) partnered with Vexcel to answer a focused question: what is the optimal combination of embedding model, fusion strategy, captioning approach, and search method for semantic search over multi-view aerial imagery? Vexcel brought domain expertise and real-world data, while GenAIIC contributed ML architecture, a complete ingestion-to-evaluation pipeline, and AWS service integration. The result is a system Vexcel has since evolved into Vexcel Intelligence, a product now in preview that transforms their imagery library into a searchable, AI-queryable solution.
Why geospatial imagery search is different
Geospatial imagery search is fundamentally different from searching consumer photos. A query for “swimming pool” on Google Images retrieves standalone photographs from a single perspective. Aerial imagery doesn’t work that way.
A single map tile isn’t one image. It’s seven complementary perspectives of the same location.
Each tile includes an orthophoto (the top-down RGB view), four oblique photographs captured at angles from the north, south, east, and west, a Digital Surface Model (DSM) encoding elevation including structures, and a Digital Terrain Model (DTM) representing bare ground height. The following figure shows what these seven perspectives look like for a single tile — each captures different details about the same geographic location.
*Figure 2. Seven complementary views of the same tile (top row: Ortho, North oblique, South oblique, East oblique; bottom row: West oblique, DTM, DSM)*
These perspectives reveal radically different details. In the preceding figure, the building’s front façade (featuring a kiosk-like window) is only visible from the south oblique angle; the orthophoto, the remaining oblique views, and the elevation models miss it entirely. Meanwhile, the DSM captures tree canopy that obscures ground-level features in the RGB views, and the DTM strips vegetation away altogether. An embedding model that sees only one view works with incomplete information. One that sees the seven perspectives needs a strategy for combining them.
The ground truth challenge
Consumer image search has decades of labeled datasets such as ImageNet, COCO, and Open Images. Aerial feature detection at this scale has none. We needed a way to evaluate search quality without a pre-labeled corpus, which led us to OpenStreetMap as an automated ground truth source, a decision that shaped the entire evaluation framework.
Ambiguity in what counts as a correct result
The third challenge is ambiguity, and it runs deeper than view selection. Consider a search for “swimming pools” that returns a tile where the pool is visible only in the ortho photo but not in any oblique view. It is unclear whether that result is correct. The reverse case is equally ambiguous: a tile where the pool is visible from the south oblique but not from above.
Zoom level compounds this. Depending on tile resolution, a single tile might cover a city block or an entire neighborhood. In a dense suburban area, one tile could contain a dozen swimming pools. Should the ground truth require the system to return a tile if it contains *a* matching feature, or should it account for *every* instance within that tile? A tile-level match (at least one pool present) and a feature-level match (every pool accounted for) are fundamentally different evaluation criteria, and they reward different system behaviors. We had to define what “correct” means before we could measure it.
Co-designing the research agenda
Before writing a single line of optimization code, we built the evaluation harness. This was deliberate: measure before you tune. Without a rigorous way to measure search quality, every architectural decision becomes an opinion.
The engagement was structured around the following six questions, each targeting a specific architectural decision that affects search quality:
- Which embedding model best understands aerial imagery? We compared Amazon Nova Multimodal Embeddings, Amazon Titan Multimodal Embeddings G1, and Cohere Embed v4, each available in Amazon Bedrock, a fully managed service that offers a choice of high-performing foundation models (FMs) from leading AI companies through a single API. Amazon Nova, in turn, is a family of foundation models available through Amazon Bedrock.
- How should you handle seven images per geographic location? We tested per-view embeddings, late fusion (average and max-pool), LLM-weighted attention fusion, and Cohere’s native multi-image batch encoding.
- Does LLM-generated captioning improve search accuracy? We designed a custom captioning prompt that instructs the FM to analyze the seven images simultaneously as complementary views of the same geographic location, identifying each image type (ortho, oblique angles, DSM, DTM) and synthesizing a unified description across land use, built environment, infrastructure, natural features, objects, and spatial relationships. The prompt explicitly directs the model to cross-reference perspectives: when something appears unclear in one view, use other angles or elevation data to resolve it. We tested this prompt with Amazon Nova 2 Lite and Anthropic’s Claude in Amazon Bedrock, measuring whether indexing those captions alongside image embeddings improved retrieval.
- Can LLM-extracted metadata improve filtering? We used a second FM pass to extract up to 25 keyword tags from each generated caption (for example, “swimming pool”, “mature trees”, “commercial district”) and stored them in an Amazon OpenSearch Serverless text field alongside the embeddings. At query time, the same extraction runs on the user’s search query. Amazon OpenSearch Serverless k-nearest neighbor (k-NN) filtering then uses these tags as a pre-filter, narrowing the candidate set to documents whose tags match the query terms before running vector similarity. This uses native filtered k-NN to combine structured metadata with semantic search.
- Which search strategy works best for different feature types? We compared basic k-NN, multi-view fusion search, hybrid image+caption scoring, metadata-filtered search, and text-only search.
- Can you build an automated evaluation framework using publicly available ground truth? We sourced ground truth from OpenStreetMap via the Overpass API, enabling repeatable benchmarks without manual labeling.
The evaluation area was Grant Park in Chicago, with two benchmark queries: “swimming pools” (discrete object detection) and “roads” (distributed infrastructure detection). We tested approximately 100 distinct configurations across these dimensions.
Architecture overview
The system follows a five-stage pipeline (Figure 3), each stage independently swappable for A/B experimentation.
*Figure 3. Five-stage pipeline architecture*
Stage 1. Explore Area of Interest (AOI). Users draw a polygon on an interactive map to define their area of interest. The AOI is persisted to Amazon Simple Storage Service (Amazon S3) for reproducibility.
Stage 2. Ingest Imagery. The system fetches tiles from Vexcel’s API for every map tile intersecting the AOI at a configurable zoom level. Each tile yields up to seven images. Rate limiting (100 requests/second) and Amazon S3 caching help prevent redundant API calls. Credentials are managed through AWS Secrets Manager (Figure 4).
*Figure 4. The ingestion interface: selecting imagery types and zoom level*
Stage 3. Embed & Index. Each image passes through the selected Amazon Bedrock embedding model. Optionally, the seven views are sent to a vision LLM (Amazon Nova 2 Lite, or Anthropic’s Claude) to generate a structured text description. Embeddings and captions are then indexed into Amazon OpenSearch Serverless or Amazon S3 Vectors. The interface provides caption generation controls, a real-time dimension impact analysis, embedding model, and fusion strategy selection (Figures 5 and 6).
Stage 4. Search. Natural language queries are embedded using the same model, then matched against the index. The system auto-detects which fields exist in the index (per-view embeddings, fused embeddings, caption text, caption embeddings) and dynamically enables only the search methods that the index supports.
Stage 5. Evaluate. Search results are scored against OpenStreetMap ground truth using precision, recall, and F1 score. The evaluation framework runs the same query across every enabled search method and reports comparative metrics.
The modular design was the key architectural decision. Every component (embedding model, fusion strategy, search method, vector store) connects through a common interface. Swapping Amazon Nova Multimodal Embeddings for Cohere Embed v4 is a configuration change, not a code change. This enabled us to test ~100 configurations in hours rather than weeks.
*Figure 5. The Embed & Index interface – Caption Generation section*
The following figure shows the embedding configuration panel, where users select the embedding model and fusion strategy for their indexing run.
*Figure 6. The Embed & Index interface – Embedding Configuration section*
Choosing the right K
Every vector search returns the top k-NN results. K is a lever with real consequences, and the right value depends on how common the feature is in your dataset.
When a feature is sparse (a few swimming pools scattered across hundreds of tiles), a large K floods results with irrelevant tiles. The system retrieves K results regardless of whether K relevant tiles exist. Set K=50 when only 8 tiles contain pools, and 42 of those results are noise. Precision collapses. F1 follows.
When a feature is abundant (roads appearing in most tiles), a small K artificially caps recall. Set K=5 when 60 tiles contain roads, and you can only find 8% of them. Recall collapses. F1 score follows.
The relationship is mechanical. Precision@K = relevant_found / K. If K exceeds the number of relevant tiles, precision can never reach 1.0. Recall@K = relevant_found / total_relevant. If K is smaller than the total relevant tiles, perfect recall is impossible.
We evaluated at multiple K values simultaneously (K = 3, 5, 7, 10, 15, 20, 25, 30, 50) and tracked how precision, recall, and F1 score shifted across the range. The optimal K consistently landed near the actual count of relevant tiles in the ground truth, a number you won’t know in production. In practice, start with K=10–20 for general queries, observe the precision-recall tradeoff in your evaluation results, and adjust per feature category. The evaluation framework makes this calibration fast; rerunning with different K values costs seconds, not hours.
Two ways to measure: tile-based vs. entity-based evaluation
A single metric can mask important behavior depending on *what you count as a hit*. We built the evaluation framework with two complementary modes that answer different questions.
Tile-based evaluation asks: *did we find the right locations?* A tile is either relevant (contains at least one instance of the feature) or not. If a tile has one swimming pool or twelve, it counts as one relevant tile either way. Precision, recall, and F1 are computed over tiles.
Entity-based evaluation asks: *did we find the most features?* Each individual entity (each pool, each road segment) counts separately. A tile with 5 pools contributes 5 to the relevant total. Finding that tile recovers 5 entities. Missing it loses 5.
The two modes diverge when features are unevenly distributed, and in aerial imagery, they almost always are. Consider this scenario from our evaluation:
関連記事
Amazon Bedrock AgentCore を活用したタンパク質研究コパイロットの構築方法
AWS は、Amazon Bedrock AgentCore を使用して、研究者が自然言語でペプチドを検索し、AI が結果を要約するタンパク質研究用コパイロットを構築する方法を発表しました。
Amazon Bedrock Guardrails の InvokeGuardrailChecks API でエージェント型 AI アプリケーションを保護
AWS は、Amazon Bedrock Guardrails に新 API「InvokeGuardrailChecks」を追加した。これにより、開発者は guardrail リソースを作成せずとも、エージェント型 AI アプリケーションの任意の時点で個別の安全チェック(ガードレール)を実行できるようになった。
Amazon Bedrock に Google DeepMind の「Gemma 4」モデルシリーズが追加
Google DeepMind が開発したオープンウェイトの AI モデル「Gemma 4」シリーズ(31B、26B-A4B、E2B)が、Amazon Bedrock で利用可能になった。
今日のまとめ
AI日報で今日の重要ニュースをまとめ読み