Claude Enterprise に新分析機能とコスト管理が追加されました
Anthropic は Claude Enterprise の利用者が、サービスの使用状況を詳細に分析しコストを厳格に制御できる新機能を公開した。
キーポイント
詳細な分析機能の追加
Enterprise ユーザーがサービス利用状況をより深く理解できるよう、新しい分析ツールが提供されるようになった。
コスト制御機能の強化
予算超過や予期せぬ支出を防ぐため、コストを厳格に管理・制御する機能が実装された。
エンタープライズ向け最適化
大規模組織における AI 導入の効率化とガバナンス強化を目的とした機能拡充が行われた。
影響分析・編集コメントを表示
影響分析
本発表は、大規模組織における AI ツールの導入・運用において最も懸念される「コストの予測不能性」と「利用状況のブラックボックス化」に対する明確な解決策を示しています。これにより、セキュリティやコンプライアンスを重視する企業にとって Claude Enterprise の採用障壁が下がり、より広範なエンタープライズ展開が加速すると予想されます。
編集コメント
企業利用におけるコスト管理と可視化は、AI 導入の成否を分ける重要な要素であり、今回の機能強化は実務的なニーズに応えた極めて重要なアップデートです。
We’re introducing richer admin analytics, model-level entitlements, and spend alerts for Claude Enterprise. As Claude takes on increasingly difficult and complex agentic work across the organization, usage and cost patterns look different from a standard chat tool. These controls give admins the visibility to understand how Claude is being used and the tools to manage costs.
Today's additions build on controls Anthropic already provides: spend caps at every level, access and model routing, a usage analytics dashboard with exports and an Analytics API, and effort controls. Richer analytics and more granular cost controls are the newest additions to a control surface we've been building on for months.
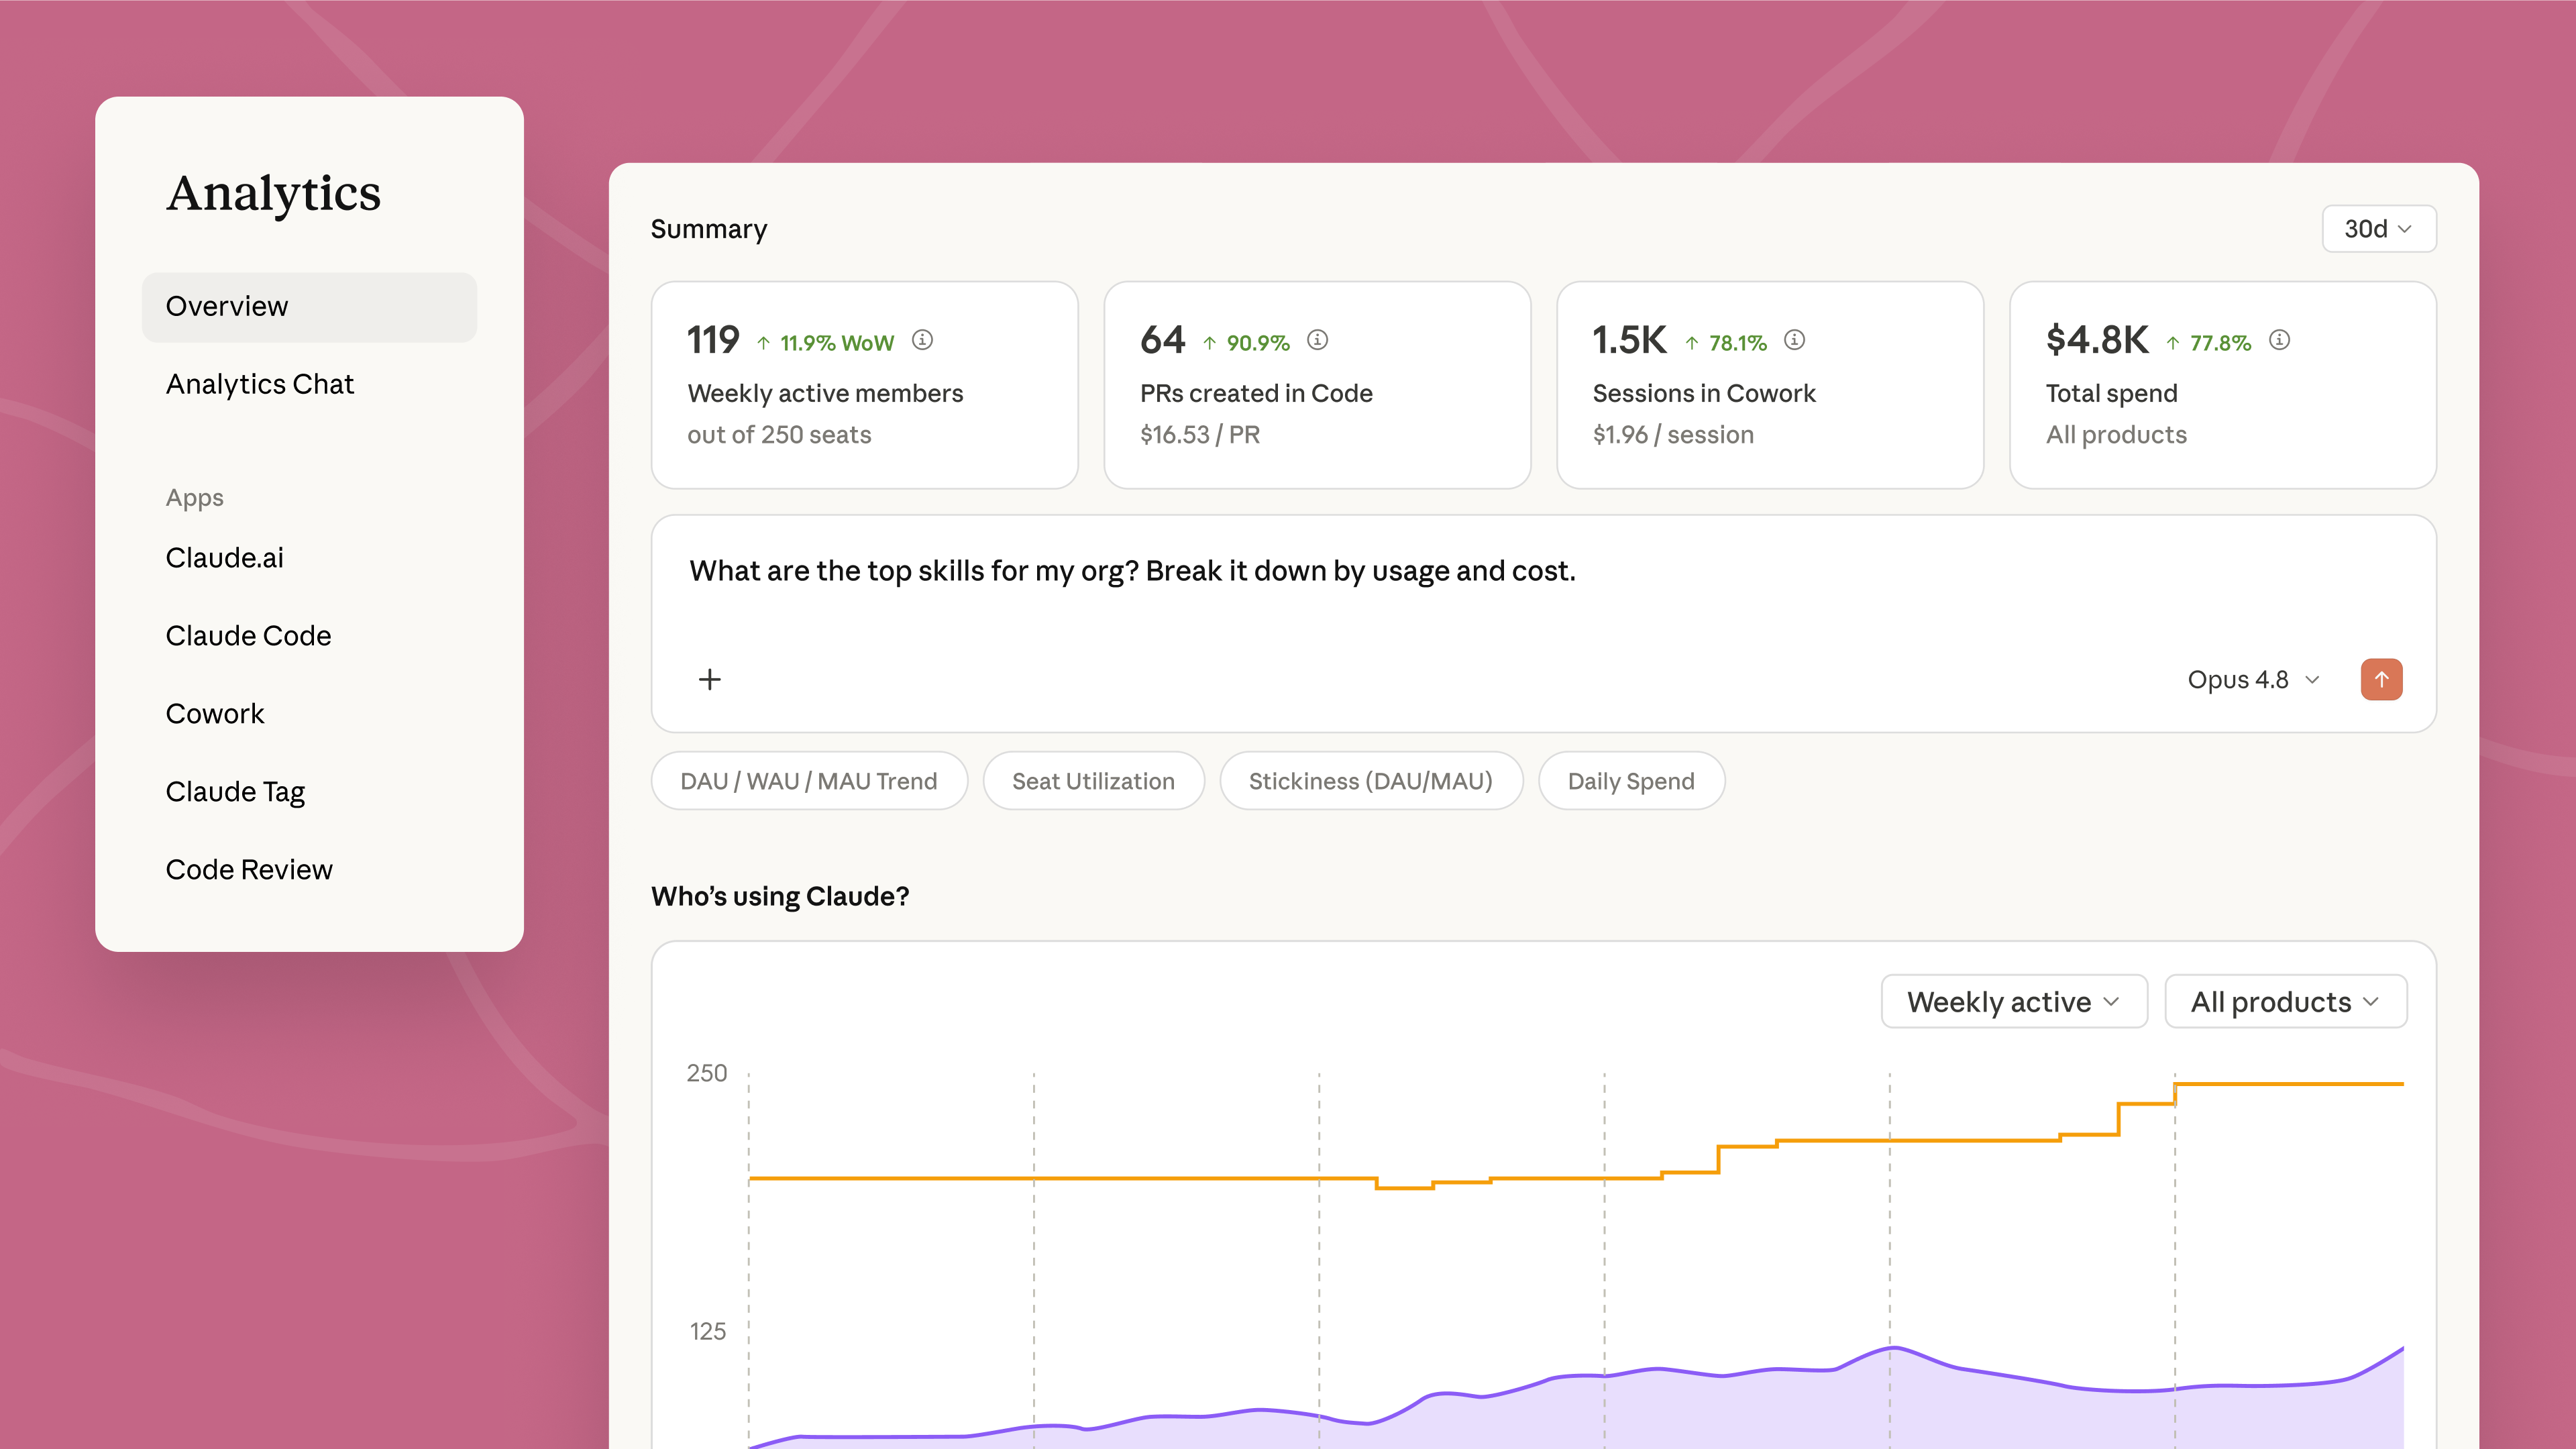
Track adoption and cost
The analytics dashboard for admins now shows usage and cost by group and by user, with output like artifacts created, files edited, skills and connectors used displayed directly next to their cost. Admins can filter by the SCIM groups their IT team already manages, so the breakdown follows their existing org chart.
Claude Code gets richer insights with two new tabs focused on value and usage inside the admin console. Usage shows active developers, session counts, and top commands across the org, and is updated daily. The value tab summarizes usage and cost data to help admins understand value of Claude Code at a glance, estimating productivity lift, cost per commit, and annual value. Every formula is visible in the tab, and the inputs are adjustable.
Analytics chat can now answer a much broader set of questions and produce richer artifacts that you can dive deeper into. Admins can ask questions in plain language — "Which teams doubled their Claude usage this month?" or "Where are we getting the most value per seat?" — and Claude returns charts that can be exported and shared with stakeholders.
Usage and cost data is available programmatically through the Analytics API, so finance and IT can bring Claude usage and cost data into the tools they already run — like Datadog Cloud Cost Management and CloudZero — and see it alongside the rest of their cloud and AI spend. Results can be filtered by date range, team, product, or model. Skills report their own usage and cost, and new endpoints track plugin adoption and artifact creation.
Admins can extend usage visibility to individual users — cost, product and model breakdowns, and progress against spend limits — so no one hits a surprise cutoff. Users can also see their own usage trends over time, including which products, models, and skills they rely on most, and how that activity adds up in spend.
Controls for managing spend
Model defaults and entitlements let admins set which Claude model new conversations start with across chat, Cowork, and Claude Code so routine work doesn't necessarily default to the most expensive option. Admins control which models are available to specific roles or across the entire organization.
Spend-threshold alerts notify admins at 75% and 90% of an org-level spend limit, giving them time to raise the cap before anyone gets blocked mid-task. Users receive in-app notifications at 75% and 95% thresholds and can request a limit increase directly from their admin without leaving Claude.
For organizations managing limits across many groups, the Admin API moves cost-control workflows into scripts so controls scale with the org. Automate increase-request reviews, identify members close to their spend limit, and flag rapidly changing usage all at scale.
eBook

Getting started
For admins managing Claude across their organization: explore usage and cost breakdowns in the admin console, set model defaults and spend limits by group, and configure spend-threshold alerts to stay ahead of overages. Usage data is available in the admin dashboard, and the Analytics API lets finance and IT pull the same metrics into existing reporting systems, learn more here.
No items found.
関連記事
今日のまとめ
AI日報で今日の重要ニュースをまとめ読み