Claude Enterprise に新分析機能とコスト管理が追加されました
本文の状態
日本語全文を表示中
詳細モードで約5分の本文を読めます。
同じ出来事の情報源
この情報源を基点に整理
TLDR AI
Anthropic は Claude Enterprise の利用者が、サービスの使用状況を詳細に分析し、コストを厳格に制御できる新機能を公開しました。
Source Article
元記事を日本語で読む
本文に関係しない購読案内、埋め込み通知、サイト内プロモーションは除いています。
Claude Enterprise に対して、より詳細な管理者分析機能、モデルレベルの権限管理、および支出アラート機能を導入します。組織内で Claude が次第に困難で複雑なエージェントワークを引き受けるにつれ、利用状況やコストのパターンは標準的なチャットツールとは異なるものになります。これらの制御機能により、管理者は Claude の使用方法を把握し、コストを管理するためのツールを手に入れることができます。
今回の追加機能は、Anthropic がすでに提供している制御機能を基盤としています:あらゆるレベルでの支出上限、アクセスとモデルルーティング、エクスポート機能付きの分析ダッシュボードおよび Analytics API、そして作業量制御です。より詳細な分析機能とより細粒度のコスト制御は、数ヶ月にわたって構築してきた制御インターフェースへの最新追加となります。
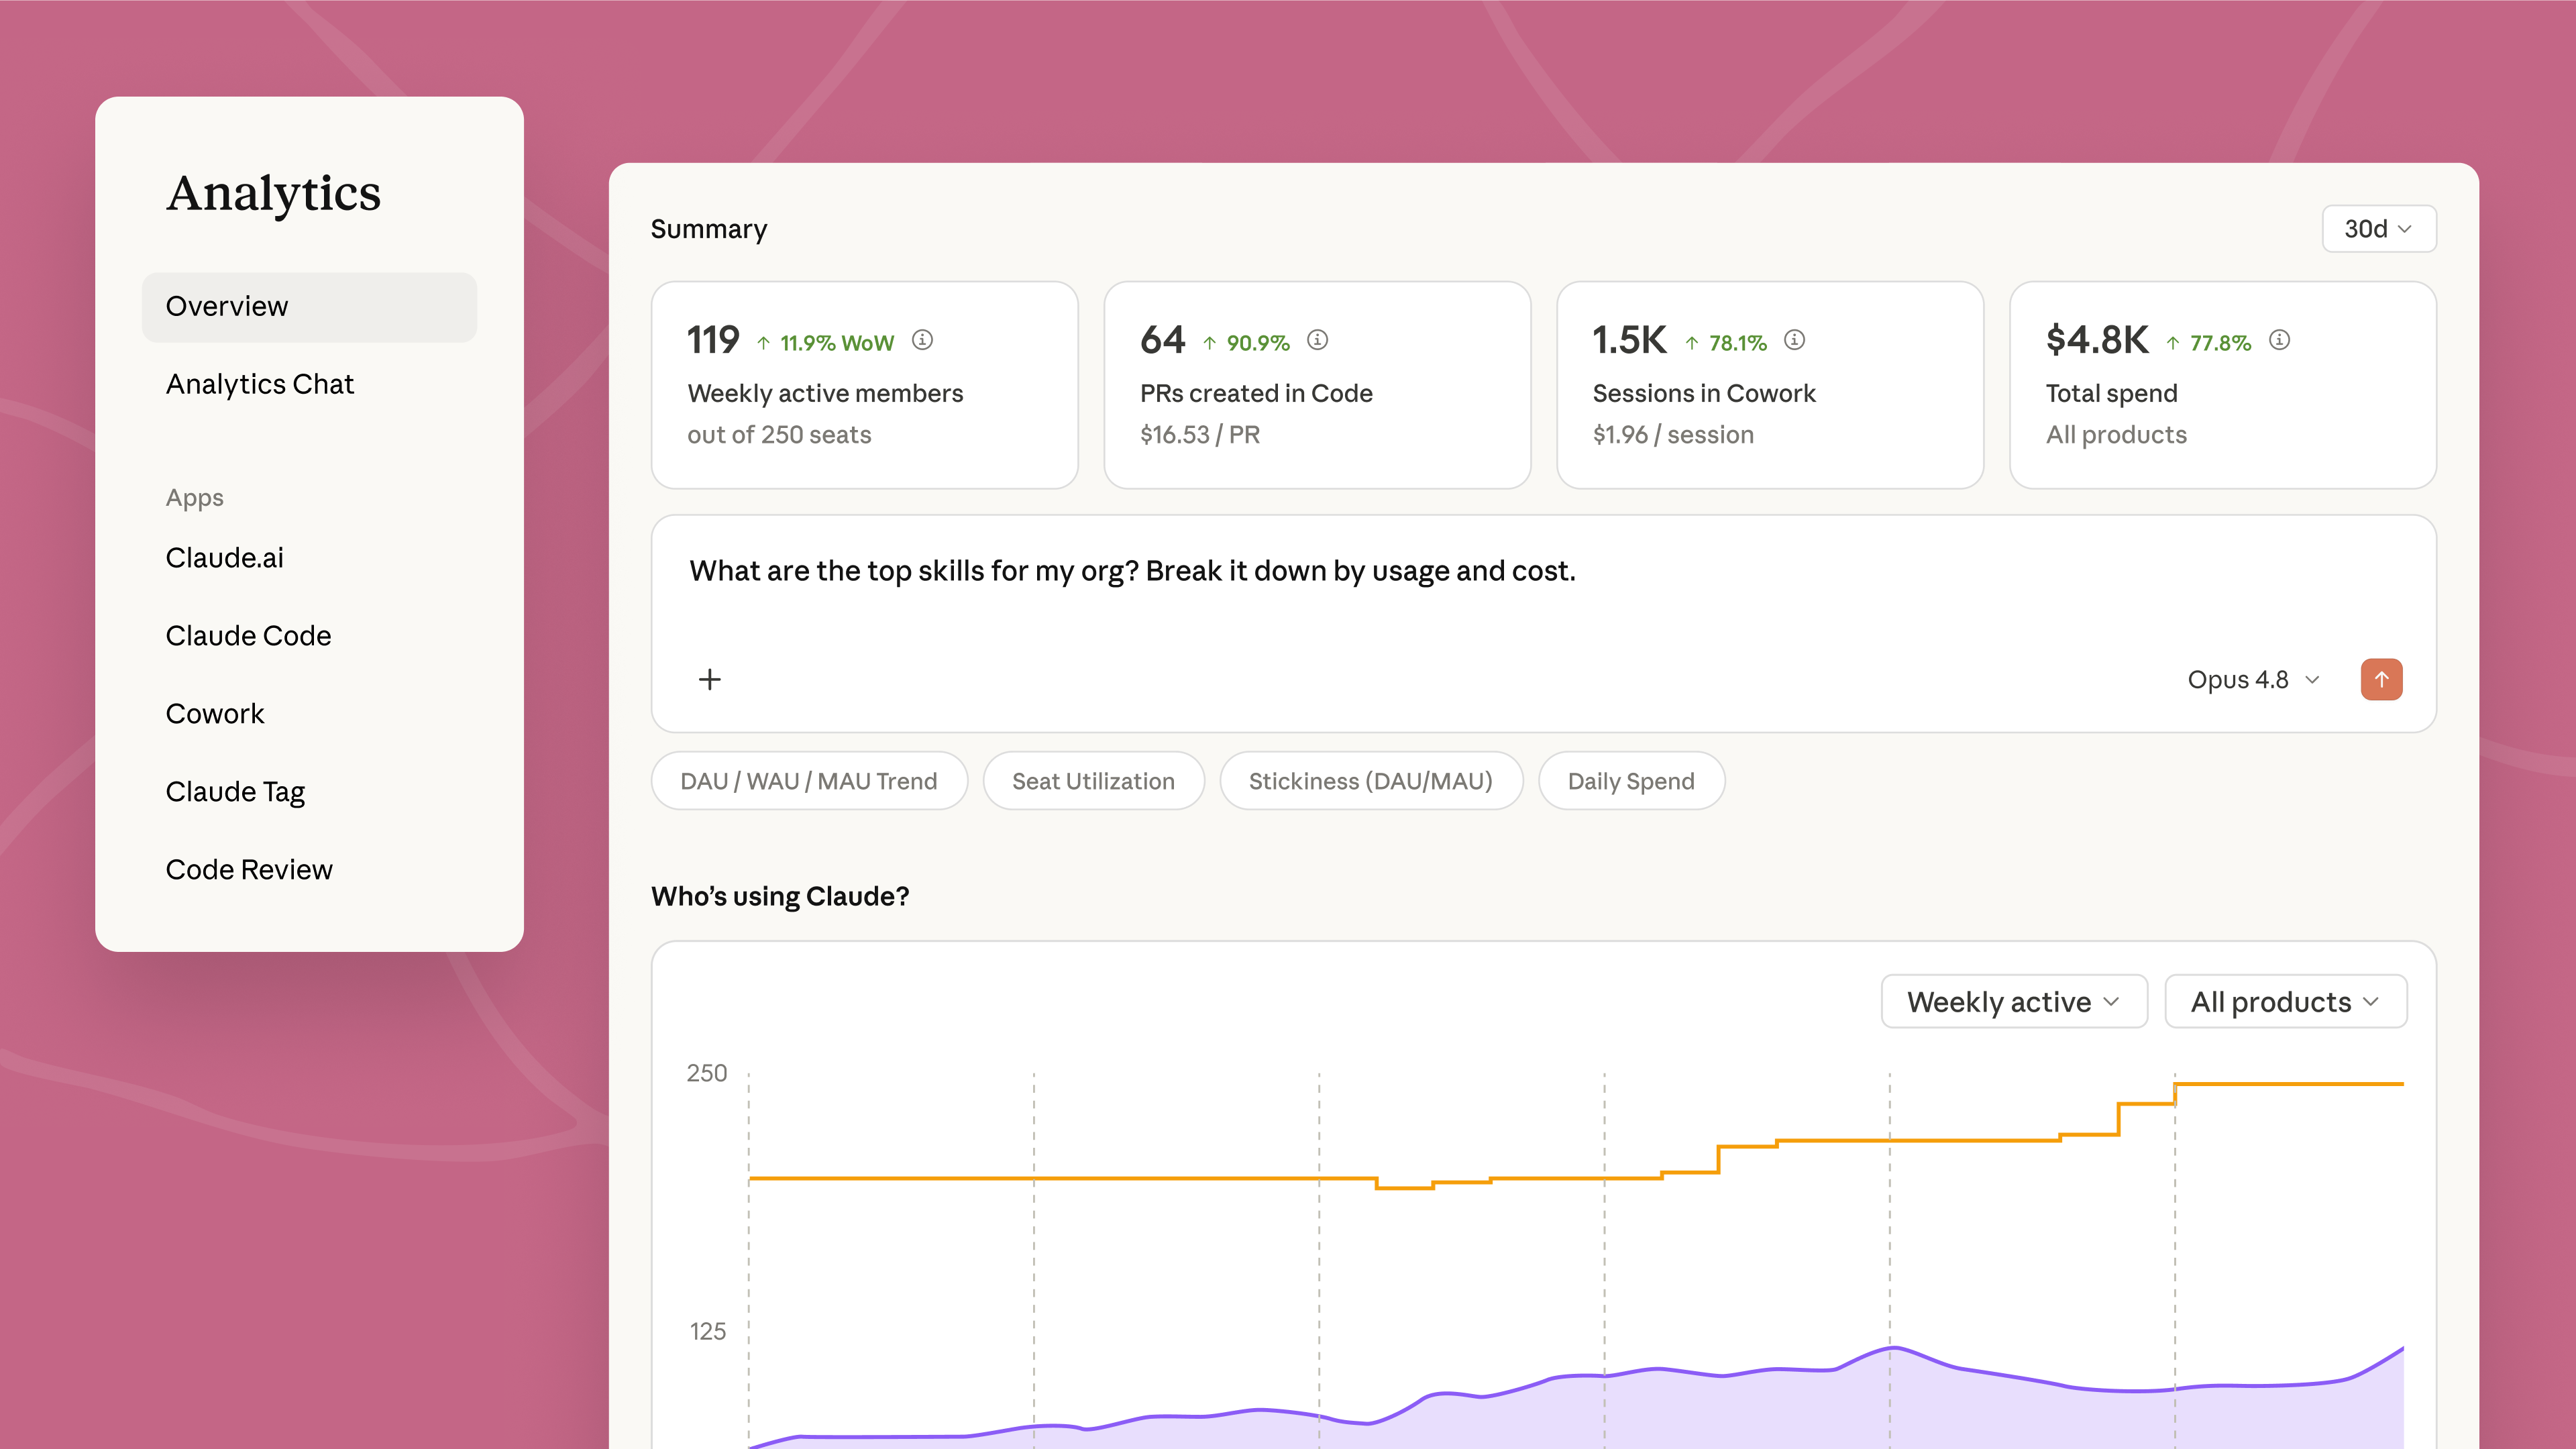
採用状況とコストの追跡
管理者向けの 分析ダッシュボード では、グループ別およびユーザー別の利用状況とコストが表示され、生成されたアーティファクト、編集されたファイル、使用されたスキルやコネクタがそのコストと共に直接表示されます。管理者は IT チームがすでに管理している SCIM グループでフィルタリングできるため、内訳は既存の組織図に沿ったものになります。
Claude Code は、管理コンソール内で価値と利用状況に焦点を当てた 2 つの新しいタブにより、より豊富なインサイトを提供します。利用状況タブでは、組織全体のアクティブな開発者数、セッション数、主要コマンドが示され、毎日更新されます。価値タブは、Claude Code の価値を一瞥で把握できるよう、利用状況とコストデータを要約し、生産性向上の推定値、コミットあたりのコスト、年間価値を算出します。各計算式はこのタブ内で確認可能であり、入力値も調整可能です。
Analytics chat は、より広範な質問に応え、さらに深く掘り下げられる豊富な成果物を生成できるようになりました。管理者は自然言語で質問を行うことができ、「今月 Claude の利用を倍増させたチームはどこか?」や「1 席あたりの価値が最も高いのはどこか?」といった問いに対し、Claude はエクスポート可能でステークホルダーと共有できるチャートを返します。
利用状況およびコストデータは、Analytics API を通じてプログラム的にアクセス可能です。これにより、財務部門や IT 部門は、Claude の利用状況とコストデータを、Datadog Cloud Cost Management や CloudZero など既に運用しているツールに取り込み、クラウド支出および AI 関連支出の他の項目と共に確認できます。結果は日付範囲、チーム、製品、またはモデルでフィルタリング可能です。スキル自体が利用状況とコストを報告し、新しいエンドポイントではプラグインの採用状況や成果物の作成を追跡します。
管理者は、個々のユーザーに対して使用状況の可視性を拡張できます。これにはコスト、製品およびモデルの詳細な内訳、支出制限に対する進捗状況が含まれ、予期せぬ利用停止を防止します。ユーザーもまた、時間経過に伴う自身の使用傾向を確認でき、どの製品・モデル・スキルを最も多く利用しているか、そしてその活動がどのように支出に積み重なっているかを把握できます。
支出管理のためのコントロール機能
モデルのデフォルト設定と権限により、管理者はチャット、Cowork、Claude Code のすべての新しい会話でどの Claude モデルが初期設定として使用されるかを指定できます。これにより、日常的な作業が必ずしも最も高価なオプションにデフォルト設定されることを防ぎます。管理者は、特定のロールや組織全体に対して利用可能なモデルを制御します。
支出閾値アラート機能は、組織レベルの支出制限の 75% および 90% に達した際に管理者に通知し、誰かがタスク中にブロックされる前に上限を引き上げる時間を確保します。ユーザーには、75% と 95% の閾値でアプリ内通知が送信され、Claude を離れることなく直接管理者に対して制限の引き上げをリクエストできます。
多数のグループにわたって制限を管理する組織向けに、Admin API を利用することで、コスト制御ワークフローをスクリプトに移行し、組織規模に合わせてコントロールを拡張できます。制限引き上げリクエストの審査自動化、支出制限に近づいているメンバーの特定、急激に変化する使用状況のフラグ付けなど、大規模な運用を一度に行うことが可能です。
eBook
 imageimage
始め方
組織全体で Claude を管理する管理者向けに、管理コンソールで利用状況とコストの内訳を確認したり、グループごとにモデルのデフォルト設定や支出制限を設定したり、超過防止のために支出しきい値アラートを構成したりできます。利用データは管理ダッシュボードで確認可能であり、Analytics API(分析 API)を利用すれば、財務部門や IT 部門が既存の報告システムに同じメトリクスを取り込むことができます。詳しくは こちら をご覧ください。
見つかった項目はありません。
原文を表示
We’re introducing richer admin analytics, model-level entitlements, and spend alerts for Claude Enterprise. As Claude takes on increasingly difficult and complex agentic work across the organization, usage and cost patterns look different from a standard chat tool. These controls give admins the visibility to understand how Claude is being used and the tools to manage costs.
Today's additions build on controls Anthropic already provides: spend caps at every level, access and model routing, a usage analytics dashboard with exports and an Analytics API, and effort controls. Richer analytics and more granular cost controls are the newest additions to a control surface we've been building on for months.
Track adoption and cost
The analytics dashboard for admins now shows usage and cost by group and by user, with output like artifacts created, files edited, skills and connectors used displayed directly next to their cost. Admins can filter by the SCIM groups their IT team already manages, so the breakdown follows their existing org chart.
Claude Code gets richer insights with two new tabs focused on value and usage inside the admin console. Usage shows active developers, session counts, and top commands across the org, and is updated daily. The value tab summarizes usage and cost data to help admins understand value of Claude Code at a glance, estimating productivity lift, cost per commit, and annual value. Every formula is visible in the tab, and the inputs are adjustable.
Analytics chat can now answer a much broader set of questions and produce richer artifacts that you can dive deeper into. Admins can ask questions in plain language — "Which teams doubled their Claude usage this month?" or "Where are we getting the most value per seat?" — and Claude returns charts that can be exported and shared with stakeholders.
Usage and cost data is available programmatically through the Analytics API, so finance and IT can bring Claude usage and cost data into the tools they already run — like Datadog Cloud Cost Management and CloudZero — and see it alongside the rest of their cloud and AI spend. Results can be filtered by date range, team, product, or model. Skills report their own usage and cost, and new endpoints track plugin adoption and artifact creation.
Admins can extend usage visibility to individual users — cost, product and model breakdowns, and progress against spend limits — so no one hits a surprise cutoff. Users can also see their own usage trends over time, including which products, models, and skills they rely on most, and how that activity adds up in spend.
Controls for managing spend
Model defaults and entitlements let admins set which Claude model new conversations start with across chat, Cowork, and Claude Code so routine work doesn't necessarily default to the most expensive option. Admins control which models are available to specific roles or across the entire organization.
Spend-threshold alerts notify admins at 75% and 90% of an org-level spend limit, giving them time to raise the cap before anyone gets blocked mid-task. Users receive in-app notifications at 75% and 95% thresholds and can request a limit increase directly from their admin without leaving Claude.
For organizations managing limits across many groups, the Admin API moves cost-control workflows into scripts so controls scale with the org. Automate increase-request reviews, identify members close to their spend limit, and flag rapidly changing usage all at scale.
eBook
Getting started
For admins managing Claude across their organization: explore usage and cost breakdowns in the admin console, set model defaults and spend limits by group, and configure spend-threshold alerts to stay ahead of overages. Usage data is available in the admin dashboard, and the Analytics API lets finance and IT pull the same metrics into existing reporting systems, learn more here.
No items found.
関連記事
今日のまとめ
AIデイリーブリーフで今日の重要ニュースをまとめ読み