AWS Nate Slater、AI エージェント観測に推論層の必要性を指摘
本文の状態
日本語全文を表示中
詳細モードで約17分の本文を読めます。
同じ出来事の情報源
この情報源を基点に整理
Arize AI Blog
AWS の Nate Slater は、AI エージェントの複雑な動作を解析するためには従来の監視ツールでは不十分であり、推論層を組み合わせた新しい観測手法が必要であると指摘した。
AI深層分析を開く2026年8月7日 02:03
AI深層分析
キーポイント
エージェントシステムの複雑性の増大
従来の分散システムとは異なり、プロンプトやメモリ操作など多数のレイヤーが絡み合うため、単一の失敗原因を特定するのが極めて困難になっている。
推論層による観測の転換
生成された大量のトレースデータを人間が解析するのではなく、AI エージェント技術自体を用いてデータの意味や因果関係を推論させるアプローチが提案されている。
従来の APM の限界
同じ入力でも実行パスや結果が変化するエージェントでは、時間のかかった場所を特定するだけの従来型監視では根本的な問題解決ができない。
複合エラーと時間的ドリフトのリスク
多段階システムでは各ステップの成功率が積算されるため、長い軌道ほど失敗確率が増大する。また、メモリやコンテキストの変化はコード変更なしに未来の動作を改変し、再現性を困難にする。
従来の観測データの限界
収集されたデータ自体が自己説明できないため、人間が仮説を立てて因果関係を特定する必要がある。エージェントは確率的な意思決定層を持つため、分散システムよりも状態の追跡が複雑になる。
重要な引用
It will get harder.
We can use the same AI agentic technology that's creating this explosion of trace data to actually reason about the traces themselves
Developers need more than a record of what ran. They need a layer that can reconstruct intent, investigate causality, and explain why a system behaved the way it did.
"The data that you collect doesn't explain anything about itself."
Source Article
元記事を日本語で読む
本文に関係しない購読案内、埋め込み通知、サイト内プロモーションは除いています。
本記事は、AWS のスタートアップ SA リーダーであるネイト・スレーター氏が Arize Observe 2026 で行った基調講演を踏まえたものです。
かつて分散システムの「悪魔」と恐れられていたフレイムグラフが、今では少し古風な存在に見えるようになってきました。
スレーター氏が好んで例に挙げるケースには、40〜50 レイヤーにも及ぶスパンの連鎖があり、非同期のホップやデータベース呼び出し、そして土曜日のインシデントを宝探しゲームに変えてしまうほどのクロスサービス間のトラフィックが含まれています。さらに、エージェント型アプリケーションが加わると、もう一つの次元が現れます。プロンプト、モデルからの応答、取得されたコンテキスト、メモリ操作、ツール引数、MCP コール、そして場合によっては他のエージェントまで——これらすべてが、次回同じリクエストを実行する際に経路が変わりうる分岐点へと枝分かれしていきます。
Arize Observe 2026 の講演でスレーター氏は、「数百、あるいは数千のエージェントがバックエンドサービスを呼び出すようになれば、デバッグは楽になるのか?」と問いかけました。その答えは自明であり、彼自身も即座に答えています。「むしろ難しくなる」のです。
エージェントシステムは従来のアプリケーションよりも遥かに多くのテレメトリデータを生成する一方で、各トレースの解釈をより困難にしています。しかし、この複雑さを生み出した技術自体が、脱出への道筋を示唆しているのも事実です。
「この爆発的なトレースデータの生成を引き起こした AI エージェント技術そのものを使って、トレース自体について推論を行うことができます」とスレーター氏は述べています。
この逆転現象は、AI エージェントの可観測性の次の段階を指し示しています。開発者が必要としているのは、単に何を実行したかの記録だけではありません。意図の再構築、因果関係の調査、そしてシステムがそのように振る舞った理由の説明——これらを実現できるレイヤーが必要です。
AI エージェントの可観測性は、従来のデバッグとは異なる課題です
アプリケーションパフォーマンス監視(APM)は、一般的に反復可能な実行パスに従うソフトウェアを対象として設計されました。同じコード、状態、入力であれば、開発者は通常、同じ動作を再現でき、失敗したスパンを検査し、問題がどのサービスやクエリ、依存関係に向かっているかを追跡できます。しかし、AI エージェントはこの前提を崩します。
同じリクエストでも、エージェントは異なる計画を立て、異なる文脈を取得し、異なるツールを呼び出し、異なる引数を渡す可能性があります。一つの許容される回答に至るまでには複数の経路が存在するため、単に変化があったからといって失敗を意味するわけではありません。一方で、構造的に似ているように見える 2 つのトレースでも、ビジネス上の結果は劇的に異なることがあります。
APM が開発者に「時間がどこで消費されたか」を示すのに対し、AI エージェントの可観測性は「なぜその判断が行われたか」を再構築する必要があります。
それを実現するには、システムの複数の層からの証拠が必要です:
- モデルに提示された指示と文脈
- エージェントがたどった計画または経路
- 選択されたツールや他のエージェント
- 各ツールへ送信された引数
- 検索やメモリから返されたデータ
- その判断によってトリガーされた下流アプリケーションの動作
- 最終的な結果と、それに対して適用された評価
レイテンシの急増や HTTP 500 エラーは症状を特定できますが、それだけでは、エージェントが誤ったツールを選択したのか、無効な引数を生成したのか、古くなったメモリに依存していたのか、あるいは正しく呼び出したサービスが後で失敗したのかを説明することはできません。
なぜ本番環境の AI エージェントはデバッグが難しいのか?
エージェントの障害調査を特に困難にする要因として、4 つの特徴が挙げられます。
失敗モード | 何が変わるのか | 開発者が必要とする証拠
---|---|---
非決定性実行 | 同じリクエストを再生しても、計画やツール呼び出し、レスポンスが異なる結果になる | プロンプト、モデルと生成設定、取得されたコンテキスト、完全な軌跡(トラジェクトリー)、出力
エラーの連鎖 | エージェント、モデル、ツールの各ステップごとに、軌跡が失敗する機会が増える | エージェント間やツール、バックエンドサービスにまたがる意思決定を結びつける親子スパン
時間的ドリフト | 従来のコードデプロイなしでも、メモリの更新や変化するコンテキストが将来の動作を変化させる | バージョン管理されたプロンプト、メモリ状態、取得コンテキスト、ツールスキーマ、設定
スケールにおける信号の崩壊 | 稀だが深刻な障害が、数百万件の通常的なトラースの中に埋もれてしまう | インテント(意図)、リスク、結果、評価スコア、各トラースが保持された理由
エラーの連鎖は、多段階システムにおいて特に容赦ないものとなります。単純化された独立性の仮定の下では、全体の軌跡が成功する確率は、個々のステップの成功率の積に近似されます。
P(success) ≈ p₁ × p₂ × … × pₙ
5 つのステップそれぞれが 95% の確率で成功する場合、完全な軌跡が成功するのは約 77% の確率となります。実際のエージェントのステップは独立していることは稀ですが、この計算式はなぜ長い軌跡がより大きな障害表面(ファイルサーフェス)を生み出すのかを説明しています。
時間経過によるドリフトは、より微妙な問題を提起します。メモリを読み書きするエージェントは、ソースコードが変更されていない場合でも、その将来の動作を変化させる可能性があります。メモリーファイルへの新しいエントリ、異なる検索結果、あるいは変更されたツール説明などが、次の実行パスを方向づけてしまうのです。
したがって、インシデントの再現はサンプリングの問題となります。開発者は、行動の分布を特徴付けるための十分なトレースと、どのバリエーションが許容されるかを定義する評価が必要になります。
自分自身で説明できないテレメトリ
スレーター氏は、従来のデータ収集手法に対してあえて率直な表現を用いました。「ダミーな計測(dumb instrumentation)」です。
彼は計測そのものに反対しているわけではありません。メトリクス、ログ、トレースを出力するシステムは、何も出力しないシステムに比べれば、圧倒的に運用しやすいものです。彼の主張は、データ自体の限界に関するものでした。
「収集されたデータは、それ自身について何の説明もしてくれません」とスレーター氏は述べています。
従来の観測性プラットフォームは、テレメトリを保存・インデックス化し、クエリを実行します。しかしインシデント発生時には、依然として人間が仮説を立て、関連するデータを特定し、適切なクエリを作成し、2 つの事象に因果関係があるかどうかを判断する必要があります。
このプロセスは分散システムにおいてもすでに困難でした。そこにエージェントが加わると、プロンプト、メッセージ、ツール呼び出し、メモリ、検索結果、アプリケーションテレメトリなど across に散在する内部状態を持つ確率的な意思決定層が追加され、状況はさらに複雑化します。
知的な観測性レイヤーは、以下の 4 つの推論を支援すべきです:
因果関係の調査。システムは証拠を統合して順位付けされた仮説を構築し、単にインシデントの直近で変化した指標と、それが実際に原因となった可能性のある条件を区別する必要があります。
意図に基づく検知。システムは、エージェントが完了しようとしていたタスクに対してその軌跡を評価します。あるツールシーケンスは一つの意図では無害でも、別の意図では危険になり得ます。
適応的なベースライン。システムは、トラフィックやユーザーの意図、メモリ、システムの挙動の変化を考慮し、静的な平均値からのあらゆる逸脱を自動的にインシデントとして扱うべきではありません。
階層的な観測。専門化されたエージェントが他のエージェントの動作とテレメトリを検査することで、エージェント群の規模拡大に合わせて調査能力も拡張できます。
この推論層は開発者のアプローチそのものを変えます。ダッシュボードから始めて「どのクエリを実行すべきか」を推測するのではなく、エンジニアはインシデント自体から始められます。「何が失敗したのか」「影響を受けた軌跡はどれか」「何が変わったのか」「提案された原因を支える証拠は何か」。これらを即座に確認できます。
Amazon Bedrock AgentCore と Arize AX の連携について
エージェント向けのプロダクション環境における観測アーキテクチャには、実行、テレメトリ、推論、改善の各機能を担う明確な層が必要です。
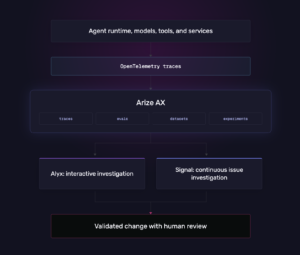
Amazon Bedrock AgentCore は、ランタイムやメモリ、ゲートウェイ、ID 管理、観測性(observability)、ブラウザ機能、コードインタプリタなどを含む、本番環境で動作するエージェントのためのコンポーザブルなインフラストラクチャを提供します。AgentCore は OpenTelemetry に準拠したテレメトリを出力するため、エージェントの実行データを既存の監視・観測スタックへスムーズに流し込むことができます。
Arize AX は、その実行記録を解釈するために必要な AI エンジニアリングの文脈を追加します。トレースはアプリケーションが何をしたかを捉え、評価(evaluations)はその行動の質を測定します。さらにデータセットと実験機能により、チームは提案された変更がシステムを改善する一方で回帰(regressions)を引き起こさないかどうかを構造化された方法でテストできるようになります。
Arize AX に組み込まれた AI エンジニアリングエージェント「Alyx」は、トレース、プロンプト、データセット、評価にわたる対話型分析をサポートします。Signal は本番環境のトレースを継続的に調査し、問題点をランク付けして裏付けとなる証拠を添付します。リポジトリと接続されている場合、調査結果に基づいて提案された修正内容をレビューへ引き渡すことも可能です。
これらコンポーネントを組み合わせることで、開発者が管理すべき課題が明確に分離されます。ランタイムは実行のための制御された環境を提供し、テレメトリは証拠を保存し、そして推論層(reasoning layer)がその結果として生じた行動を解釈します。
コーディングエージェントがループの前半を自動化した
スレーター氏はコーディングエージェントと十分な時間を過ごしているため、講演中に冗談めかして「妻が、私と『Claude』という名前の誰かと不倫していると疑うかもしれないと心配した」と語りました。コード生成は多くの開発者にとって日常の一部となっています。エージェントは、人間のエンジニアがチケットを読み終える前に、サービスのスケルトン作成、テスト記述、モジュールのリファクタリング、そして見知らぬリポジトリの説明まで行います。
しかし、ソフトウェアライフサイクルの残りの部分は、同じ速度で加速していません。スレーター氏は、コンテナを構築し、環境にプッシュし、ログを検索し、エラーメッセージを Claude Code にコピーしてエージェントにもう一度試させるというプロセスを説明しました。このワークフローが成功するのは、開発者が関連するログの場所や重要なメッセージをすでに知っているからです。しかし、システムがスケールするにつれて、この知識がボトルネックとなります。
企業が数百、あるいは数千のエージェントを運用している場合、開発者がすべての呼び出しを手動で検査したり、どのトレースに注力すべきかを判断したりすることはできません。観測用エージェントは、生産環境のデータから始めて、関連する障害をクラスタリングし、代表的なトレースを特定し、根本原因に関する仮説を立て、評価データセットとして扱うべきケースを選択できます。
コーディングエージェントは、貼り付けられたエラーメッセージではなく、証拠に基づいて作業を開始できるようになります。これにより、生成と運用の間の重要なギャップが埋まります。コード生成がループを開始するかもしれませんが、コードが実際に機能したかどうかを決定するのは生産環境からのトレースです。
真のリスクは影響範囲(ブラスト・レイディアス)にあります
開発者のノートパソコン上で動作するエージェントは、影響力の範囲が限定的です。しかし、これらが永続的なクラウド環境に移り、本番用の認証情報を取得し、内部 API を呼び出し、CI/CD システムの修正を始めた瞬間には、全く異なる運用上の問題へと変化します。その時点で、観測機能(observability)は制御面の一部となります。
企業が必要とするのは、どのエージェントが行動したのか、どのような指示と文脈がその行動を導いたのか、どのツールを呼び出したのか、どのデータが変更されたのか、そして結果が意図するポリシーやビジネス成果を満たしていたのかを説明する証拠の痕跡です。
自律システムを非難しても、根本的な責任所在の問題は解決しません。スレーターが指摘したように、規制当局に対して「事故の原因はエージェントのせいだ」と言うのは、AI における「犬が宿題を食べました」という言い訳に等しいのです。
被害範囲(blast radius)が大きくなるほど、解釈可能な痕跡を保存し、重要な変更には人間の承認プロセスを設けることが重要になります。観測を行うエージェントは調査と修復案の提案を行えますが、本番リリース前にエンジニアが結論を検証できるのは、基盤となる証拠があるからです。
開発者がエージェント群のスケーリング前に実装すべき観測機能
有用な AI エージェントの観測戦略は、本番トラフィックが流入する前から始まります。
すべての実行軌跡を記録する。モデル呼び出し、情報検索、メモリ操作、ツール呼び出し、エージェント間メッセージ、そして下流サービスのスパンを、共通のトレースとして統合して捉える。プロンプトやツールのペイロードに機密情報が含まれる可能性がある箇所では、必ず情報の隠蔽とアクセス制御を適用する。
すべての意思決定の入力をバージョン管理する。各実行に関連するシステムプロンプト、モデル設定、ツールスキーマ、検索ソース、メモリ状態、ポリシー、そしてアプリケーションのバージョンを記録すること。これらのバージョン情報を欠くと、過去の挙動を再現できなくなる恐れがある。
意図と結果を紐付ける。インフラストラクチャのメトリクスはリクエストが完了したかどうかを示すが、「意図」と「結果」フィールドは、正しいタスクが完了したかどうかを教えてくれる。タスクのカテゴリ、期待される結果、最終状態、そして関連する評価スコアを含めるべきだ。
リスクに応じてサンプリングを行う。均一なサンプリングでは、最も重要な稀な軌跡を見逃してしまう可能性がある。機密性の高いツールやポリシー決定、異常に長いループ、異常なコスト、繰り返されるリトライ、あるいは高価値のビジネスアクションに関わるトレースは必ず保持する。
本番環境での障害を評価データに変換する。インシデントの原因が理解できたら、その代表例をデータセットに追加し、期待される挙動として評価ルールを定義する。こうして作成された回帰テストスイムは、同じ種類の障害が再発することを防ぐのに役立つ。
調査の監査可能性を維持しよう。観測エージェントが根本原因やコード変更を提案する際、その結論を支えるトレース、クエリ、評価、仮定はすべて記録として残す必要がある。証拠を示さずに自信だけを主張するのではなく、根拠となるデータを提供することで、人間のレビューははるかに有用なものになる。
エージェント観測から自己改善システムへ
より大きな可能性は、単にインシデント対応を速めることにはとどまらない。生産環境の挙動が解釈され、クラスタリングされ、評価され、実験と結びつけられるようになれば、観測技術はエージェントによる改善ループへの入り口となる。障害が発生すれば証拠が生まれ、その証拠がデータセットとなり、データセットが評価を駆動し、評価が提案された変更を検証する。そして検証済みの変更は、人間のレビューを経た上で再び本番環境へ戻される。
このループによって、トレースは単なる受動的な記録から開発への入力へと変化する。エージェントの普及により、生産システムの理解はより困難になるだろう。しかし一方で、開発者が完全なテレメトリデータ、意味のある評価指標、そして改善ワークフローに対する制御されたアクセス権を与えさえすれば、その理解を助けるシステムも実現可能となる。
フレイムグラフがより濃密になっていく中で、問われるべきは「エンジニアが土曜の夜にそれを見つめ続ける前に、観測スタックがそれを説明できるか」という点だ。
この記事「AI agent observability: Why production systems need a reasoning layer」は、Arize AI で最初に公開されました。
原文を表示
This post builds on a talk from Arize Observe 2026 given by Nate Slater, Startup SA Leader at AWS.
The flame graph, once the bogeyman of distributed systems, is starting to look almost quaint.
Nate Slater’s favorite example contains 40 or 50 layers of spans, with asynchronous hops, database calls, and enough cross-service traffic to turn a Saturday incident into a scavenger hunt. An agentic application adds another dimension: prompts, model responses, retrieved context, memory operations, tool arguments, MCP calls, and sometimes other agents, all branching through a path that may change the next time the same request runs.
During his talk at Arize Observe 2026, Slater asked whether hundreds or thousands of agents calling backend services would make debugging easier. The answer was obvious enough that he supplied it himself: It will get harder.
Agent systems produce more telemetry than traditional applications while making each trace more difficult to interpret. Yet the same technology responsible for this complexity offers a possible escape route.
“We can use the same AI agentic technology that’s creating this explosion of trace data to actually reason about the traces themselves,” Slater said.
That inversion points toward the next stage of AI agent observability. Developers need more than a record of what ran. They need a layer that can reconstruct intent, investigate causality, and explain why a system behaved the way it did.
Why AI agent observability is a different debugging problem
Application performance monitoring was designed around software that generally follows repeatable execution paths. Given the same code, state, and input, developers can usually reproduce the same behavior, inspect the failing span, and trace the problem toward a service, query, or dependency. Agents weaken that assumption.
The same request can produce a different plan, retrieve different context, call a different tool, or pass different arguments. An agent might reach an acceptable answer through several trajectories, which means that variation alone does not indicate a failure. Meanwhile, two traces that appear structurally similar may produce dramatically different business outcomes.
Where APM tells developers where time went, AI agent observability must also reconstruct why a decision occurred.
That requires evidence from several layers of the system:
Instructions and context presented to the model
Plan or trajectory the agent followed
Tools and other agents it selected
Arguments sent to each tool
Data returned from retrieval and memory
Downstream application behavior triggered by those decisions
Final outcome and the evaluations applied to it
A latency spike or HTTP 500 can identify a symptom. It cannot, on its own, explain whether the agent selected the wrong tool, generated an invalid argument, relied on stale memory, or correctly called a service that later failed.
What makes production AI agents harder to debug?
Four characteristics make agent failures especially difficult to investigate.
Failure mode
What changes
Evidence developers need
Nondeterministic execution
Replaying the same request can produce a different plan, tool call, or response.
Prompts, model and generation settings, retrieved context, complete trajectories, and outputs
Compounding error
Every agent, model, and tool hop adds another opportunity for the trajectory to fail.
Parent-child spans that connect decisions across agents, tools, and backend services
Temporal drift
Memory updates and changing context can alter future behavior without a conventional code deployment.
Versioned prompts, memory state, retrieval context, tool schemas, and configuration
Signal collapse at scale
Rare but serious failures can disappear inside millions of otherwise ordinary traces.
Intent, risk, outcome, evaluation scores, and the reason each trace was retained
Compounding error becomes particularly unforgiving in multi-step systems. Under a simplified independence assumption, the probability that an entire trajectory succeeds is approximately the product of its individual step-success rates:
P(success) ≈ p₁ × p₂ × … × pₙ
When five steps each succeed 95 percent of the time, the complete trajectory succeeds roughly 77 percent of the time. Real agent steps are rarely independent, although the calculation illustrates why longer trajectories create a much larger failure surface.
Temporal drift introduces a subtler problem. An agent that reads and writes memory can change its future behavior even when its source code remains untouched. A new entry in a memory file, a different retrieval result, or an altered tool description can redirect the next execution path.
Reproducing an incident therefore becomes a sampling problem. Developers need enough traces to characterize the distribution of behavior, along with evaluations that define which variations remain acceptable.
Telemetry that cannot explain itself
Slater used a deliberately blunt phrase for conventional data collection: “dumb instrumentation.”
He was not arguing against instrumentation. A system that emits metrics, logs, and traces is vastly easier to operate than one that emits nothing. His point concerned the limits of the data itself.
“The data that you collect doesn’t explain anything about itself,” Slater said.
Traditional observability platforms store, index, and query telemetry. During an incident, a human still needs to form a hypothesis, identify the relevant data, write the right query, and decide whether two events have a causal relationship.
That process was already difficult in distributed systems. Agents add a probabilistic decision layer whose internal state is scattered across prompts, messages, tool calls, memory, retrieval, and application telemetry.
An intelligent observability layer should help with four forms of reasoning:
Causal investigation. The system should assemble evidence into ranked hypotheses, distinguishing a metric that merely changed near an incident from a condition that plausibly caused it.
Intent-aware detection. The system should judge a trajectory against the task the agent was attempting to complete. An unusual tool sequence may be harmless for one intent and dangerous for another.
Adaptive baselines. The system should account for changes in traffic, user intent, memory, and system behavior rather than treating every deviation from a static average as an incident.
Hierarchical observation. Specialized agents should inspect the behavior and telemetry of other agents, allowing investigation capacity to scale alongside the agent fleet.
This reasoning layer changes the developer’s starting point. Instead of beginning with a dashboard and guessing which query to run, an engineer can begin with the incident: What failed? Which trajectories were affected? What changed? Which evidence supports the proposed cause?
How Amazon Bedrock AgentCore and Arize AX fit together
A production observability architecture for agents needs distinct layers for execution, telemetry, reasoning, and improvement.
Amazon Bedrock AgentCore provides composable infrastructure for running production agents, including runtime, memory, gateway, identity, observability, browser, and code-interpreter capabilities. AgentCore emits OpenTelemetry-compatible telemetry, allowing agent execution data to flow into an existing monitoring and observability stack.
Arize AX adds the AI engineering context needed to interpret that execution record. Traces capture what the application did, while evaluations measure the quality of the behavior. Datasets and experiments then give teams a structured way to test whether a proposed change improves the system without introducing regressions.
Alyx, the AI engineering agent built into Arize AX, supports interactive analysis across traces, prompts, datasets, and evaluations. Signal continuously investigates production traces, ranks issues, and attaches supporting evidence; when connected to a repository, it can also carry an investigation toward a proposed fix for review.
Together, these components separate the concerns developers need to manage. The runtime provides a controlled environment for execution, the telemetry preserves the evidence, and the reasoning layer interprets the resulting behavior.
Coding agents have automated the beginning of the loop
Slater spends enough time with coding agents that, as he joked during the talk, “I was worried my wife was going to think I was having an affair with somebody named Claude.” Code generation has become ambient for many developers. An agent can scaffold a service, write tests, refactor a module, and explain an unfamiliar repository before a human engineer has finished reading the ticket.
The rest of the software lifecycle has not accelerated at the same rate. Slater described building containers, pushing them into an environment, searching through logs, copying an error back into Claude Code, and asking the agent to try again. The workflow succeeds because the developer already knows where the relevant logs live and which messages matter. That knowledge becomes a bottleneck as the system scales.
When an enterprise runs hundreds or thousands of agents, developers cannot manually inspect every invocation or decide which trace deserves attention. An observing agent can begin with the production data, cluster related failures, identify representative traces, form a root-cause hypothesis, and select the cases that should become an evaluation dataset.
The coding agent can then work from evidence rather than a pasted error message. This then closes a critical gap between generation and operation. Code generation may initiate the loop, although production traces determine whether the code actually worked.
The real risk is blast radius
Ten agents running on a developer’s laptop have a limited sphere of influence. The same agents become a different operational problem once they move into a persistent cloud environment, receive production credentials, call internal APIs, or begin modifying CI/CD systems. At that point, observability becomes part of the control surface.
Enterprises need an evidence trail that explains which agent acted, which instructions and context informed the action, which tools it invoked, which data changed, and whether the result satisfied the intended policy and business outcome.
Blaming an autonomous system will not resolve the underlying accountability problem. As Slater put it, telling a regulator that an incident was the agent’s fault amounts to “the dog ate my homework” for AI.
The larger the blast radius, the more important it becomes to preserve interpretable traces and place human approval around consequential changes. An observing agent can investigate and propose a remediation, while the underlying evidence allows an engineer to verify the conclusion before anything ships.
What developers should instrument before their agent fleet scales
A useful AI agent observability strategy begins before production traffic arrives.
Capture the entire trajectory. Connect model calls, retrieval, memory, tool invocations, agent-to-agent messages, and downstream service spans under a shared trace. Apply redaction and access controls wherever prompts or tool payloads may contain sensitive information.
Version every decision input. Record the system prompt, model configuration, tool schema, retrieval source, memory state, policy, and application version associated with each execution. Without those versions, reproducing historical behavior may be impossible.
Attach intent and outcome. Infrastructure metrics reveal whether a request completed, while intent and outcome fields reveal whether it completed the correct task. Include task category, expected result, final state, and relevant evaluation scores.
Sample according to risk. Uniform sampling can discard rare trajectories that matter most. Preserve traces involving sensitive tools, policy decisions, unusually long loops, anomalous cost, repeated retries, or high-value business actions.
Turn production failures into evaluation data. Once an incident is understood, add representative examples to a dataset and encode the expected behavior as an evaluation. The resulting regression suite helps prevent the same class of failure from returning.
Keep the investigation auditable. When an observing agent proposes a root cause or code change, preserve the traces, queries, evaluations, and assumptions that support its conclusion. Human review becomes far more useful when the agent presents evidence instead of confidence alone.
From agent observability to self-improving systems
The deeper opportunity extends beyond faster incident response. When production behavior can be interpreted, clustered, evaluated, and connected to experiments, observability becomes the entry point to an agent improvement loop. A failure produces evidence; the evidence becomes a dataset; the dataset powers an evaluation; the evaluation tests a proposed change; and the validated change returns to production under human review.
That loop turns traces from passive records into development inputs. Agent proliferation will make production systems more difficult to understand. It will also create systems capable of helping with that understanding, provided developers give them complete telemetry, meaningful evaluations, and controlled access to the improvement workflow.
As the flame graph grows denser, the useful question becomes whether the observability stack can explain it before an engineer spends Saturday night staring at it.
The post AI agent observability: Why production systems need a reasoning layer appeared first on Arize AI.
関連記事
今日のまとめ
AIデイリーブリーフで今日の重要ニュースをまとめ読み