Amazon Bedrockの推論ワークロード向け新CloudWatchメトリクスでTTFTと推定クォータ消費量の可視性を向上
本文の状態
日本語全文を表示中
詳細モードで約2分の本文を読めます。
同じ出来事の情報源
5媒体で確認
The Decoder · Amazon Science · InfoQ · TechCrunch AI · AWS Machine Learning Blog
各社の報じ方を比較 ↓AWSはAmazon BedrockでTTFT(初回トークン時間)と推定クォータ消費量のCloudWatchメトリクスを追加し、生成AIワークロードの推論パフォーマンスとリソース消費の可視性を向上させた。
Source Article
元記事を日本語で読む
本文に関係しない購読案内、埋め込み通知、サイト内プロモーションは除いています。
import boto3

bedrock = boto3.client('bedrock-runtime', region_name='us-east-1')

response = bedrock.converse(
    modelId='us.anthropic.claude-sonnet-4-6-v1',
    messages=[
        {
            'role': 'user',
            'content': [{'text': 'What is the capital of France?'}]
        }
    ]
)

print(response['output']['message']['content'][0]['text'])
print(f"Input tokens: {response['usage']['inputTokens']}")
print(f"Output tokens: {response['usage']['outputTokens']}")
ConverseStream (ストリーミング)
以下の例ではConverseStream APIを使用しています。このストリーミング呼び出しでは、クォータ消費量を示すEstimatedTPMQuotaUsage(倍精度浮動小数点数値)と、リクエストから最初のストリームトークンまでのレイテンシを測定するTimeToFirstToken(ミリ秒単位の値)の両方が出力されます。
import boto3

bedrock = boto3.client('bedrock-runtime', region_name='us-east-1')

response = bedrock.converse_stream(
    modelId='us.anthropic.claude-sonnet-4-6-v1',
    messages=[
        {
            'role': 'user',
            'content': [{'text': 'What is the capital of France?'}]
        }
    ]
)

for event in response['stream']:
    if 'contentBlockDelta' in event:
        print(event['contentBlockDelta']['delta']['text'], end='')
print()同じメトリクスはInvokeModel(非ストリーミング)およびInvokeModelWithResponseStream(ストリーミング)APIでも出力されます。以下の表は各APIが出力するメトリクスをまとめたものです:
| API | 出力メトリクス |
|---|---|
| Converse | EstimatedTPMQuotaUsage |
| ConverseStream | EstimatedTPMQuotaUsage, TimeToFirstToken |
| InvokeModel | EstimatedTPMQuotaUsage |
| InvokeModelWithResponseStream | EstimatedTPMQuotaUsage, TimeToFirstToken |
これらのリクエストを実行した後、メトリクスが表示されるまで約1〜2分待機し、CloudWatchコンソールでメトリクス > すべてのメトリクス > AWS/Bedrockに移動して、モデルのデータポイントが存在することを確認してください。
AWS CLIを使用したメトリクスのクエリ
AWS CLIを使用して、新しいメトリクスが利用可能であることを確認し、その値を取得できます。まず、モデルに対してメトリクスが公開されていることを確認します:
# 利用可能なTimeToFirstTokenメトリクスを一覧表示
aws cloudwatch list-metrics --namespace AWS/Bedrock --metric-name TimeToFirstToken

# 利用可能なEstimatedTPMQuotaUsageメトリクスを一覧表示
aws cloudwatch list-metrics --namespace AWS/Bedrock --metric-name EstimatedTPMQuotaUsage
原文を表示
As organizations scale their generative AI workloads on Amazon Bedrock, operational visibility into inference performance and resource consumption becomes critical. Teams running latency-sensitive applications must understand how quickly models begin generating responses. Teams managing high-throughput workloads must understand how their requests consume quota so they can avoid unexpected throttling. Until now, gaining this visibility required custom client-side instrumentation or reactive troubleshooting after issues occurred.
Today, we’re announcing two new Amazon CloudWatch metrics for Amazon Bedrock, TimeToFirstToken and EstimatedTPMQuotaUsage. These metrics give you server-side visibility into streaming latency and quota consumption. These metrics are automatically emitted for every successful inference request at no additional cost, with no API changes or opt-in required. They are available now in the AWS/Bedrock CloudWatch namespace.
In this post, we cover the following:
- Why visibility into time-to-first-token latency and quota consumption matters for production AI workloads
- How the new TimeToFirstToken and EstimatedTPMQuotaUsage metrics work
- How to get started using these metrics to set alarms, establish baselines, and proactively manage capacity.
Amazon Bedrock already provides a set of CloudWatch metrics to help you monitor your inference workloads. The AWS/Bedrock namespace includes metrics such as Invocations, InvocationLatency, InvocationClientErrors, InvocationThrottles, InputTokenCount, and OutputTokenCount. These metrics provide visibility into request volume, end-to-end latency, error rates, and token usage. These metrics are available across the Converse, ConverseStream, InvokeModel, and InvokeModelWithResponseStream APIs and can be filtered by the ModelId dimension. While these metrics provide a strong operational foundation, they leave two important gaps: they don’t capture how quickly a streaming response begins (time-to-first-token), and they don’t reflect the effective quota consumed by a request after accounting for token burndown multipliers. The two new metrics announced today address exactly these gaps.
Observability needs of production AI Inference workloads
In streaming inference applications, like chatbots, coding assistants, or real-time content generation, the time it takes for the model to return its first token directly affects perceived responsiveness. A delay in the first token directly impacts the perceived responsiveness of your application, even when overall throughput remains within acceptable ranges. However, measuring this server-side metric previously required you to instrument your application code to capture timestamps around API calls. This added complexity and potentially introduced measurement inaccuracies that don’t reflect the actual service-side behavior.
Quota management presents a different but equally important challenge. Amazon Bedrock applies token burndown multipliers for certain models. This means that the effective quota consumed by a request can differ from the raw token counts that you see in billing metrics. For example, Anthropic Claude models, including Claude Sonnet 4.6, Claude Opus 4.6, Claude Sonnet 4.5, and Claude Opus 4.5, apply a 5x burndown multiplier on output tokens for quota purposes. This means a request that produces 100 output tokens effectively consumes 500 tokens of your Tokens Per Minute (TPM) quota. You are only billed for your actual token usage. Without visibility into this calculation, throttling can appear unpredictable, making it difficult to set appropriate alarms or plan capacity increases ahead of time. For customers using cross-Region inference profiles, these challenges are compounded because you need per-inference-profile visibility to understand performance and consumption across geographic and global configurations.
Understanding newly introduced metrics
The following diagram shows where each metric is captured during the lifecycle of a streaming inference request.
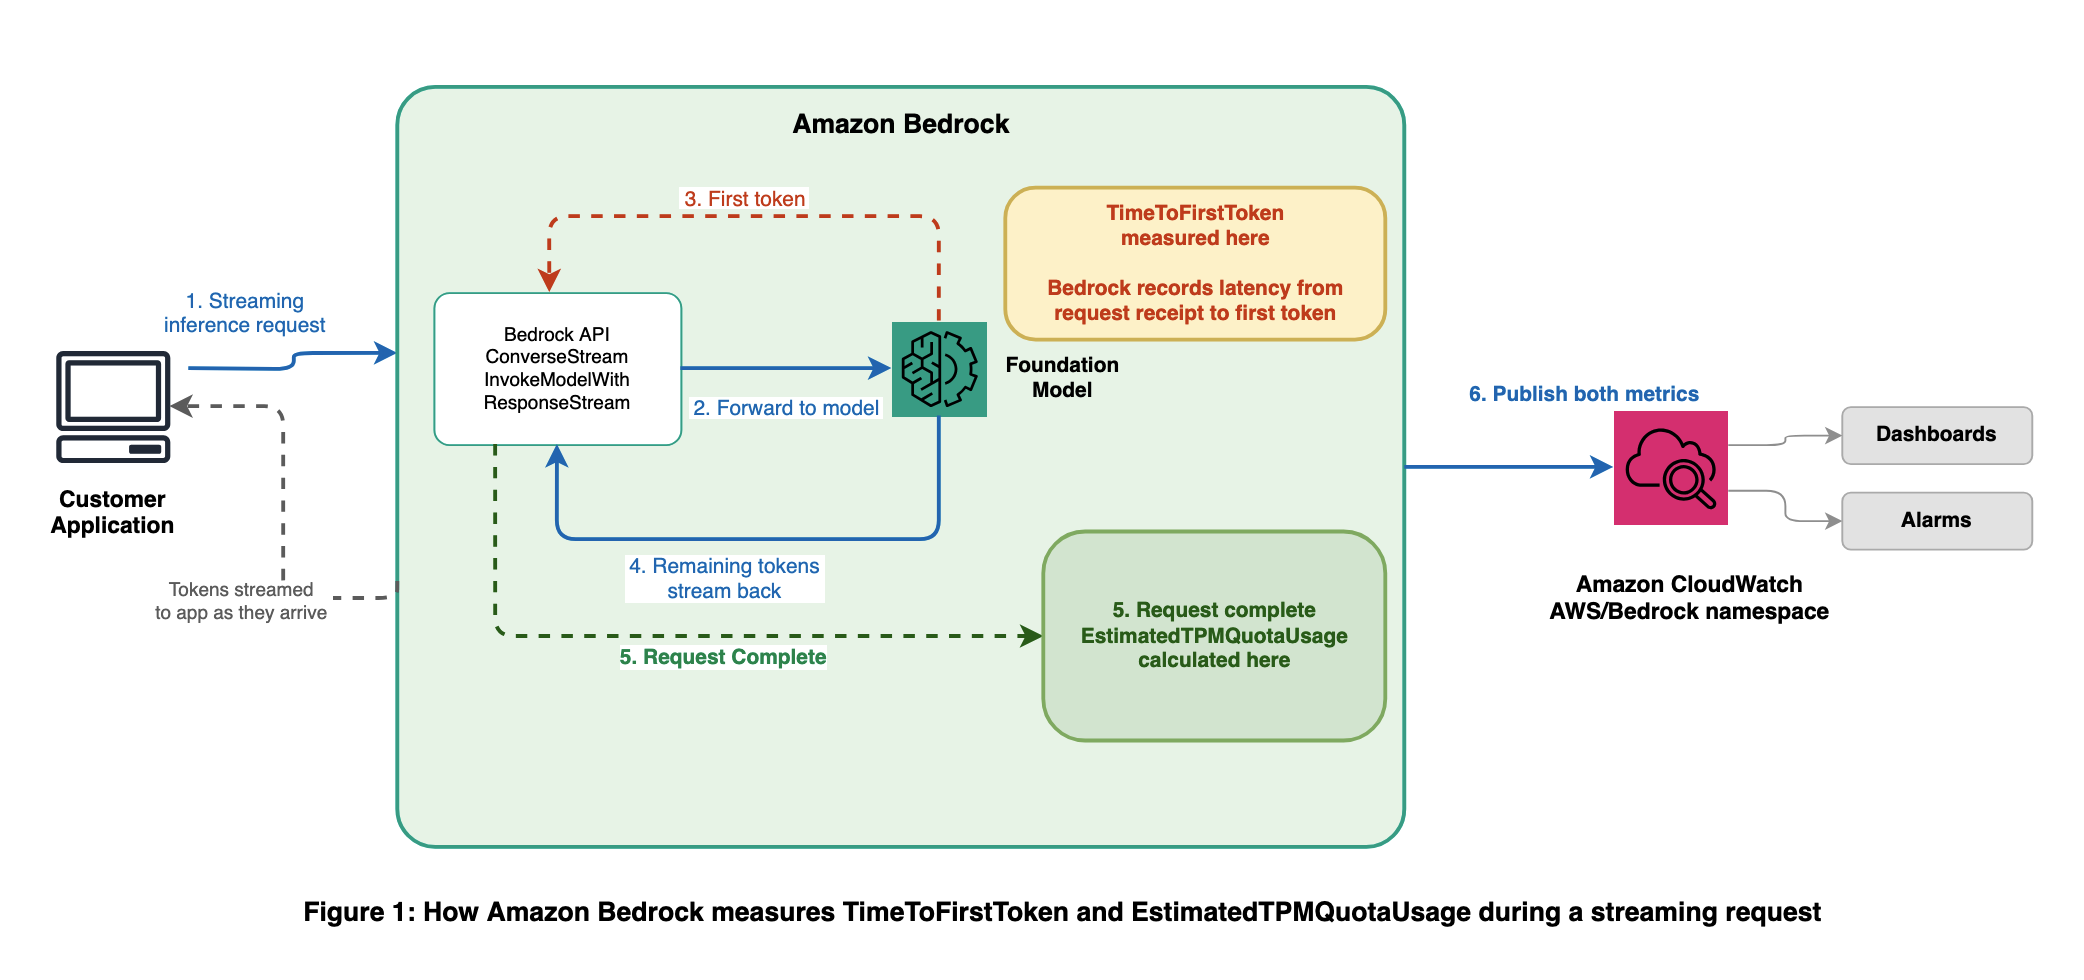
TimeToFirstToken:
The TimeToFirstToken metric measures the latency, in milliseconds, from when Amazon Bedrock receives your streaming request to when the service generates the first response token. This metric is emitted for the streaming APIs: ConverseStream and InvokeModelWithResponseStream. Because this metric is measured server-side, it reflects actual service-side latency without noise from network conditions or client-side processing.
With this metric, you can:
- Set latency alarms – Create CloudWatch alarms that notify you when time-to-first-token exceeds acceptable thresholds, so you can detect performance degradation before it impacts your users.
- Establish SLA baselines – Analyze historical TimeToFirstToken data across models to set informed performance baselines for your applications.
- Diagnose performance issues – Correlate TimeToFirstToken with other Amazon Bedrock metrics such as InvocationLatency (Time to Last Token) to isolate whether latency issues stem from initial model response time or overall request processing.
The metric is published with the ModelId dimension, and optionally ServiceTier and ResolvedServiceTier dimensions. For cross-Region inference profiles, the ModelId corresponds to your inference profile identifier (for example, us.anthropic.claude-sonnet-4-5-v1), so you can monitor TimeToFirstToken separately for each profile. This metric is emitted only for successfully completed streaming requests.
EstimatedTPMQuotaUsage:
The EstimatedTPMQuotaUsage metric tracks the estimated Tokens Per Minute (TPM) quota consumed by your requests. Unlike raw token counts, this metric accounts for the factors that Amazon Bedrock uses when evaluating quota consumption, including cache write tokens and output token burndown multipliers. The metric name includes “Estimated” to reflect that it provides a close approximation of your quota consumption for monitoring and capacity planning purposes. The internal throttling decisions of Amazon Bedrock are based on real-time calculations that might differ slightly from this metric, but EstimatedTPMQuotaUsage is designed to give you a reliable, actionable signal. It should be accurate enough to set alarms, track consumption trends, and plan quota increases with confidence. This metric is emitted across all inference APIs, including Converse, InvokeModel, ConverseStream, and InvokeModelWithResponseStream.
Understanding the quota consumption formula:
The formula for calculating estimated quota consumption depends on your throughput type:
On-demand inference:
EstimatedTPMQuotaUsage = InputTokenCount + CacheWriteInputTokens + (OutputTokenCount × burndown_rate)
The burndown rate varies by model — for the full list of models and their applicable rates, refer to Token burndown multipliers for quota management. For on-demand inference, cache read tokens don’t count toward the quota.
As an example, Claude Sonnet 4.5 has a 5x burndown rate on output tokens. An on-demand request with 1,000 input tokens, 200 cache write tokens, and 100 output tokens consumes 1,000 + 200 + (100 × 5) = 1,700 tokens of quota. This is 400 more than you might estimate from raw token counts alone.
Provisioned Throughput (reserved tier):
EstimatedTPMQuotaUsage = InputTokenCount + (CacheWriteInputTokens × 1.25) + (CacheReadInputTokens × 0.1) + OutputTokenCount
For Provisioned Throughput, the burndown multiplier on output tokens does not apply. However, cache read tokens contribute at a 0.1 rate and cache write tokens are weighted at 1.25.
Note that billing differs from quota usage — you are billed for actual token usage, not the burndown-adjusted or weighted amounts. For more details, refer to Token burndown multipliers for quota management.
With this metric, you can:
- Set proactive quota alarms – Create CloudWatch alarms that trigger when your estimated quota usage approaches your TPM limit, so you can act before requests are throttled.
- Track consumption across models – Compare quota usage across different models to understand which workloads are consuming the most capacity and optimize accordingly.
- Plan quota increases – Use historical consumption trends to request quota increases through AWS service quotas before your usage growth leads to throttling.
Metric dimensions and filtering
Both metrics share the following characteristics:
The metrics include dimensions such as ModelId, allowing you to filter and aggregate data per model. When you use a cross-Region inference profile, whether geographic (for example, us.anthropic.claude-sonnet-4-5-v1) or global (for example, global.anthropic.claude-sonnet-4-5-v1), the ModelId dimension corresponds to your inference profile identifier. This means that you can view separate metrics for each cross-Region inference profile and model combination. This gives you granular visibility into performance and consumption across your inference configurations.
This is consistent with existing Amazon Bedrock CloudWatch metrics like *Invocations, *InvocationLatency*,* and token count metrics.
| Attribute | TimeToFirstToken | EstimatedTPMQuotaUsage |
|---|---|---|
| CloudWatch namespace | AWS/Bedrock | AWS/Bedrock |
| Unit | Milliseconds | Count |
| Supported APIs | ConverseStream, InvokeModelWithResponseStream | Converse, InvokeModel, ConverseStream, InvokeModelWithResponseStream |
| Update frequency | 1-minute aggregation | 1-minute aggregation |
| Scope | Successfully completed requests | Successfully completed requests |
| Primary dimension | ModelId | ModelId |
| Optional dimensions | ServiceTier, ResolvedServiceTier | ServiceTier, ResolvedServiceTier, ContextWindow (for input contexts exceeding 200K tokens) |
| Supported inference types | Cross-Region inference (geographic and global), in-Region inference | Cross-Region inference (geographic and global), in-region inference |
Getting started
These metrics are already available in your CloudWatch dashboard. When your application calls an Amazon Bedrock inference API, the service processes the request, invokes the model, and publishes all applicable metrics — including TimeToFirstToken and EstimatedTPMQuotaUsage — to the AWS/Bedrock namespace in your CloudWatch account. You can then use CloudWatch dashboards, alarms, and metric math to monitor, alert on, and analyze these metrics. Complete the following steps to start using them:
- Open the Amazon CloudWatch console and navigate to Metrics > All metrics.
- Select the AWS/Bedrock namespace.
- Find the TimeToFirstToken or EstimatedTPMQuotaUsage metrics and filter by ModelId to view data for specific models.
- Create alarms to get notified of latency degradation or quota consumption approaching your limits.
Make inference requests and observe the new metrics
To generate metric data points, make inference requests against Amazon Bedrock. The following examples use the AWS SDK for Python (Boto3) to demonstrate a non-streaming request (which emits EstimatedTPMQuotaUsage) and a streaming request (which emits both EstimatedTPMQuotaUsage and TimeToFirstToken).
In these examples, we use us-east-1 as the AWS Region and us.anthropic.claude-sonnet-4-6-v1 as a cross-Region inference profile. Replace these with your own Region and model or inference profile ID.
Converse (non-streaming)
The following example uses the Converse API. This non-streaming call emits the EstimatedTPMQuotaUsage metric in CloudWatch under the AWS/Bedrock namespace.
import boto3

bedrock = boto3.client('bedrock-runtime', region_name='us-east-1')

response = bedrock.converse(
    modelId='us.anthropic.claude-sonnet-4-6-v1',
    messages=[
        {
            'role': 'user',
            'content': [{'text': 'What is the capital of France?'}]
        }
    ]
)

print(response['output']['message']['content'][0]['text'])
print(f"Input tokens: {response['usage']['inputTokens']}")
print(f"Output tokens: {response['usage']['outputTokens']}")
ConverseStream (streaming)
The following example uses the ConverseStream API. This streaming call emits both EstimatedTPMQuotaUsage (value in double) for quota consumption and TimeToFirstToken (value in milliseconds) measuring latency from request to the first streamed token.
import Boto3

bedrock = boto3.client('bedrock-runtime', region_name='us-east-1')

response = bedrock.converse_stream(
    modelId='us.anthropic.claude-sonnet-4-6-v1',
    messages=[
        {
            'role': 'user',
            'content': [{'text': 'What is the capital of France?'}]
        }
    ]
)

for event in response['stream']:
    if 'contentBlockDelta' in event:
        print(event['contentBlockDelta']['delta']['text'], end='')
print()
The same metrics are emitted for the InvokeModel (non-streaming) and InvokeModelWithResponseStream (streaming) APIs. The following table summarizes which metrics each API emits:
| API | Emitted metrics |
|---|---|
| Converse | EstimatedTPMQuotaUsage |
| ConverseStream | EstimatedTPMQuotaUsage, TimeToFirstToken |
| InvokeModel | EstimatedTPMQuotaUsage |
| InvokeModelWithResponseStream | EstimatedTPMQuotaUsage, TimeToFirstToken |
After making these requests, allow approximately 1–2 minutes for the metrics to appear, then navigate to the CloudWatch console under Metrics > All metrics > AWS/Bedrock to verify that the data points are present for your model.
Query metrics using the AWS CLI
You can use the AWS CLI to verify that the new metrics are available and retrieve their values. First, confirm that the metrics are being published for your model:
List available TimeToFirstToken metrics
aws cloudwatch list-metrics --namespace AWS/Bedrock --metric-name TimeToFirstToken
List avai
同じ出来事を5媒体で確認
同じ出来事を扱う別媒体の記事です。見出しと公開時刻を比較できます。
今日のまとめ
AIデイリーブリーフで今日の重要ニュースをまとめ読み