Snowflake と SageMaker Canvas のノーコード ML ワークフロー構築(第 2 部)
本文の状態
日本語全文を表示中
詳細モードで約13分の本文を読めます。
同じ出来事の情報源
この情報源を基点に整理
AWS Machine Learning Blog
AWS は Snowflake との連携を強化した Amazon SageMaker Canvas の第 2 部で、データ準備から XGBoost を用いた不正検知モデル構築までのノーコードワークフローを実践的に示す。
AI深層分析を開く2026年8月21日 10:20
AI深層分析
キーポイント
Snowflake との直接連携機能
Amazon SageMaker Canvas は Snowflake データウェアハウスと直接接続し、外部データソースを介さずにデータを取得できる機能を備えている。
Data Wrangler による可視化データ処理
Data Wrangler のビジュアル変換機能を用いて、ユーザーはコードを書かずにデータの整形や前処理を直感的に行うことができる。
XGBoost を用いた不正検知モデル構築
本ワークフローでは XGBoost アルゴリズムを活用して、具体的なユースケースである不正検知の機械学習モデルを構築する手順が解説されている。
Amazon SageMaker Canvas の起動手順
左側のパネルから「Canvas」を選択し、作成したドメインとユーザープロファイルを選んで「Open Canvas」をクリックする。ワークスペースの準備には3〜5分程度かかる。
Data Wrangler によるデータ前処理の簡素化
Amazon SageMaker Data Wrangler は視覚的なインターフェースと組み込み変換機能により、機械学習ワークフローにおけるデータ準備時間を大幅に短縮する。Snowflake との統合によりデータ移動が不要となり、ユーザーは Snowflake データウェアハウスから直接データを接続して変換し、モデル構築へ進むことができる。
重要な引用
Amazon SageMaker Canvas is a visual, no-code machine learning service that enables business analysts and domain experts to build accurate ML models
This solution guides you through the complete workflow of preparing data and building a machine learning model using Amazon SageMaker Canvas, with direct integration to your Snowflake data warehouse.
The integration with Snowflake reduces data movement challenges, so users can connect directly to their Snowflake data warehouses, transform the data within Canvas, and proceed straight to model building.
Amazon SageMaker Data Wrangler simplifies data preparation for machine learning workflows.
編集コメントを表示
編集コメント
本記事は、データサイエンティスト以外のユーザーが機械学習の壁を越えるための具体的な手順を示しており、組織内の AI 民主化を推進する実用的なガイドである。Snowflake との連携強化は、既存のデータ基盤を活用した迅速な分析環境構築に寄与する。
Source Article
元記事を日本語で読む
本文に関係しない購読案内、埋め込み通知、サイト内プロモーションは除いています。
前編では、Snowflake データベースのセットアップと、このノーコード型機械学習(ML)ワークフローのための基盤となるインフラストラクチャの構築について解説しました。
本稿(第2回)では、Amazon SageMaker Canvas を用いた完全なデータ準備からモデル構築までのワークフローを紹介します。Snowflake のデータソースに直接接続し、Data Wrangler のビジュアル変換機能でデータを加工・整える方法や、XGBoost アルゴリズムを活用した不正検知モデルの構築手順を解説します。
Amazon SageMaker Canvas は、ビジネスアナリストやドメインエキスパートが直感的に操作できるビジュアルでノーコード型の機械学習サービスです。これにより、正確な ML モデルの構築と予測結果の生成が可能になります。データ準備からモデル訓練、予測生成に至るまで直感的なインターフェースを提供し、組織全体での機械学習へのアクセスを民主化しながらも、エンタープライズレベルのセキュリティとガバナンスを維持します。
ソリューション概要
本ソリューションでは、Snowflake データウェアハウスに直接統合された Amazon SageMaker Canvas を活用した、データ準備から機械学習モデル構築までの一連のワークフローを案内します。
前提条件
本記事の手順を実行する前に、Part 1 で Snowflake 環境のセットアップを完了させてください。本記事の手順を進めるには、Part 1 で取得した Snowflake アカウントの認証情報と接続詳細が必要です。
Amazon SageMaker Canvas の設定
AWS Management Console にログインし、「Amazon SageMaker Canvas」を検索します。リストから選択するか、Enter キーを押してください。
Amazon SageMaker ドメインの作成
ドメインは、Amazon SageMaker 環境における組織的な基本単位です。ユーザープロファイル、ストレージ設定、セキュリティ設定を管理するための専用ワークスペースとして機能し、チームでのコラボレーションやデータガバナンスを効果的に管理するためにリソースとアクセス制御を分離します。
- 左側のペインにある「環境設定」に移動し、「ドメイン」を選択します。
- 「ドメインの作成」をクリックします。
- シングルユーザー向けセットアップ(クイックセットアップ) を選択すると、ドメインとユーザープロファイルが自動的に作成されます。
Amazon SageMaker Canvas の起動
- 左側のペインから「Canvas」を選択します。
- 先ほど作成したドメインとユーザープロファイルを選びます。
- 「Canvas を開く」をクリックします。
- ワークスペースの準備に 3〜5 分程度かかるため、しばらくお待ちください。
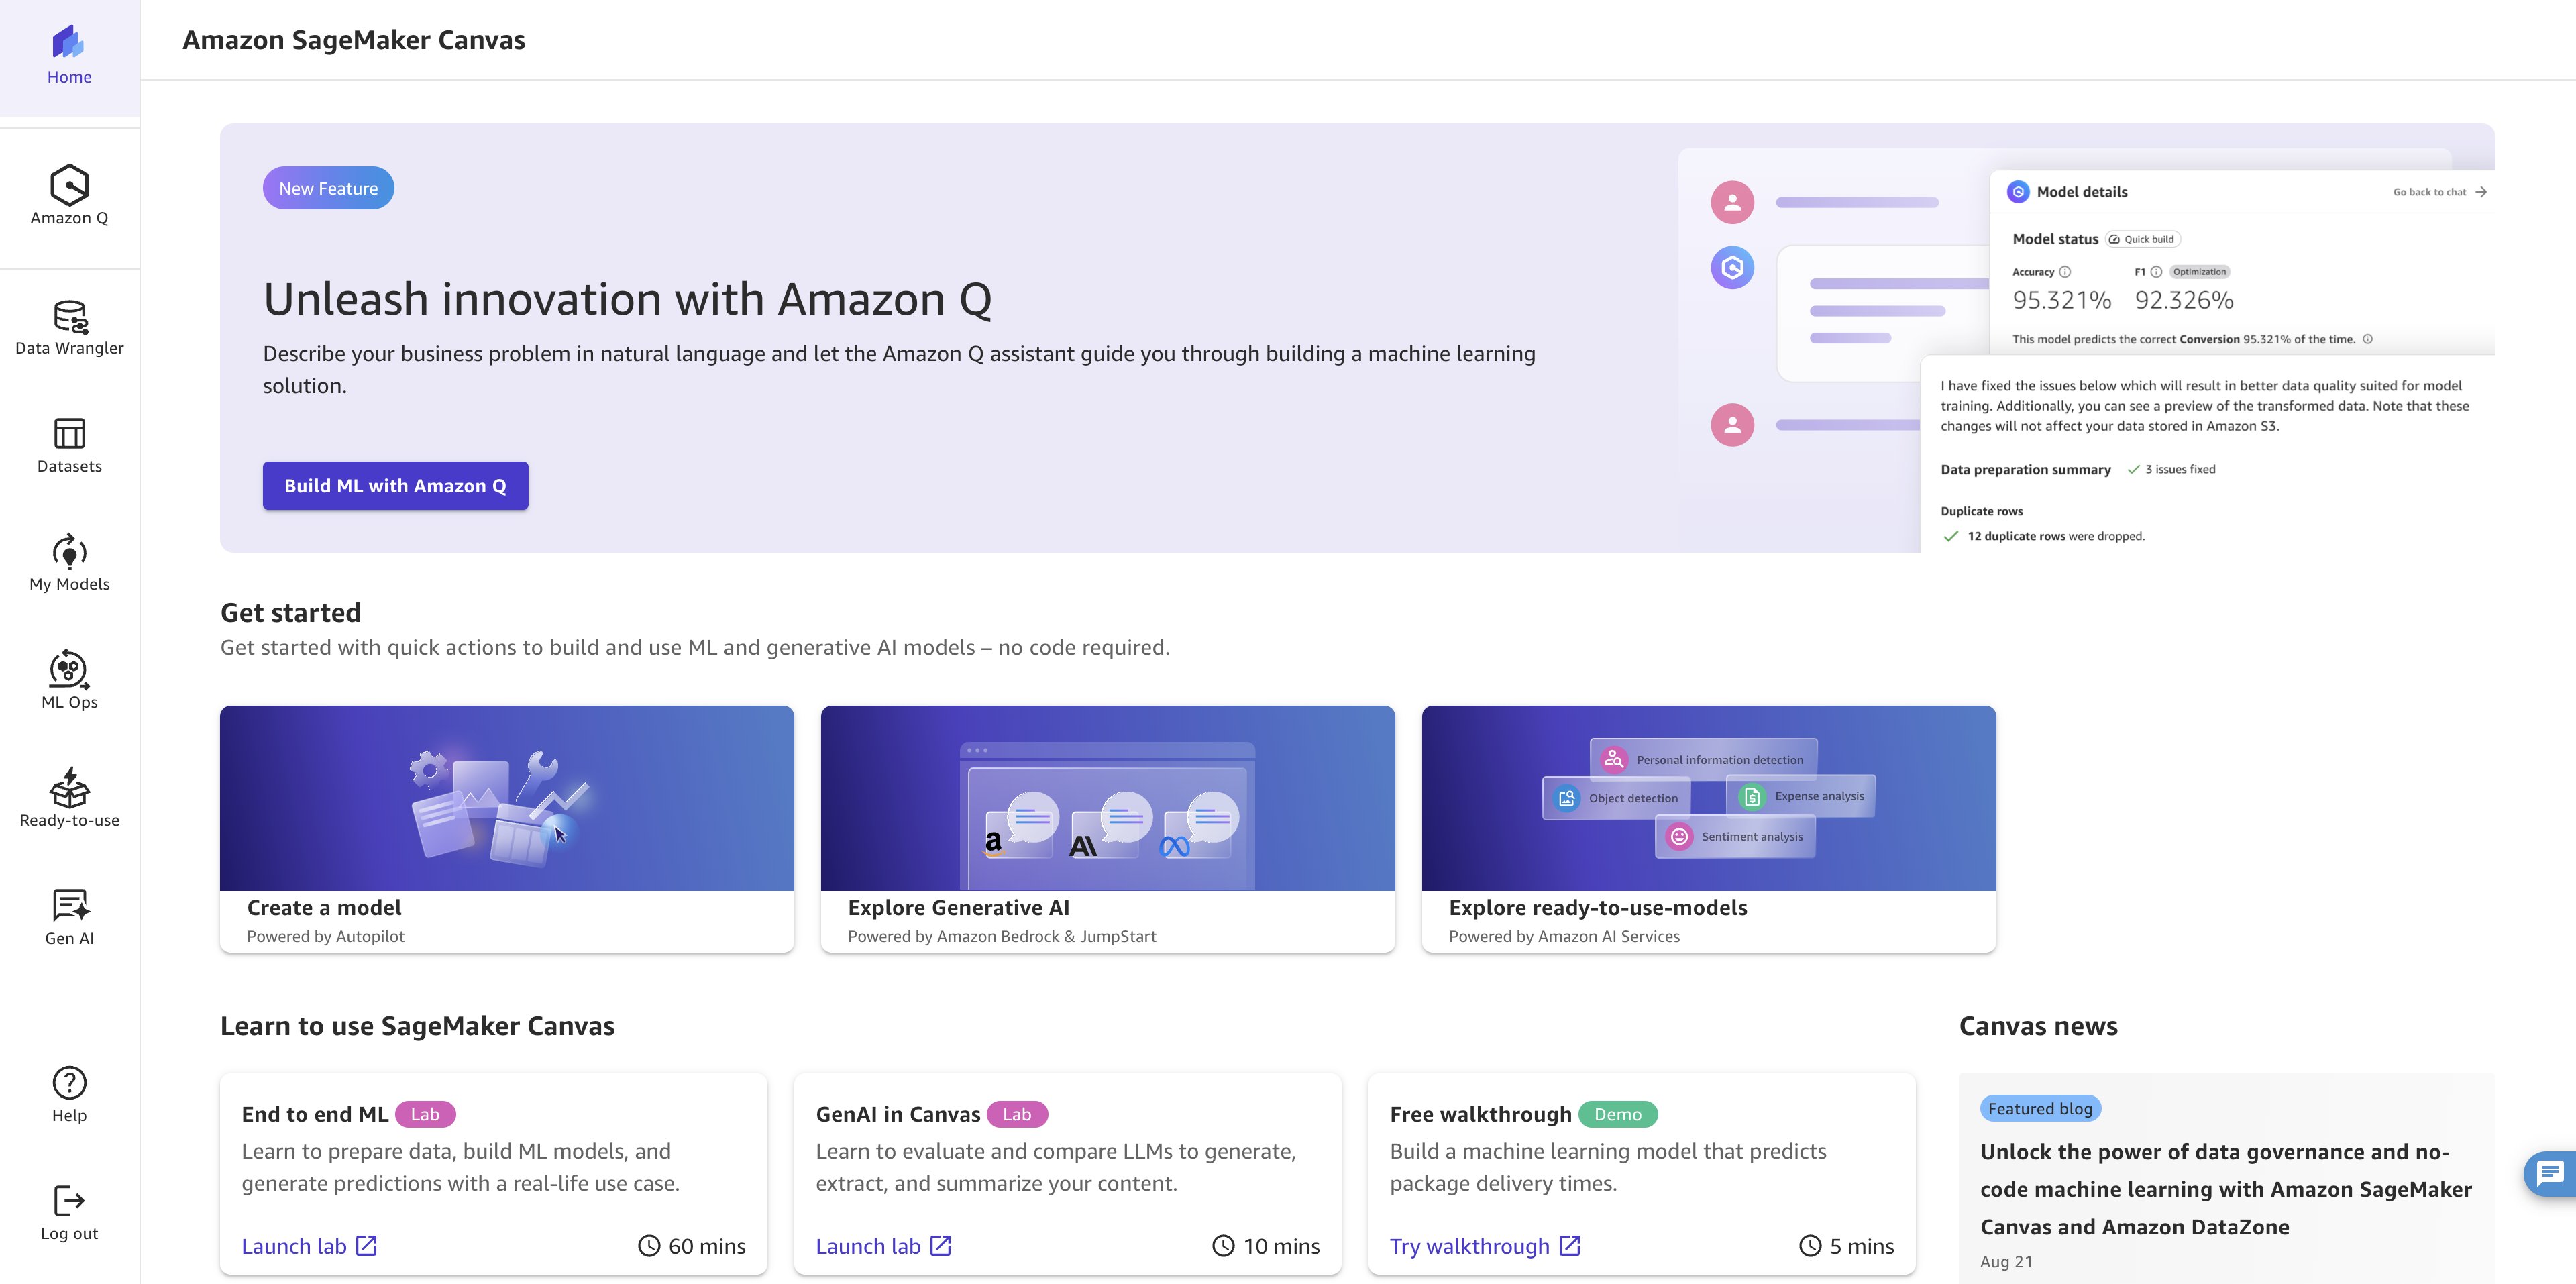
図 1: Amazon SageMaker Canvas のワークスペースがドメインから開かれた後に読み込まれている様子
データワングラー:機械学習のためのデータ準備
Amazon SageMaker Data Wrangler は、機械学習ワークフローにおけるデータ準備を簡素化するツールです。組み込みの変換機能と直感的なビジュアルインターフェースにより、従来はデータ準備や分析に要していた時間を大幅に短縮できます。金融サービスからヘルスケアまで幅広い業界で、この機能を活用すれば、専門家が直接データを準備して分析に臨むことが可能になり、大きな価値を生み出します。
Snowflake との統合により、データの移動に伴う課題が解消されます。ユーザーは Snowflake データウェアハウスに直接接続し、Canvas 内でデータを変換した上で、すぐにモデル構築に進むことができます。この統一されたノーコード環境は、データガバナンスとセキュリティを維持しながら、インサイトを得るまでの時間を加速させます。
A. データ接続と初期設定
ここでは、Amazon SageMaker Canvas を Snowflake データソースに接続する方法を説明します。
- Amazon SageMaker Canvas にアクセスし、左側のナビゲーションペインからData Wranglerを選択します。Import and prepare(取り込んで準備する)をクリックし、構造化データセットを扱うためにTabular(表形式)を選択してください。
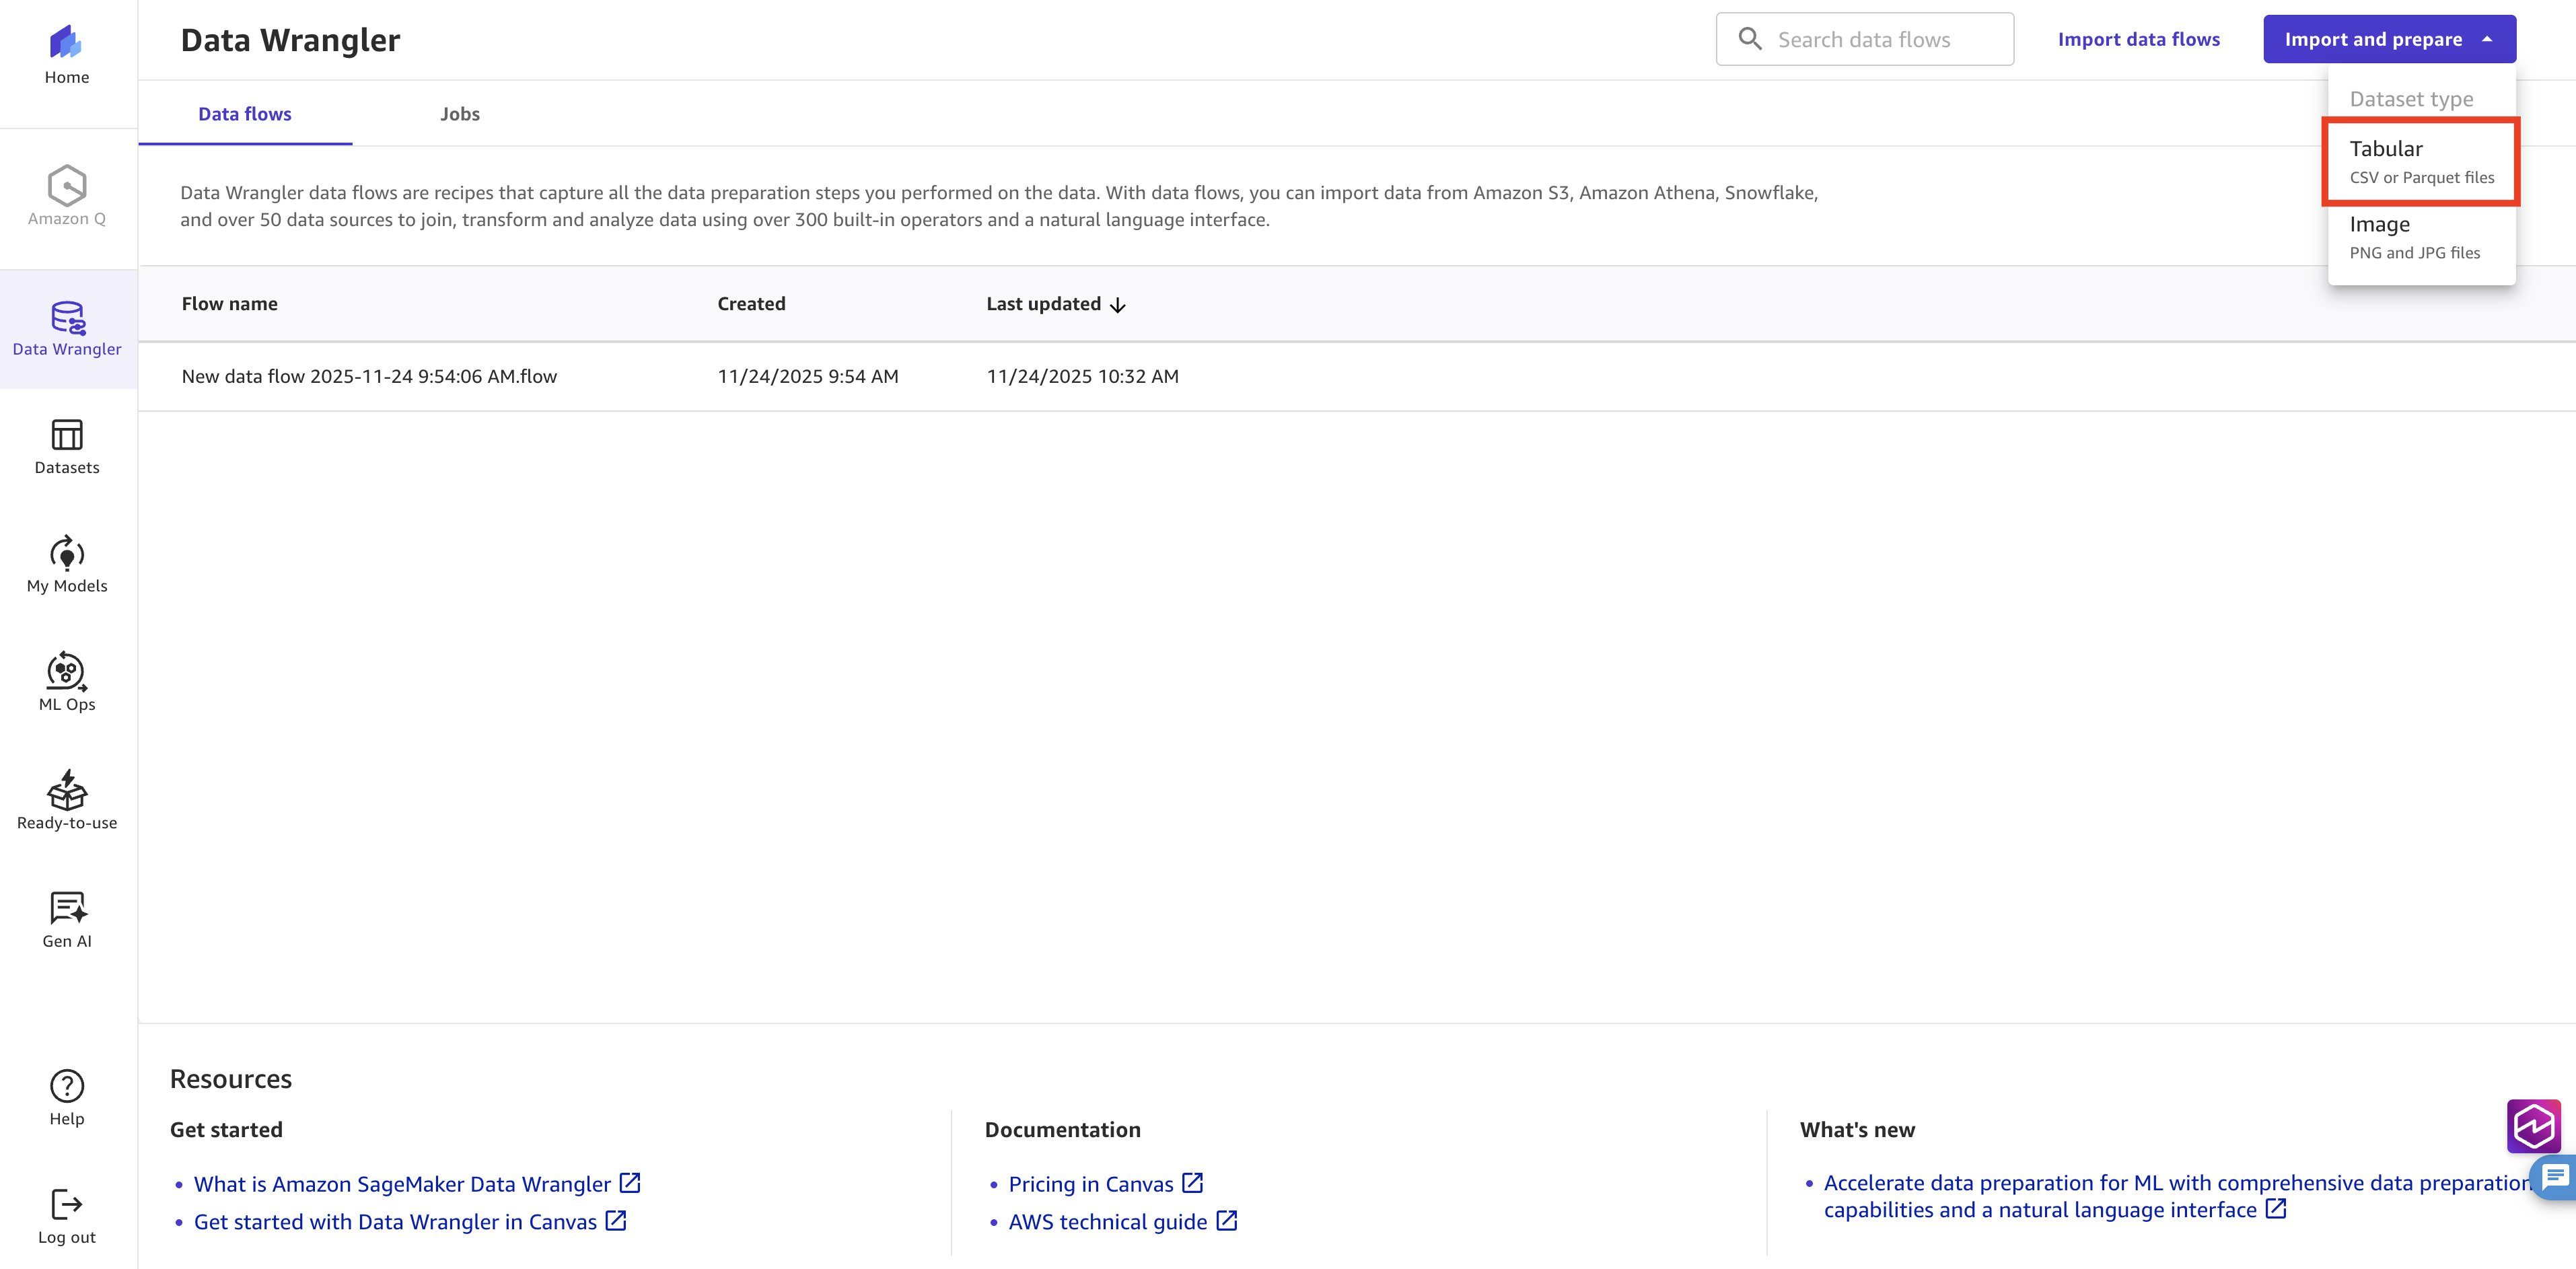
図 2: Amazon SageMaker Data Wrangler のインポートと準備画面で「Tabular」が選択されている様子
テーブル形式のデータセットのソースを指定します。データソースメニューから接続タイプとして Snowflake を選び、Add Connection(接続を追加)をクリックして、Amazon SageMaker Canvas と Snowflake 環境間のリンクを確立してください。この統合により、Canvas 内で直接クラウドデータウェアハウスにアクセスできます。手動でのデータエクスポートが不要になり、常に Snowflake インスタンス内の最新データを扱えるようになります。
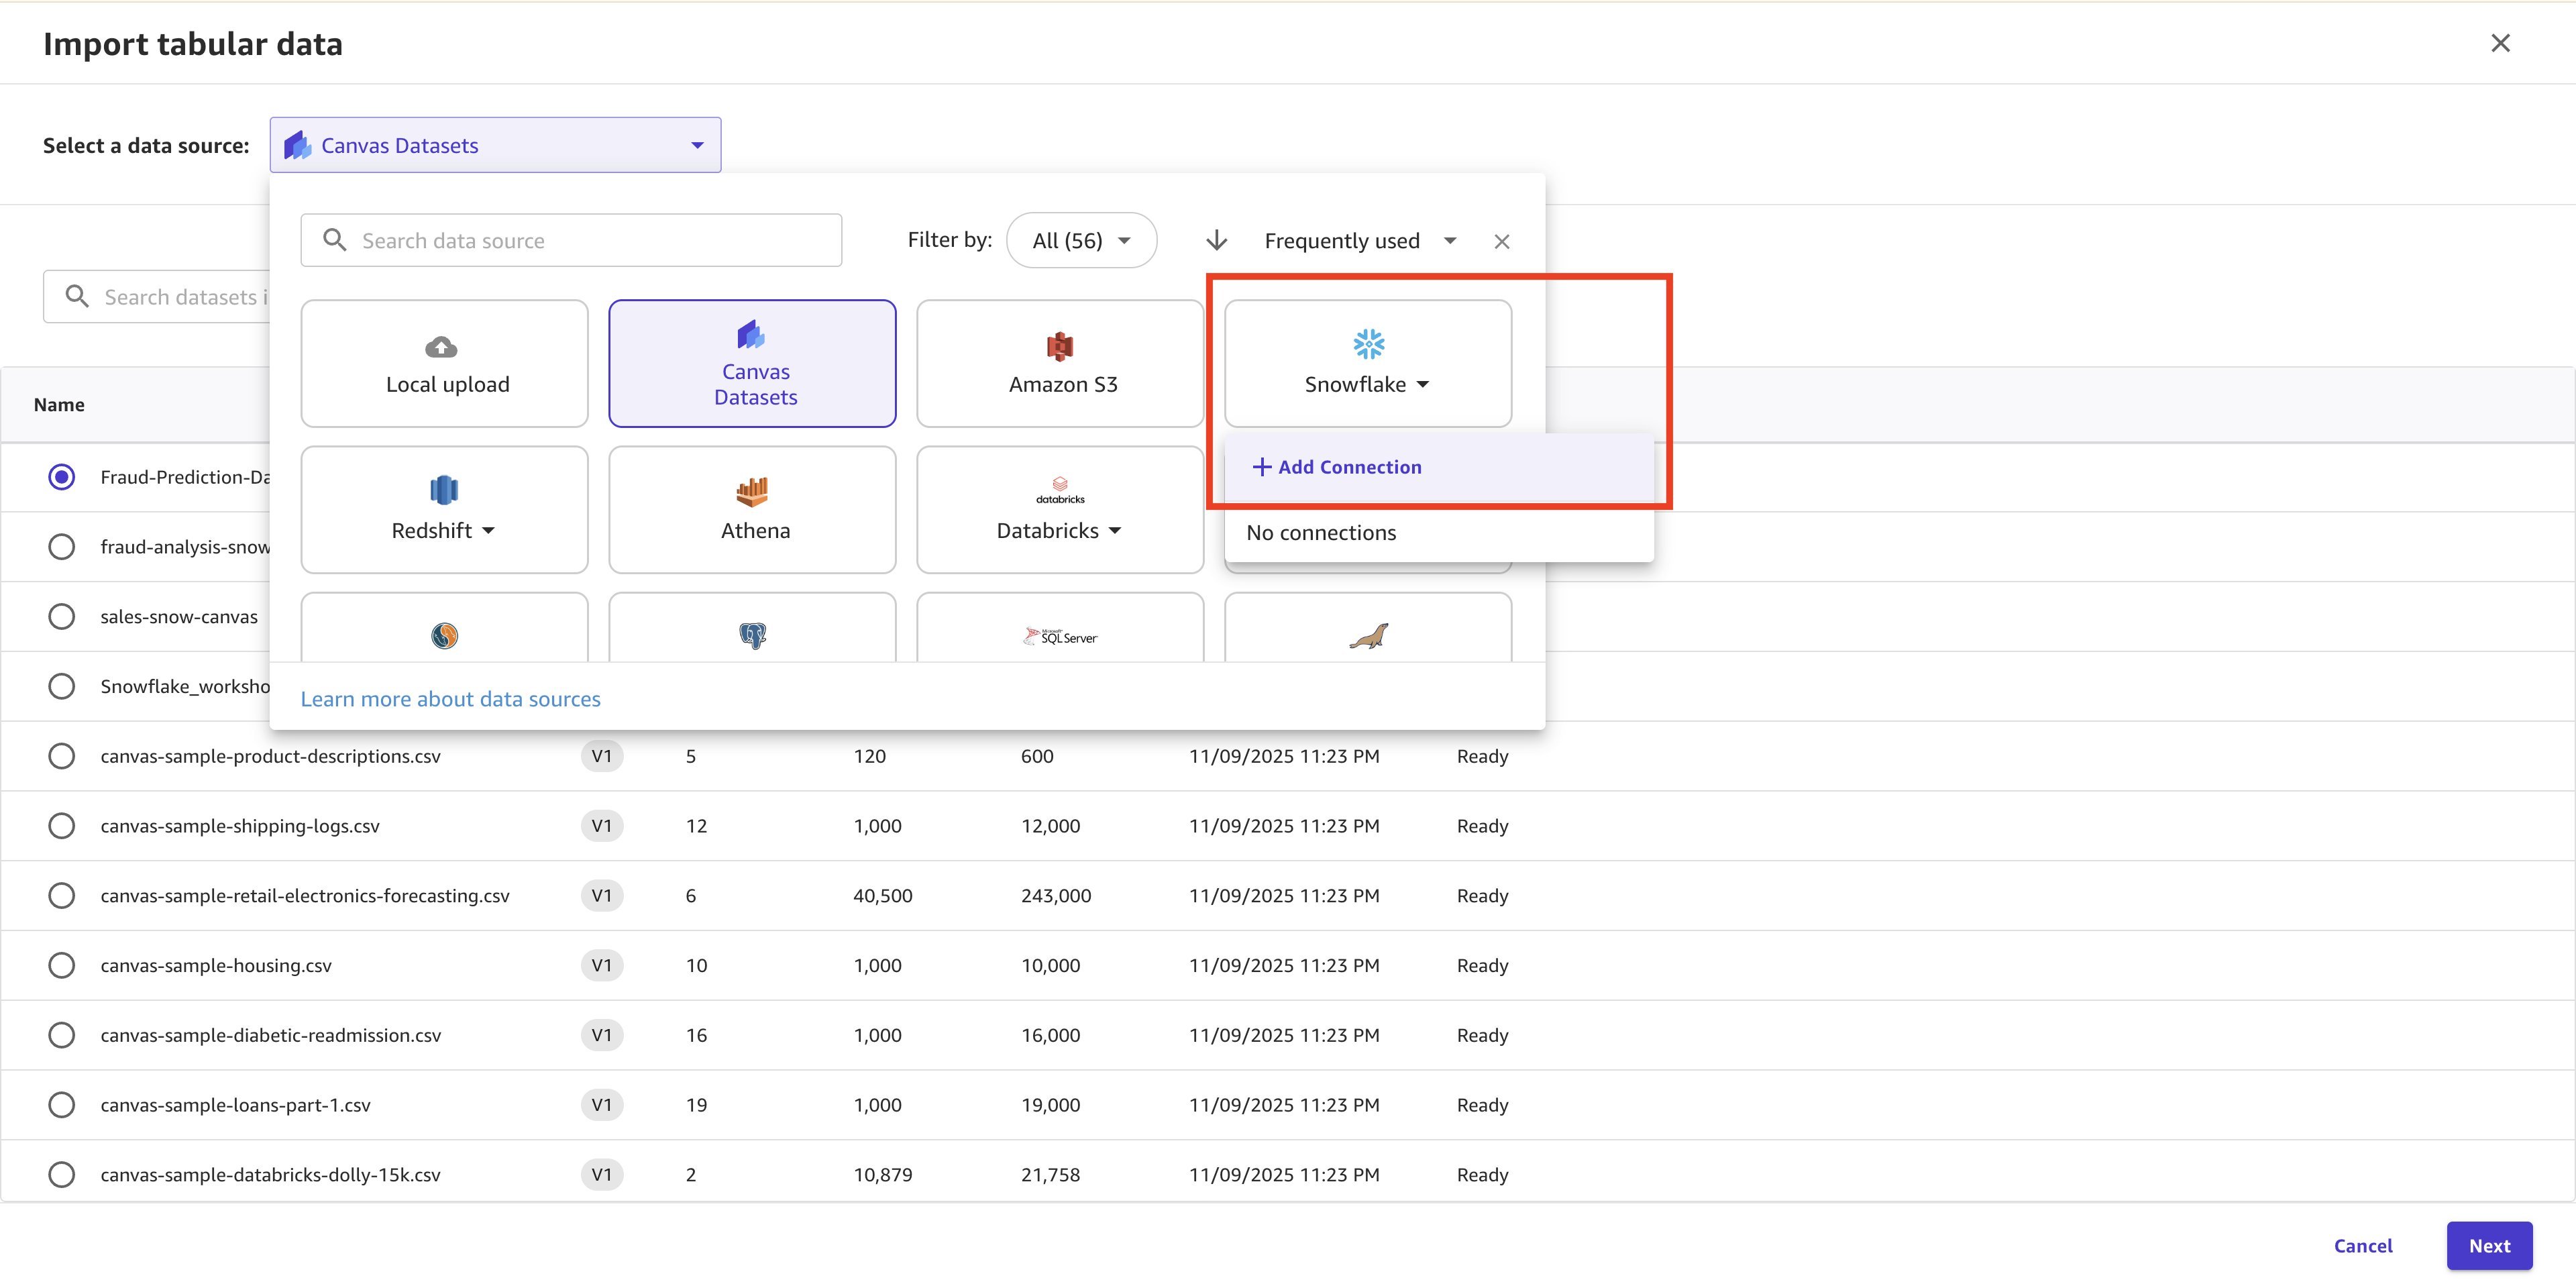
図 3: Data Wrangler でデータソースとして Snowflake を選択し、接続を追加する様子
Snowflake の接続ポップアップメニューでは、以下の情報を入力してください。
- 接続名
- Account ID:Snowflake オrganization の値にハイフンを挟み、その後に Snowflake アカウント ID を指定した形式
- 以前に設定した Snowflake アカウントのユーザー名
- 以前に設定したパスワード
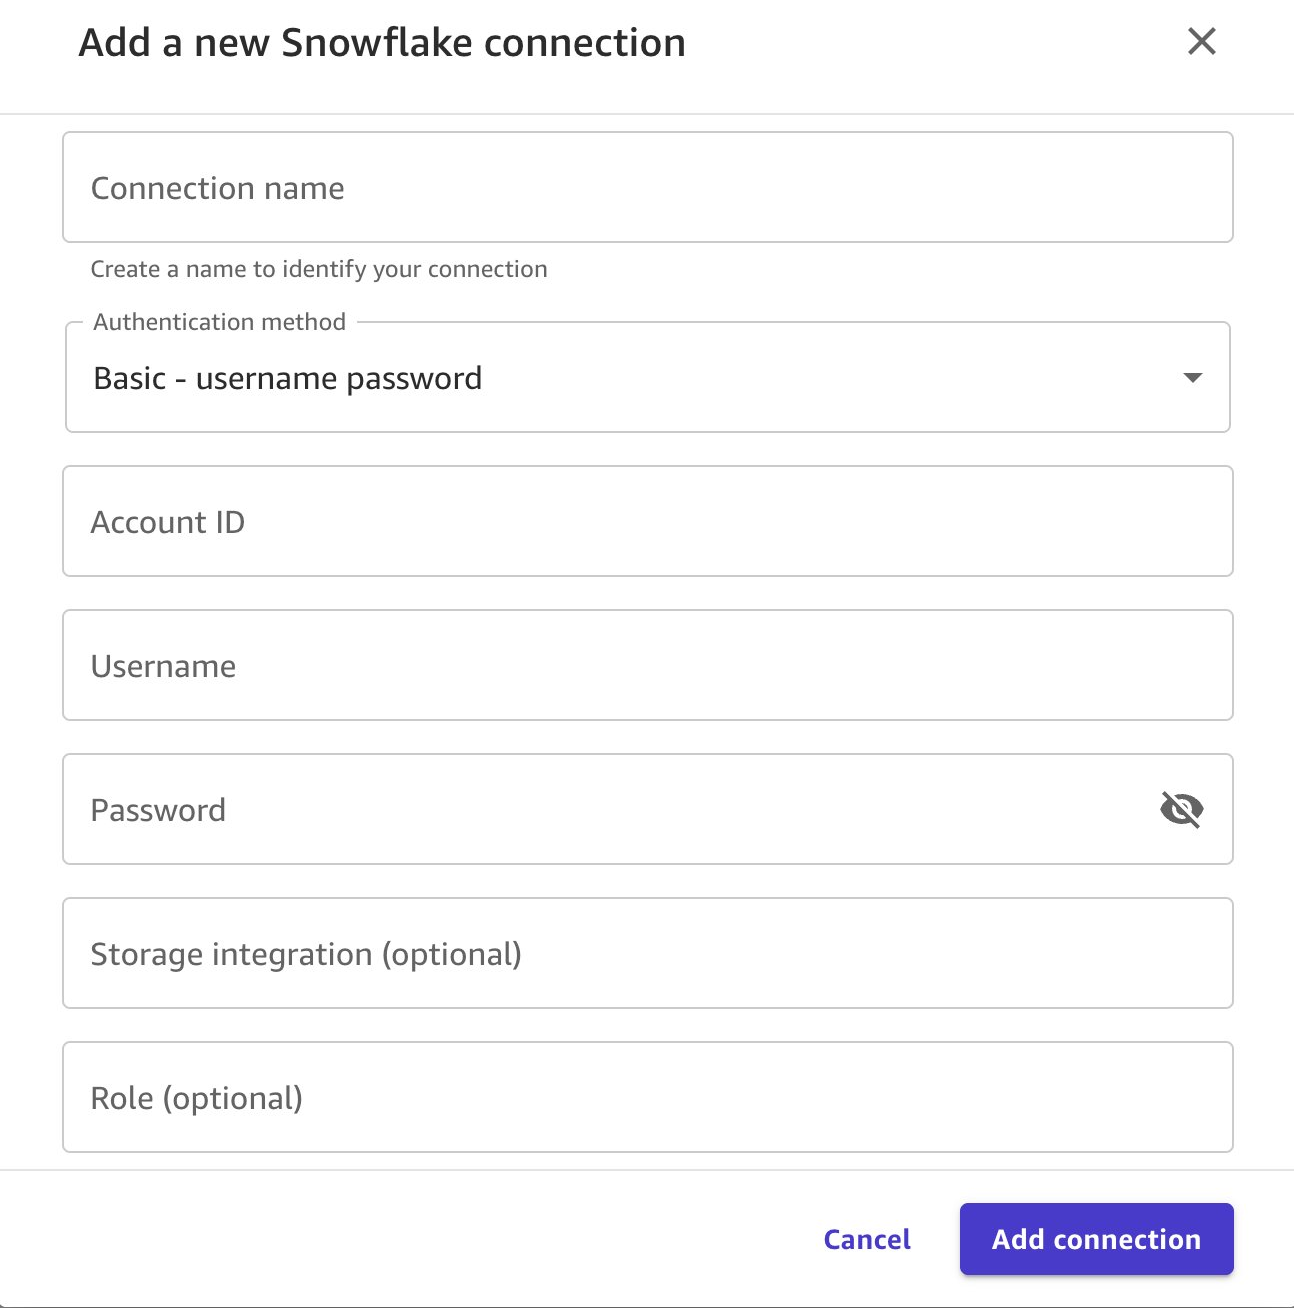
図 4: Snowflake 接続ダイアログ(接続名、アカウント ID、ユーザー名、パスワードの各フィールド)
接続が確立されたら、各クレジットカードとカテゴリの組み合わせごとにカードレベルの異常値閾値を作成し、不審な支出パターンを特定します。これにより、取引金額がカード保有者の典型的な行動から著しく逸脱した際にモデルが検知できるようになります。
不正検出用のデータセットを用意するための SQL クエリをコピーしてください。
select
CC_NUM,
CATEGORY,
avg(AMT) + (3* stddev_pop(AMT)) as amt_outlier,
case when sum(is_fraud)>1 then 1 else 0 end as fraud_history
from
FRAUD.PUBLIC.FRAUD_TABLE
where trans_date_trans_time<'2020-12-01'
group by
CC_NUM,
CATEGORY
クエリの実行: 右上隅のEdit in SQL(SQL で編集)を選択して、SQL エディターを開きます。
SQL エディターにクエリを貼り付けます。
Run SQL(SQL を実行)を選択して、クエリを実行し結果をプレビューします。
Import(インポート)を選択して、データセットを Canvas ワークスペースに取り込みます。
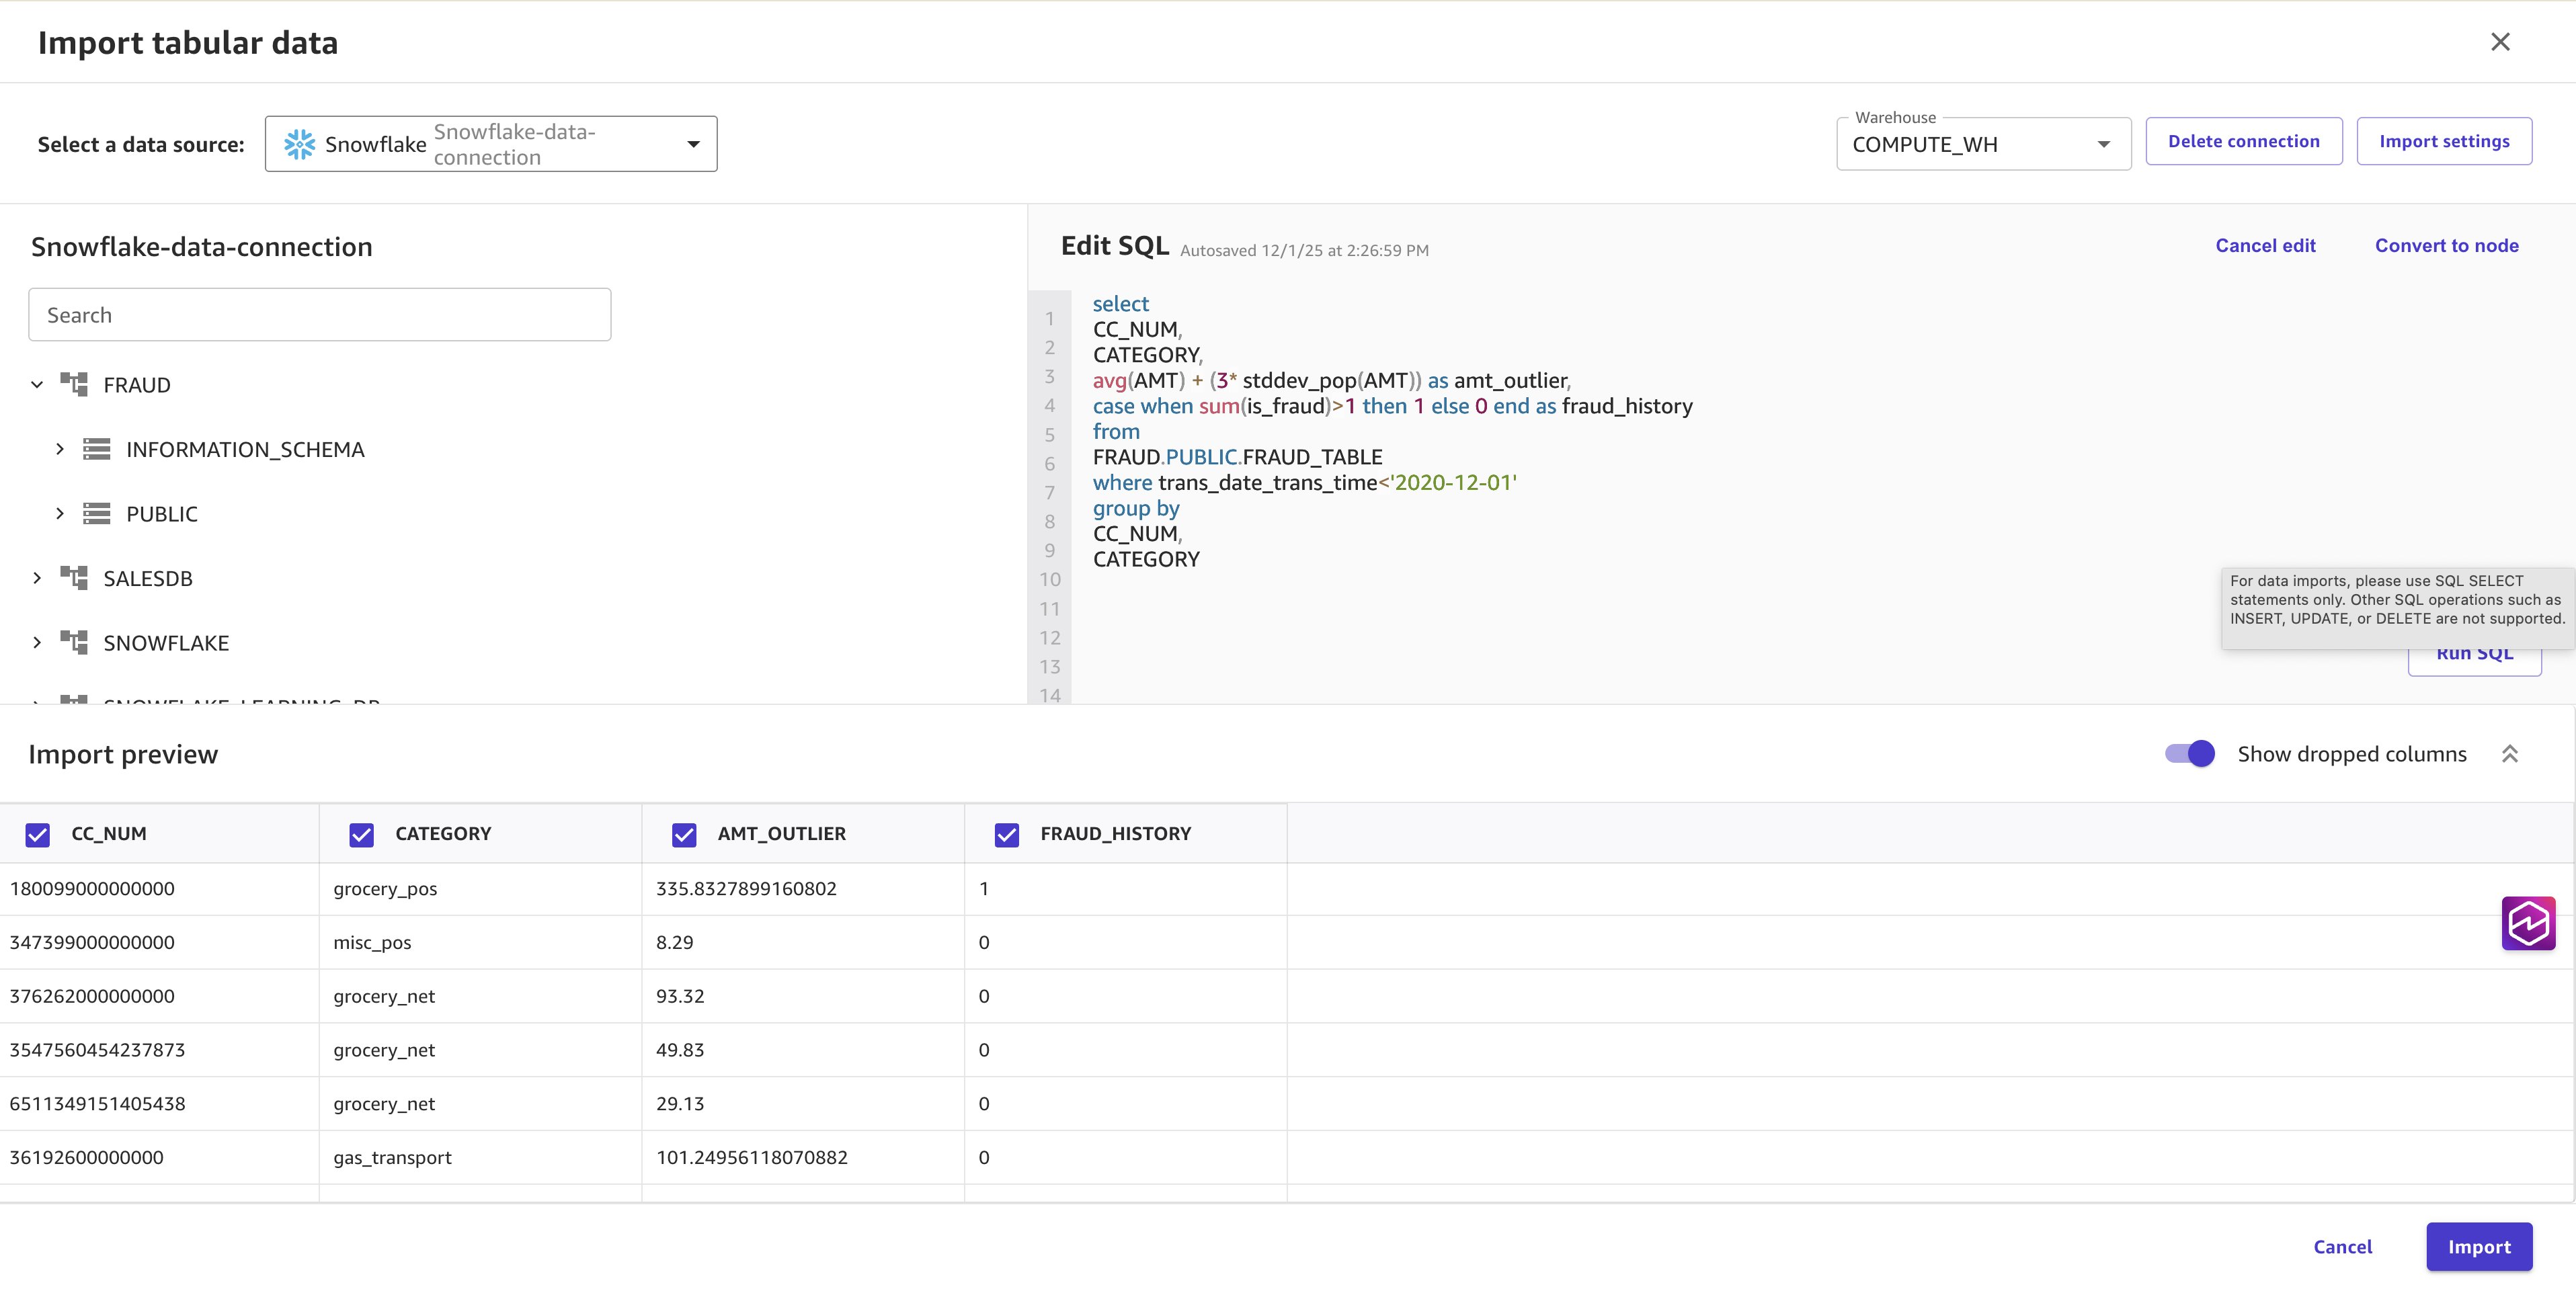
図 5: Data Wrangler の SQL エディター(インポート準備が整った異常値閾値クエリの結果)
B. データの拡張
以下の手順では、取引レベルの特徴量や店舗固有の不正指標を用いてデータセットを拡張します。
Data flow(データフロー)を選択してデータを追加します。右上隅でAdd Data(データの追加)をクリックし、Tabular(表形式)を選択してください。
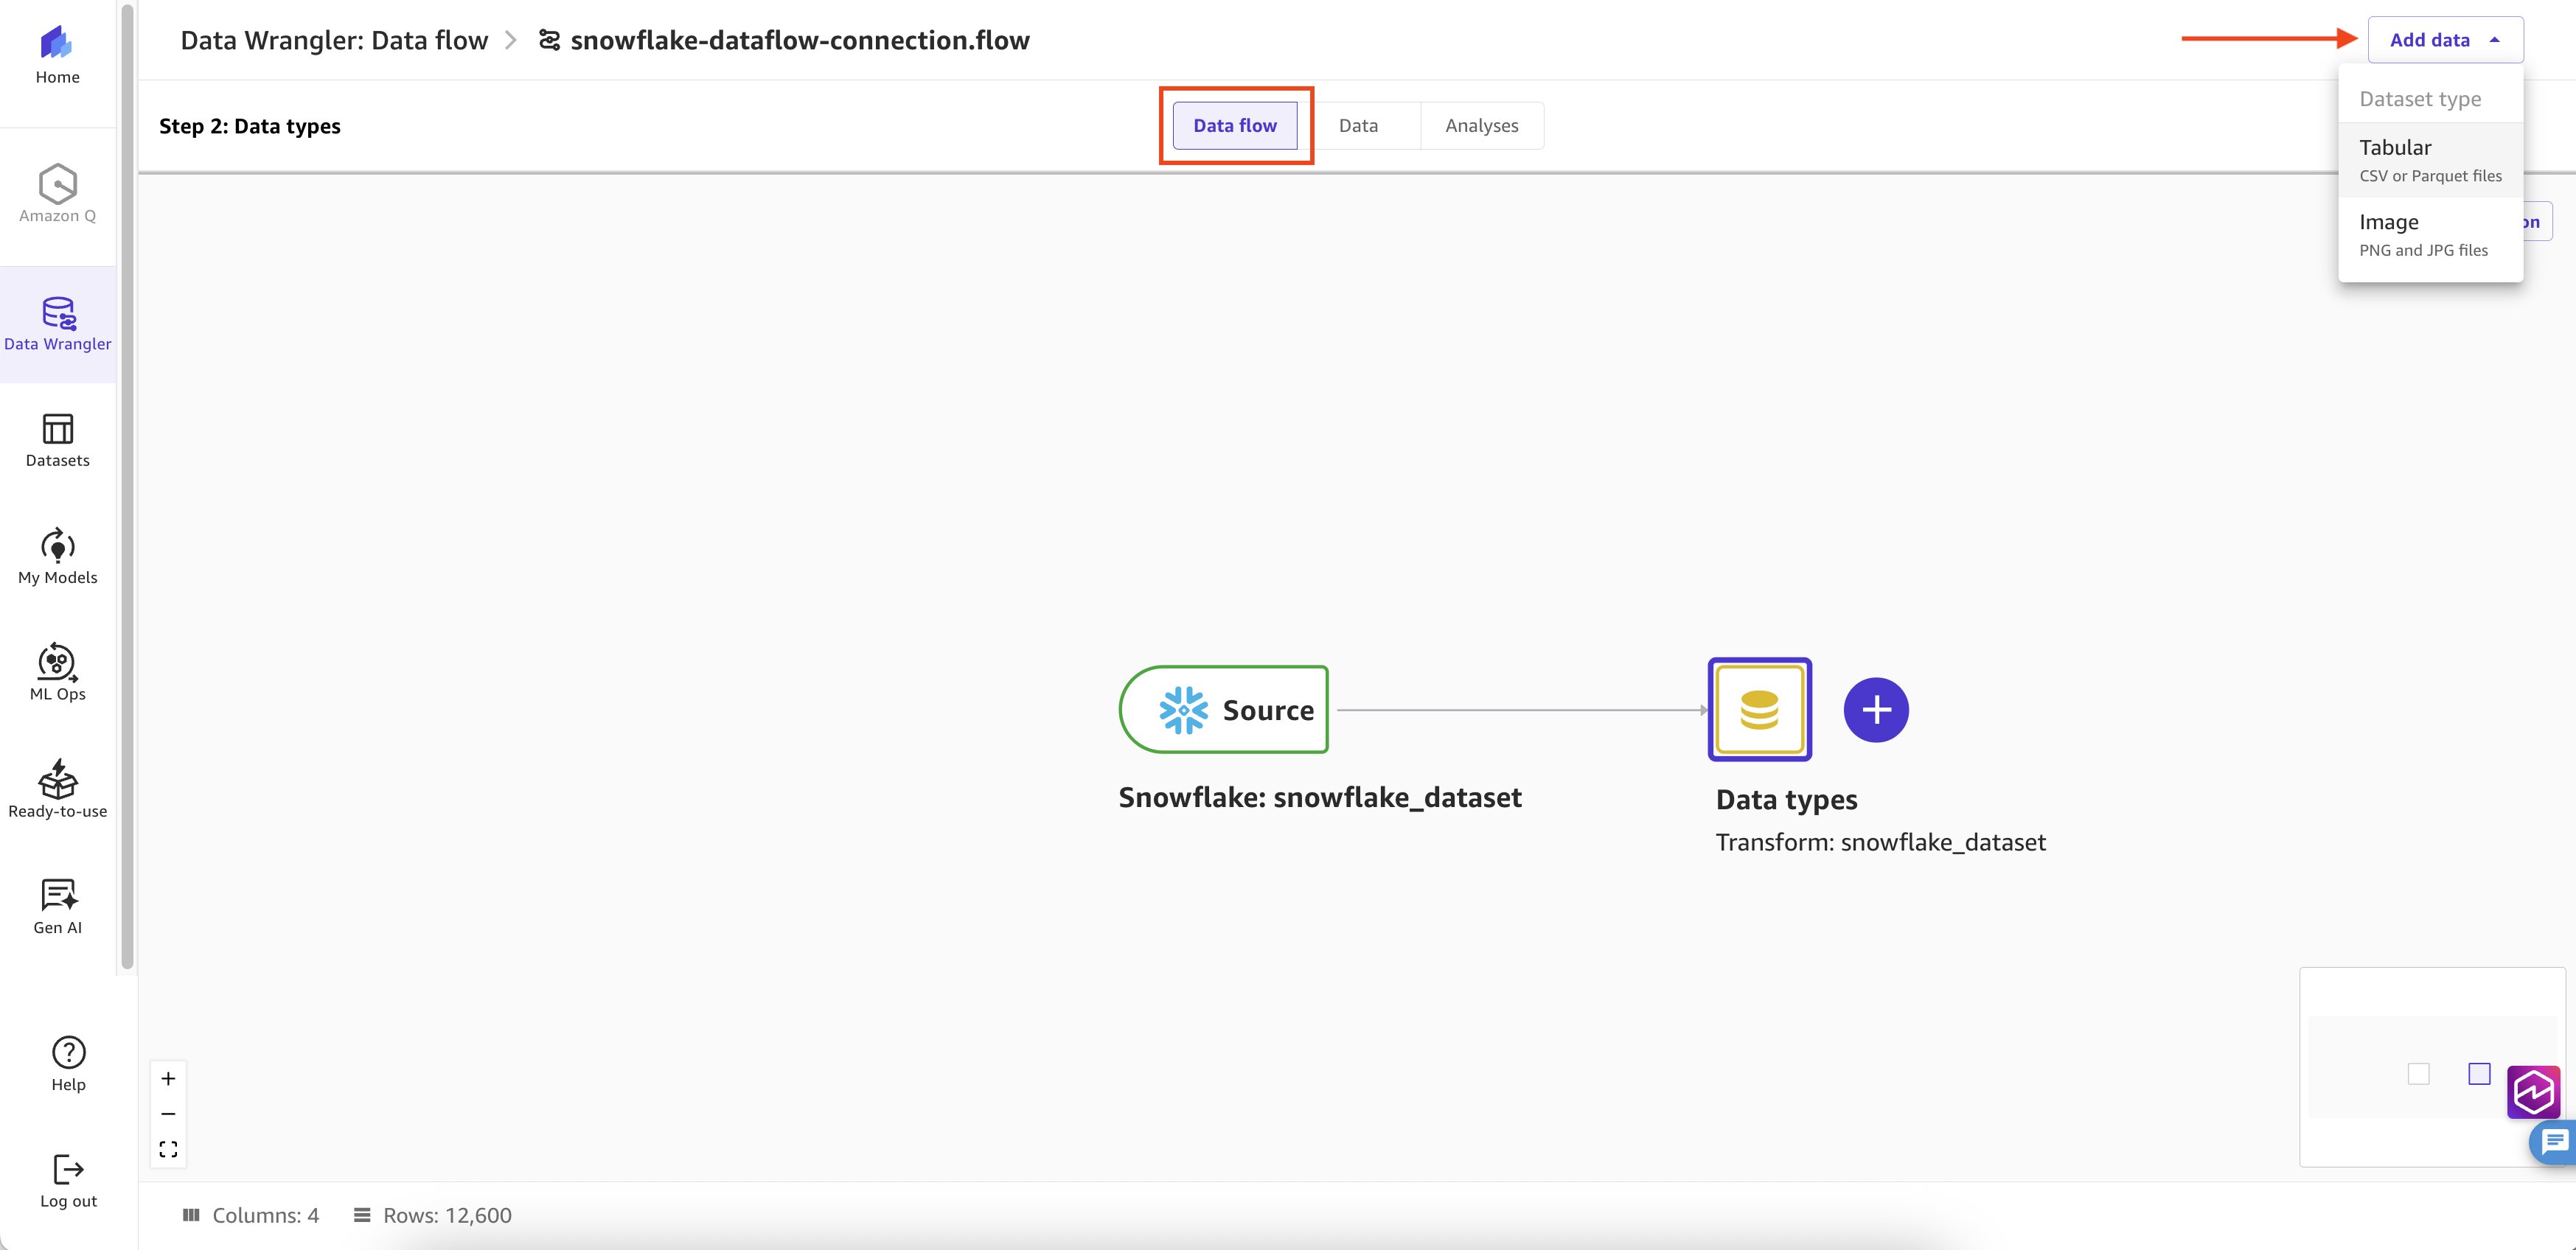
図 6:第 2 のデータソースを追加するための「Add Data」および「Tabular」オプションが表示されたデータフローキャンバス
データソースとして Snowflake を選択し、以前作成した既存の接続を使用します。
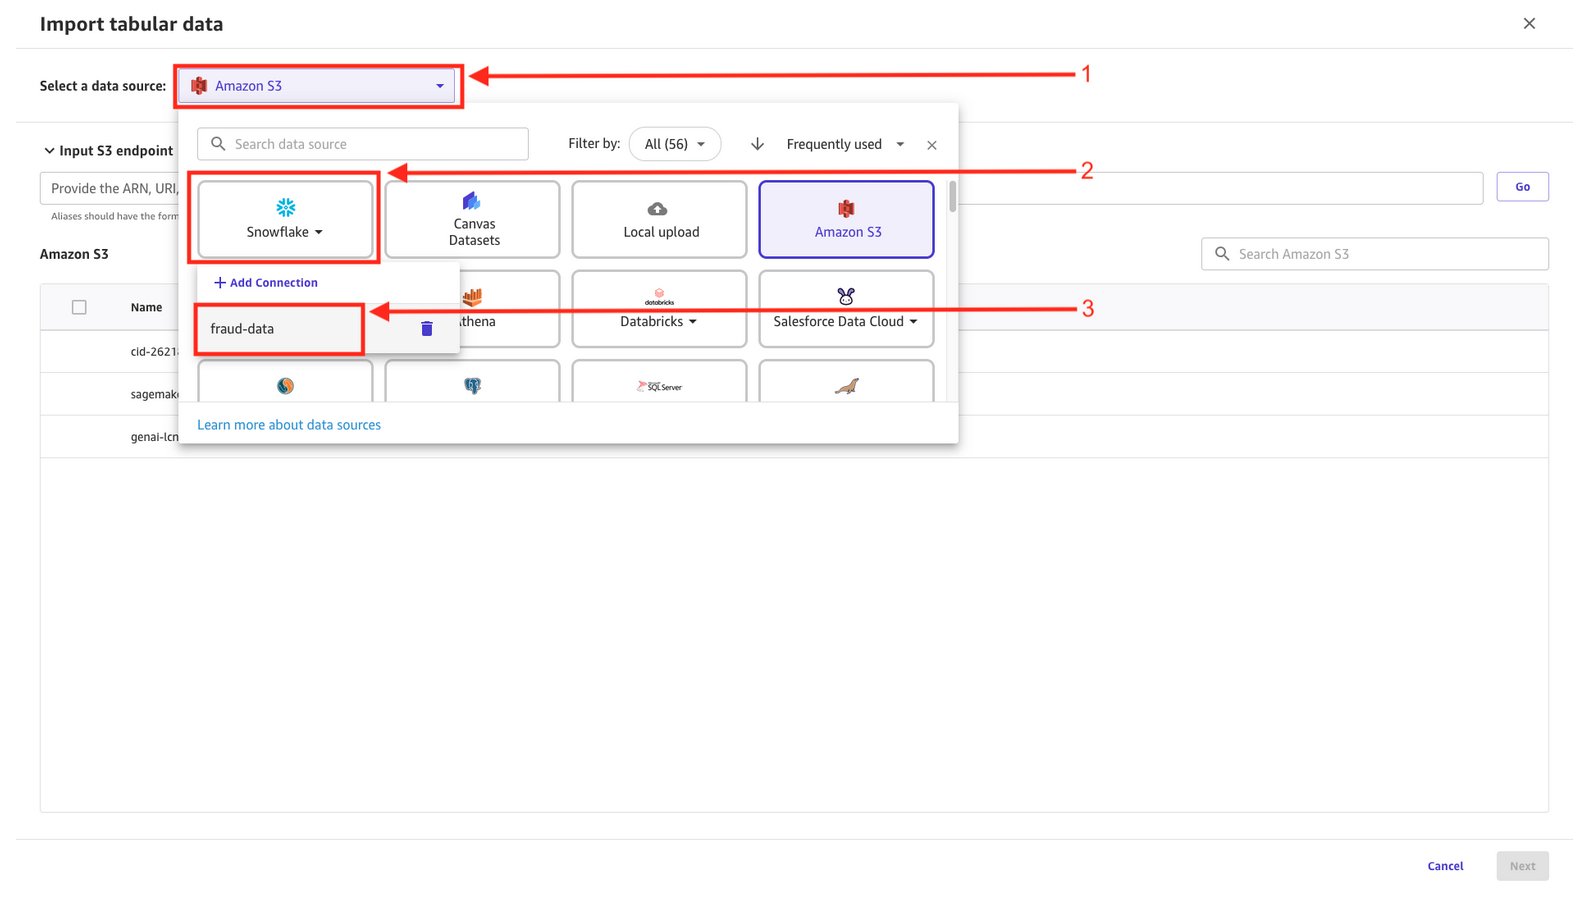
図 7:第 2 のデータソース用の既存の Snowflake 接続を選択する画面
Edit SQLウィンドウに、SQL クエリを貼り付けます。このクエリには、不正検出において重要なシグナルとなる、時刻や曜日といった時間的パターン(hour of day, day of week)、年齢層などの人口統計情報、そして店舗レベルの異常値閾値が含まれています。Run SQLを選択して実行し、その後Importをクリックします。
select
    t.MERCHANT,
    t.CC_NUM,
    'H'||extract(hour from t.TRANS_DATE_TRANS_TIME) as TRANS_HOUR,
    'D'||extract(dow from t.TRANS_DATE_TRANS_TIME) as TRANS_DOW,
    t.state,
    t.gender,
    'A'||FLOOR(DATEDIFF(YEAR, DATEADD(DAY, 1, CAST(t.dob AS DATE)), CAST(t.TRANS_DATE_TRANS_TIME AS DATE)) / 5) * 5 AS age_category,
    t.CATEGORY,
    t.IS_FRAUD,
    t.AMT,
    m.merchant_amt_outlier,
    m.merchant_fraud_history
from
    FRAUD.PUBLIC.FRAUD_TABLE t
left join (
    select
        MERCHANT,
        avg(AMT) + (3* stddev_pop(AMT)) as merchant_amt_outlier,
        case when sum(is_fraud)>1 then 1 else 0 end as merchant_fraud_history
    from
        FRAUD.PUBLIC.FRAUD_TABLE
    where trans_date_trans_time<'2020-12-01'
    group by MERCHANT
) m on t.MERCHANT = m.MERCHANT
where t.trans_date_trans_time<'2020-12-01'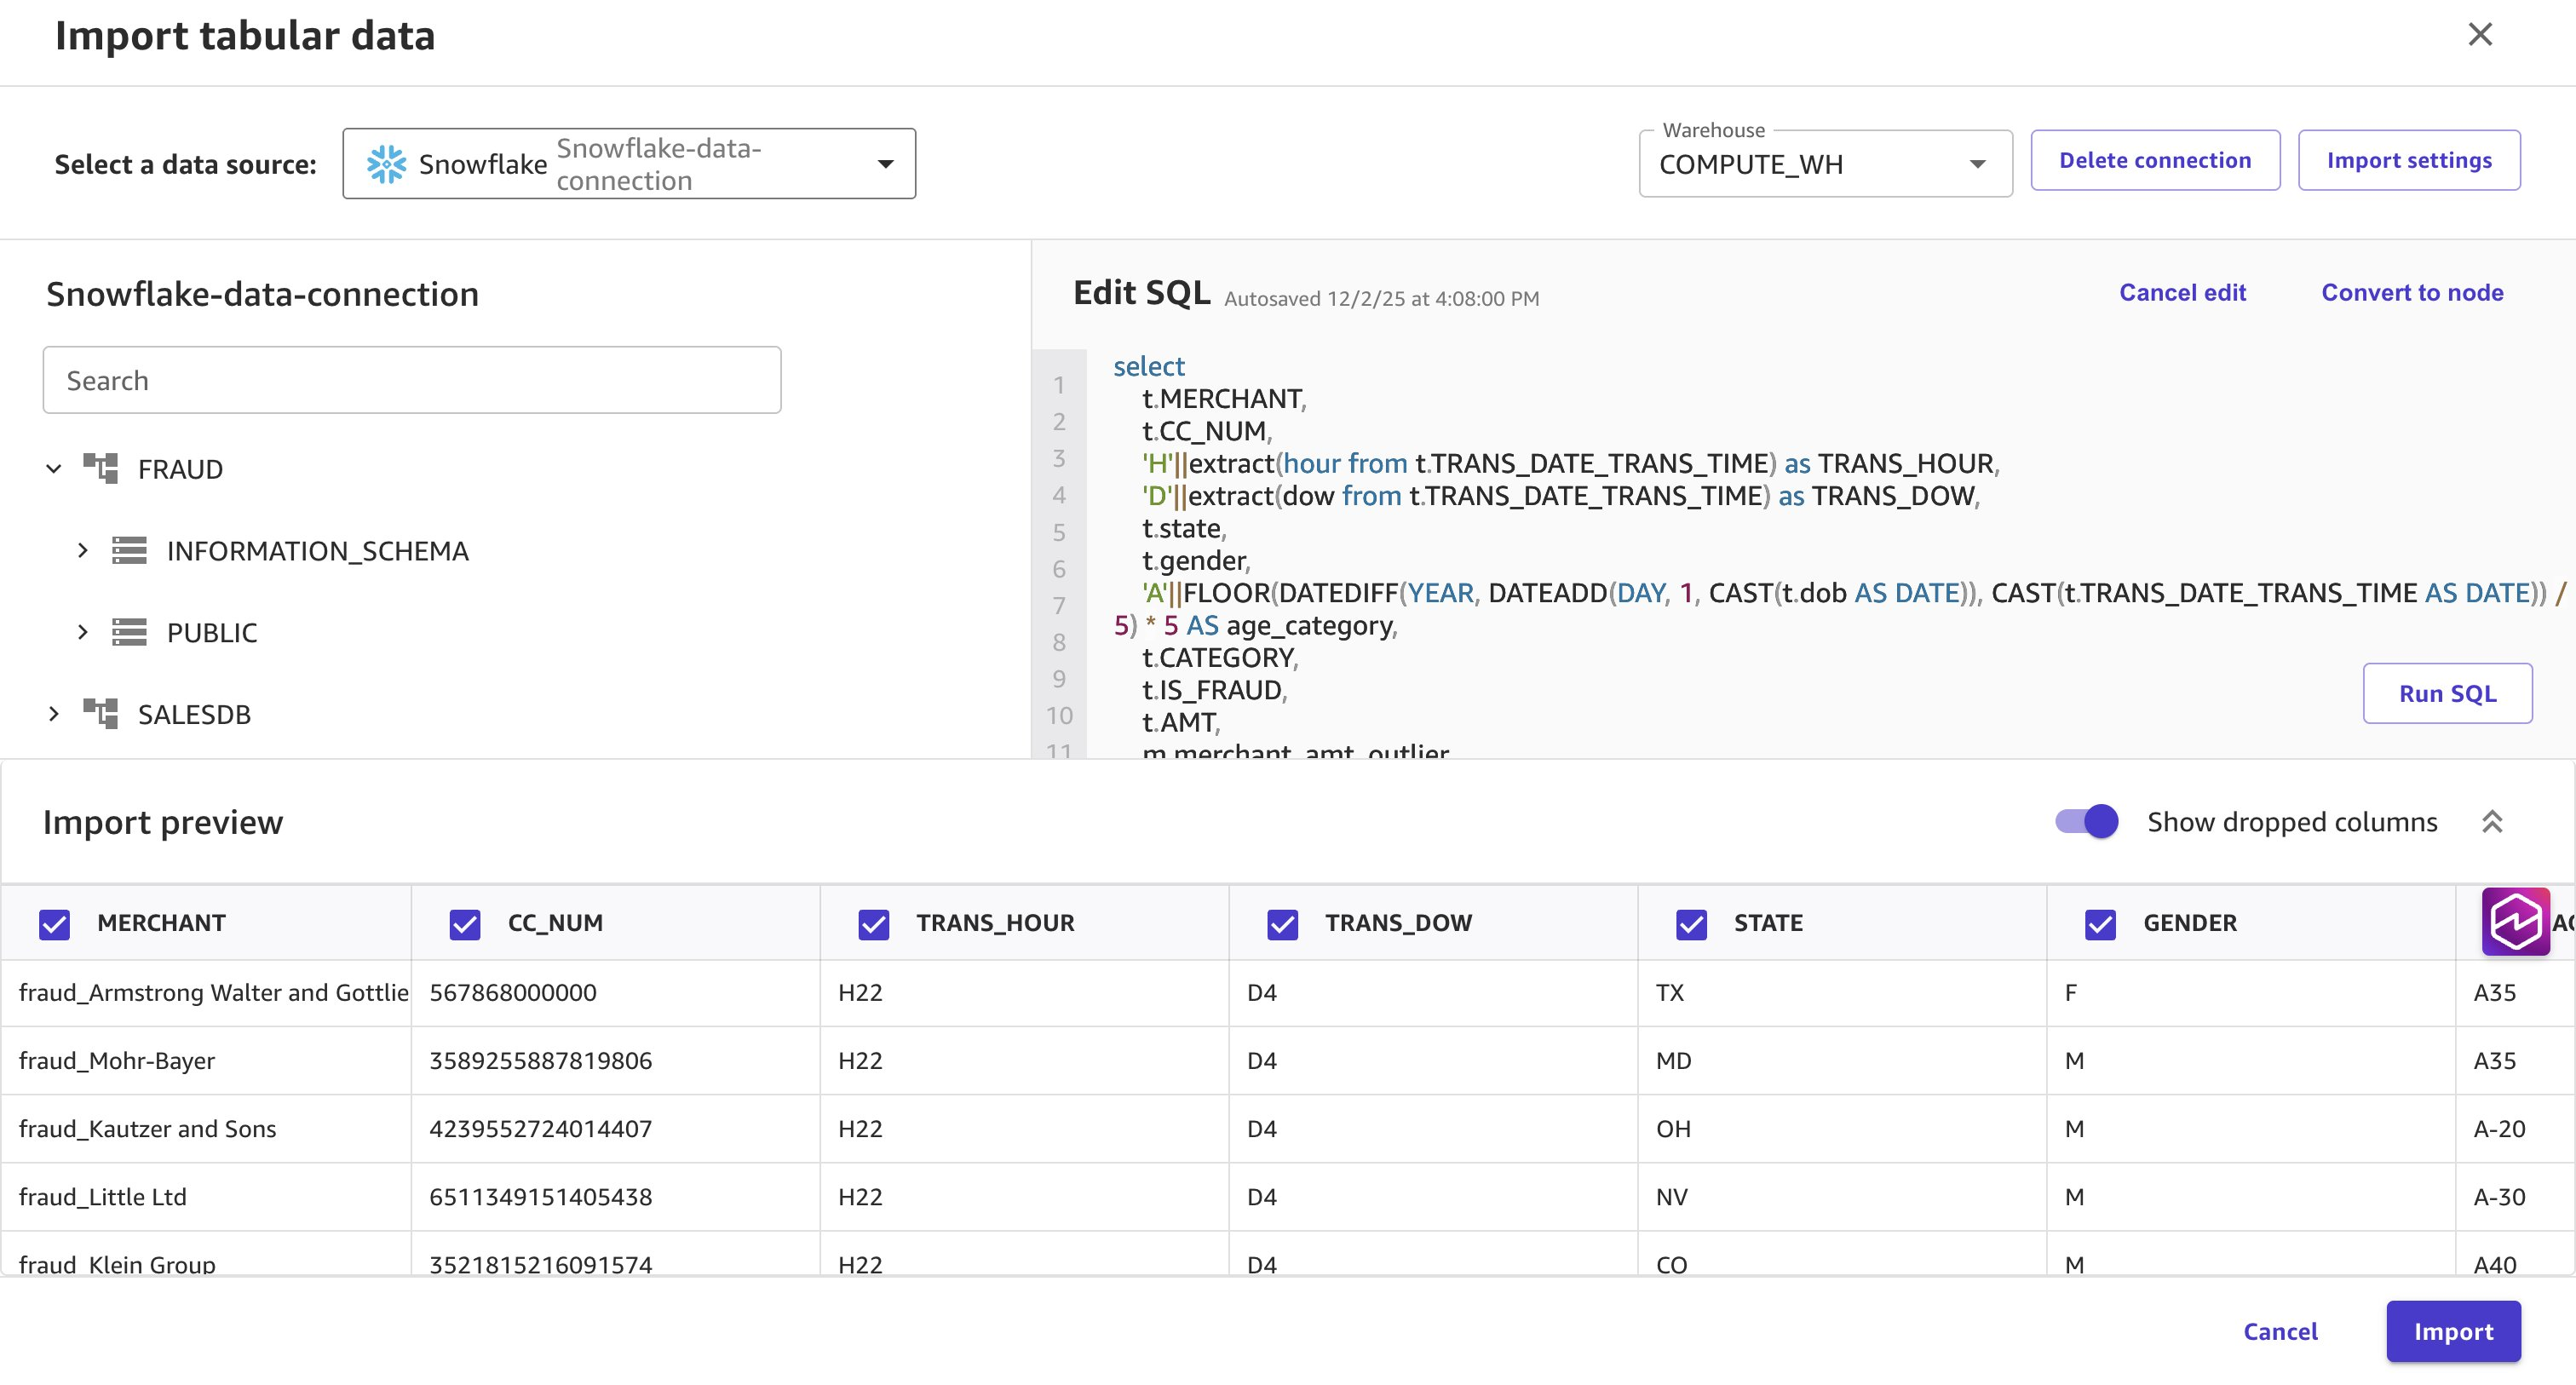
図 8:時間的、人口統計的、店舗関連の特徴を含むエンリッチメントクエリの Data Wrangler プレビュー
C. データ変換
このセクションでは、複数のデータを結合します。
「データフロー」画面では、Snowflake からインポートされた 2 つのデータソースが表示されます。最初のデータタイプを選択し、その横にあるプラスアイコンをクリックします。「データの結合」を選択して「結合(Join)」を実行します。右側のパネルが開いたら、データフローから結合対象となる 2 つ目のデータタイプを選択してください。
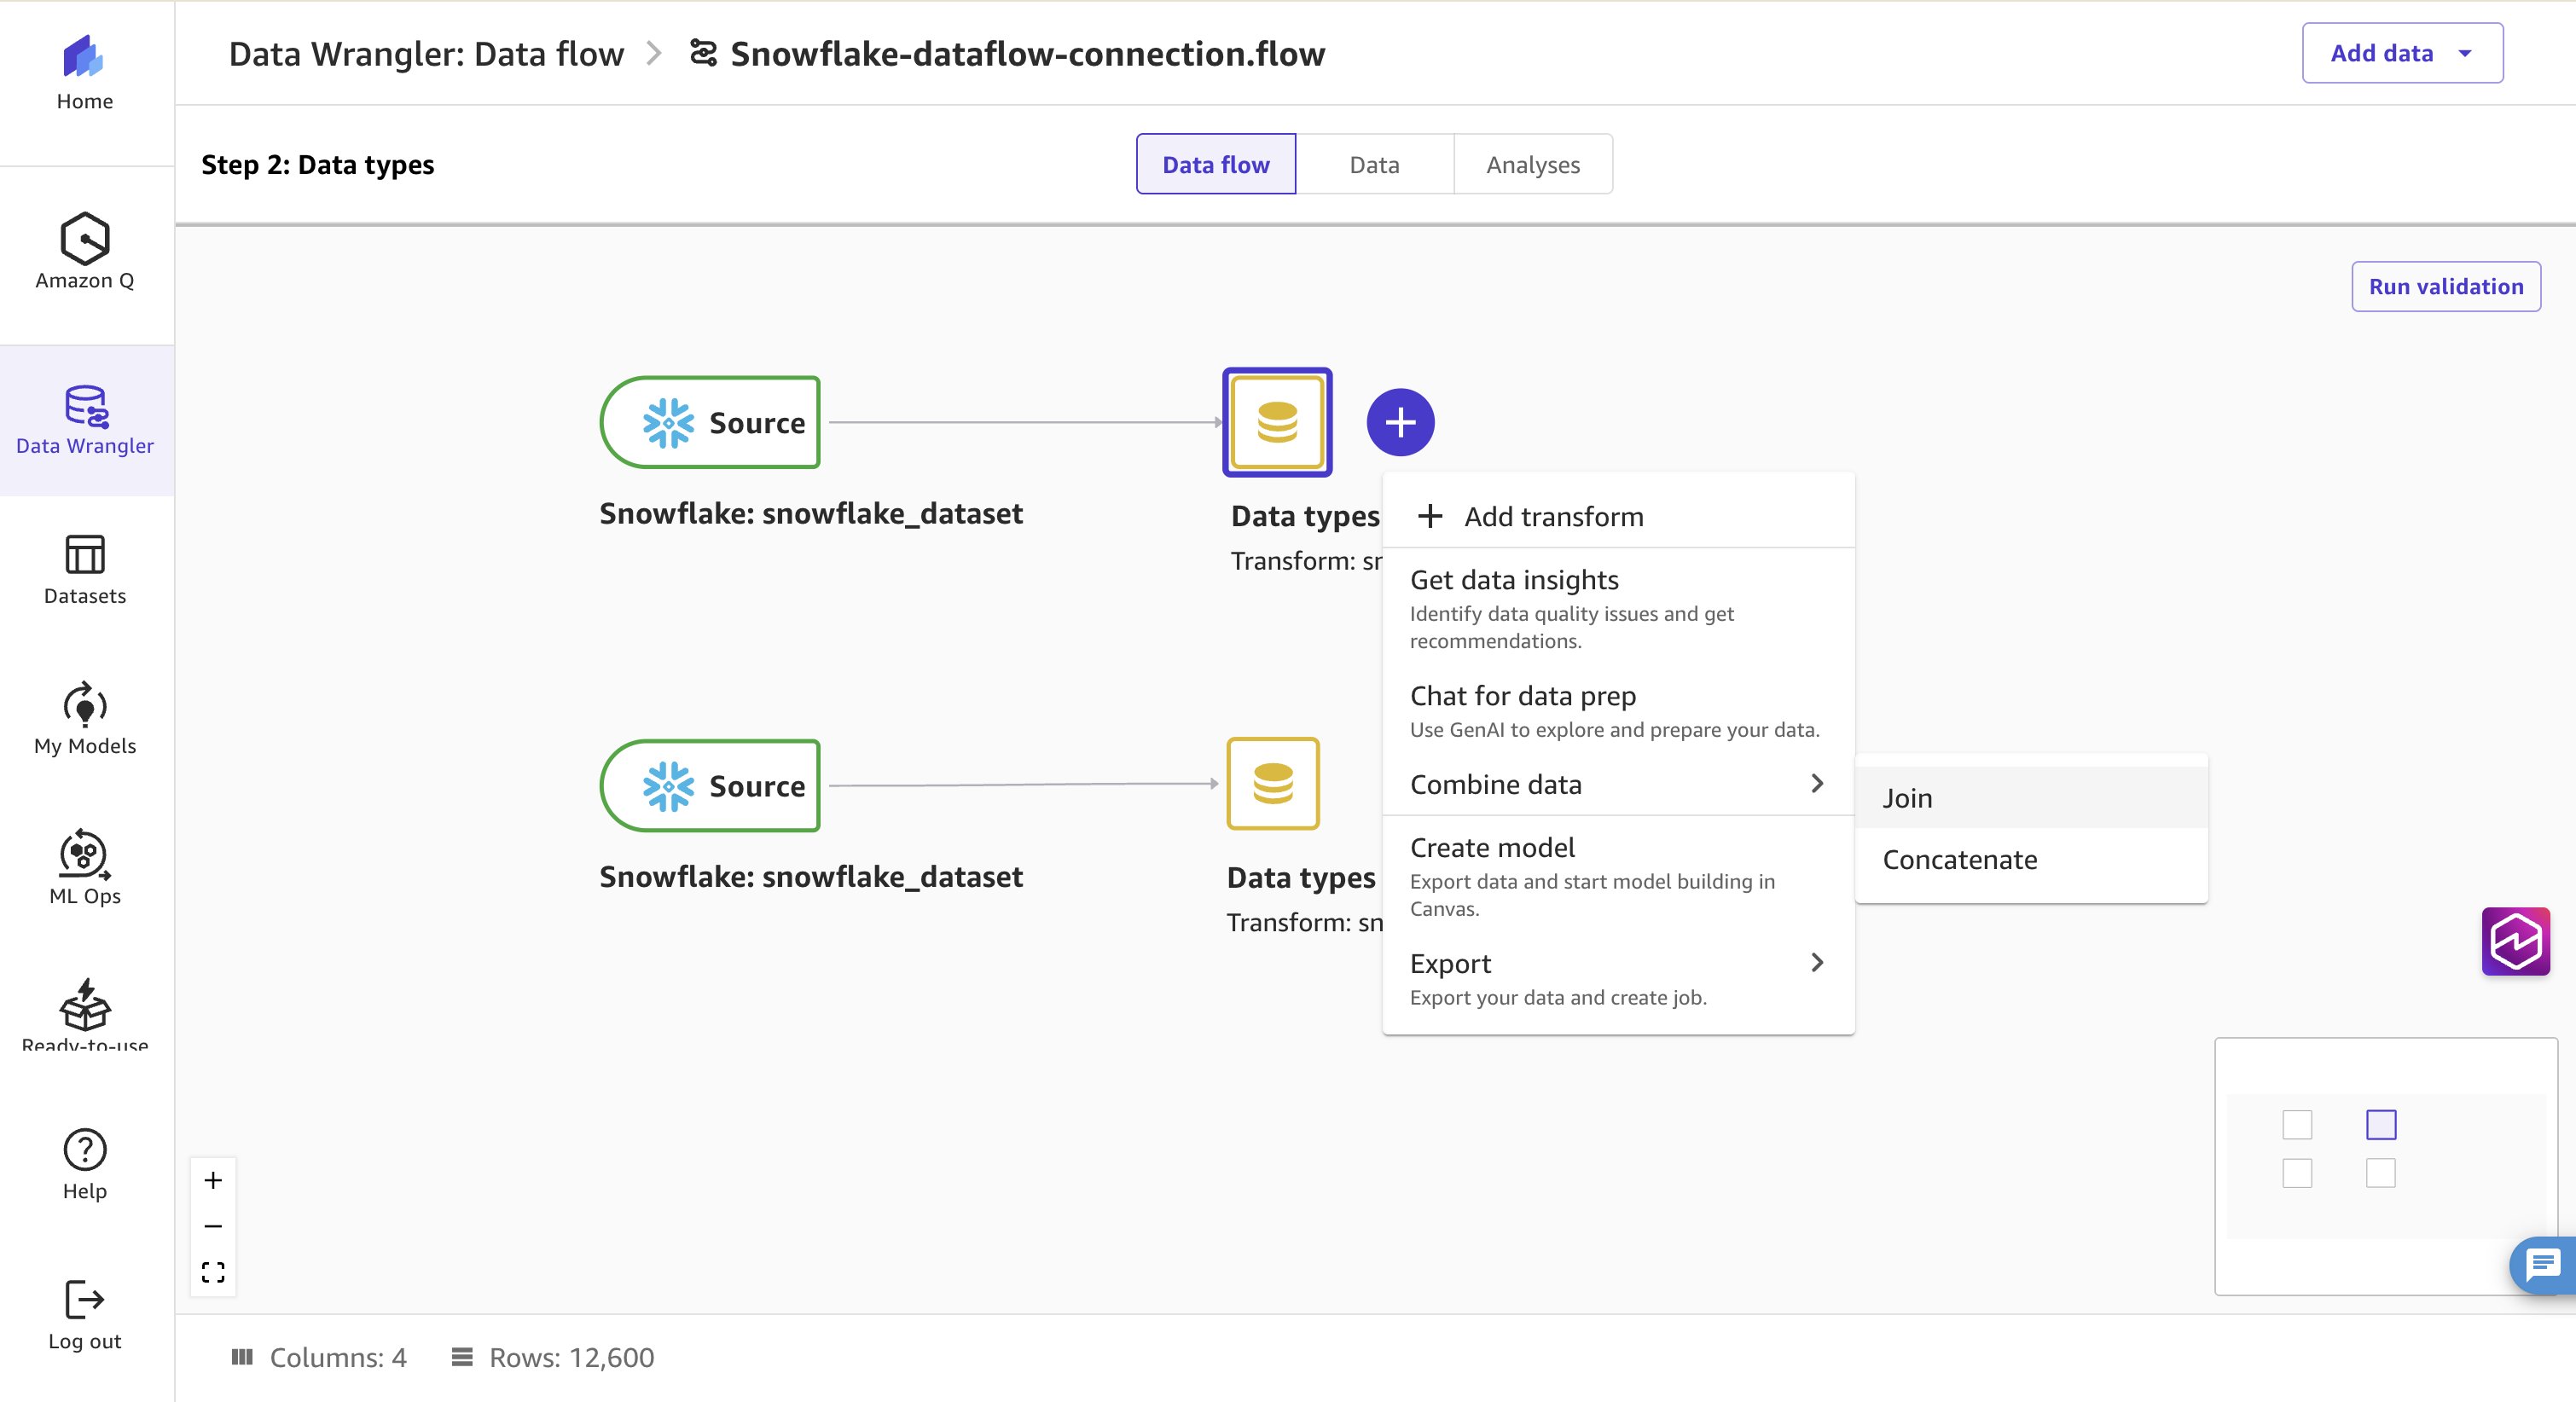
図 9: Snowflake の 2 つのソース間で「データの結合」および「結合」オプションを示すデータフロー
「結合タイプ」として「左外部結合(Left outer join)」を選択します。次に「結合キー」を追加し、左右ともに「Category」を指定してください。
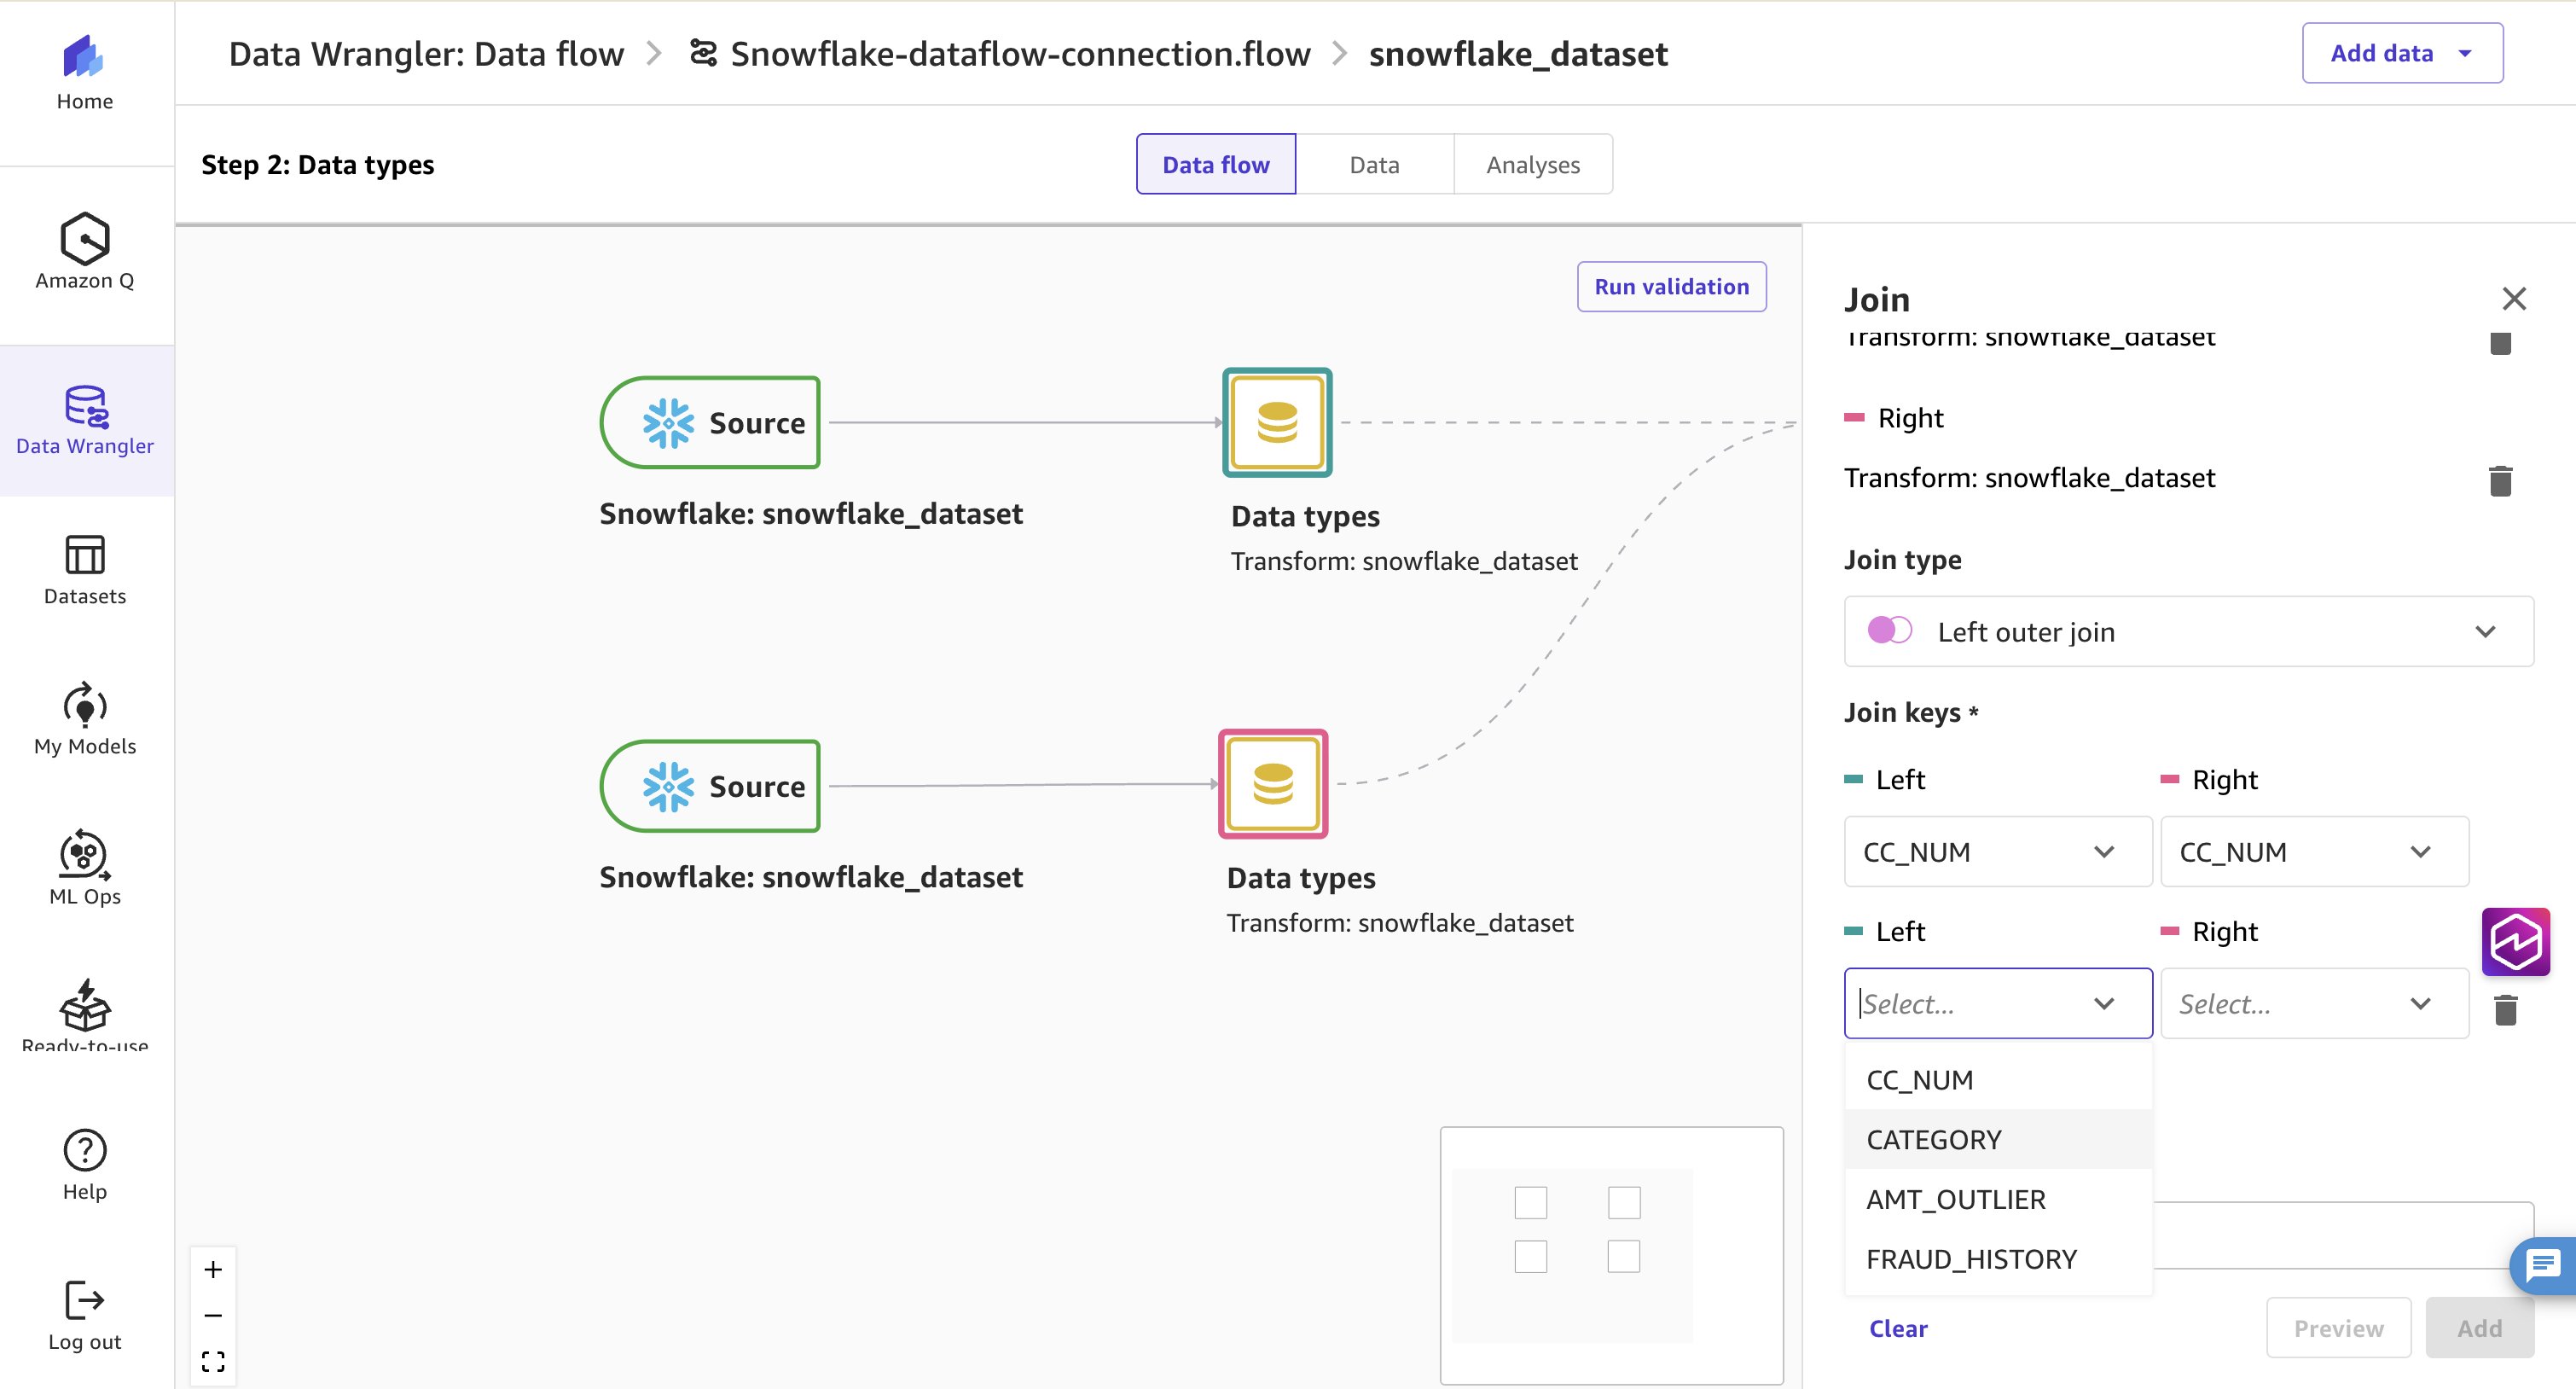
図 10: 結合タイプに「左外部結合」を、結合キーに「Category」を設定した構成画面
「プレビュー」をクリックして結合後のデータを確認し、「追加(Add)」ボタンを押して次のステップへ進みます。
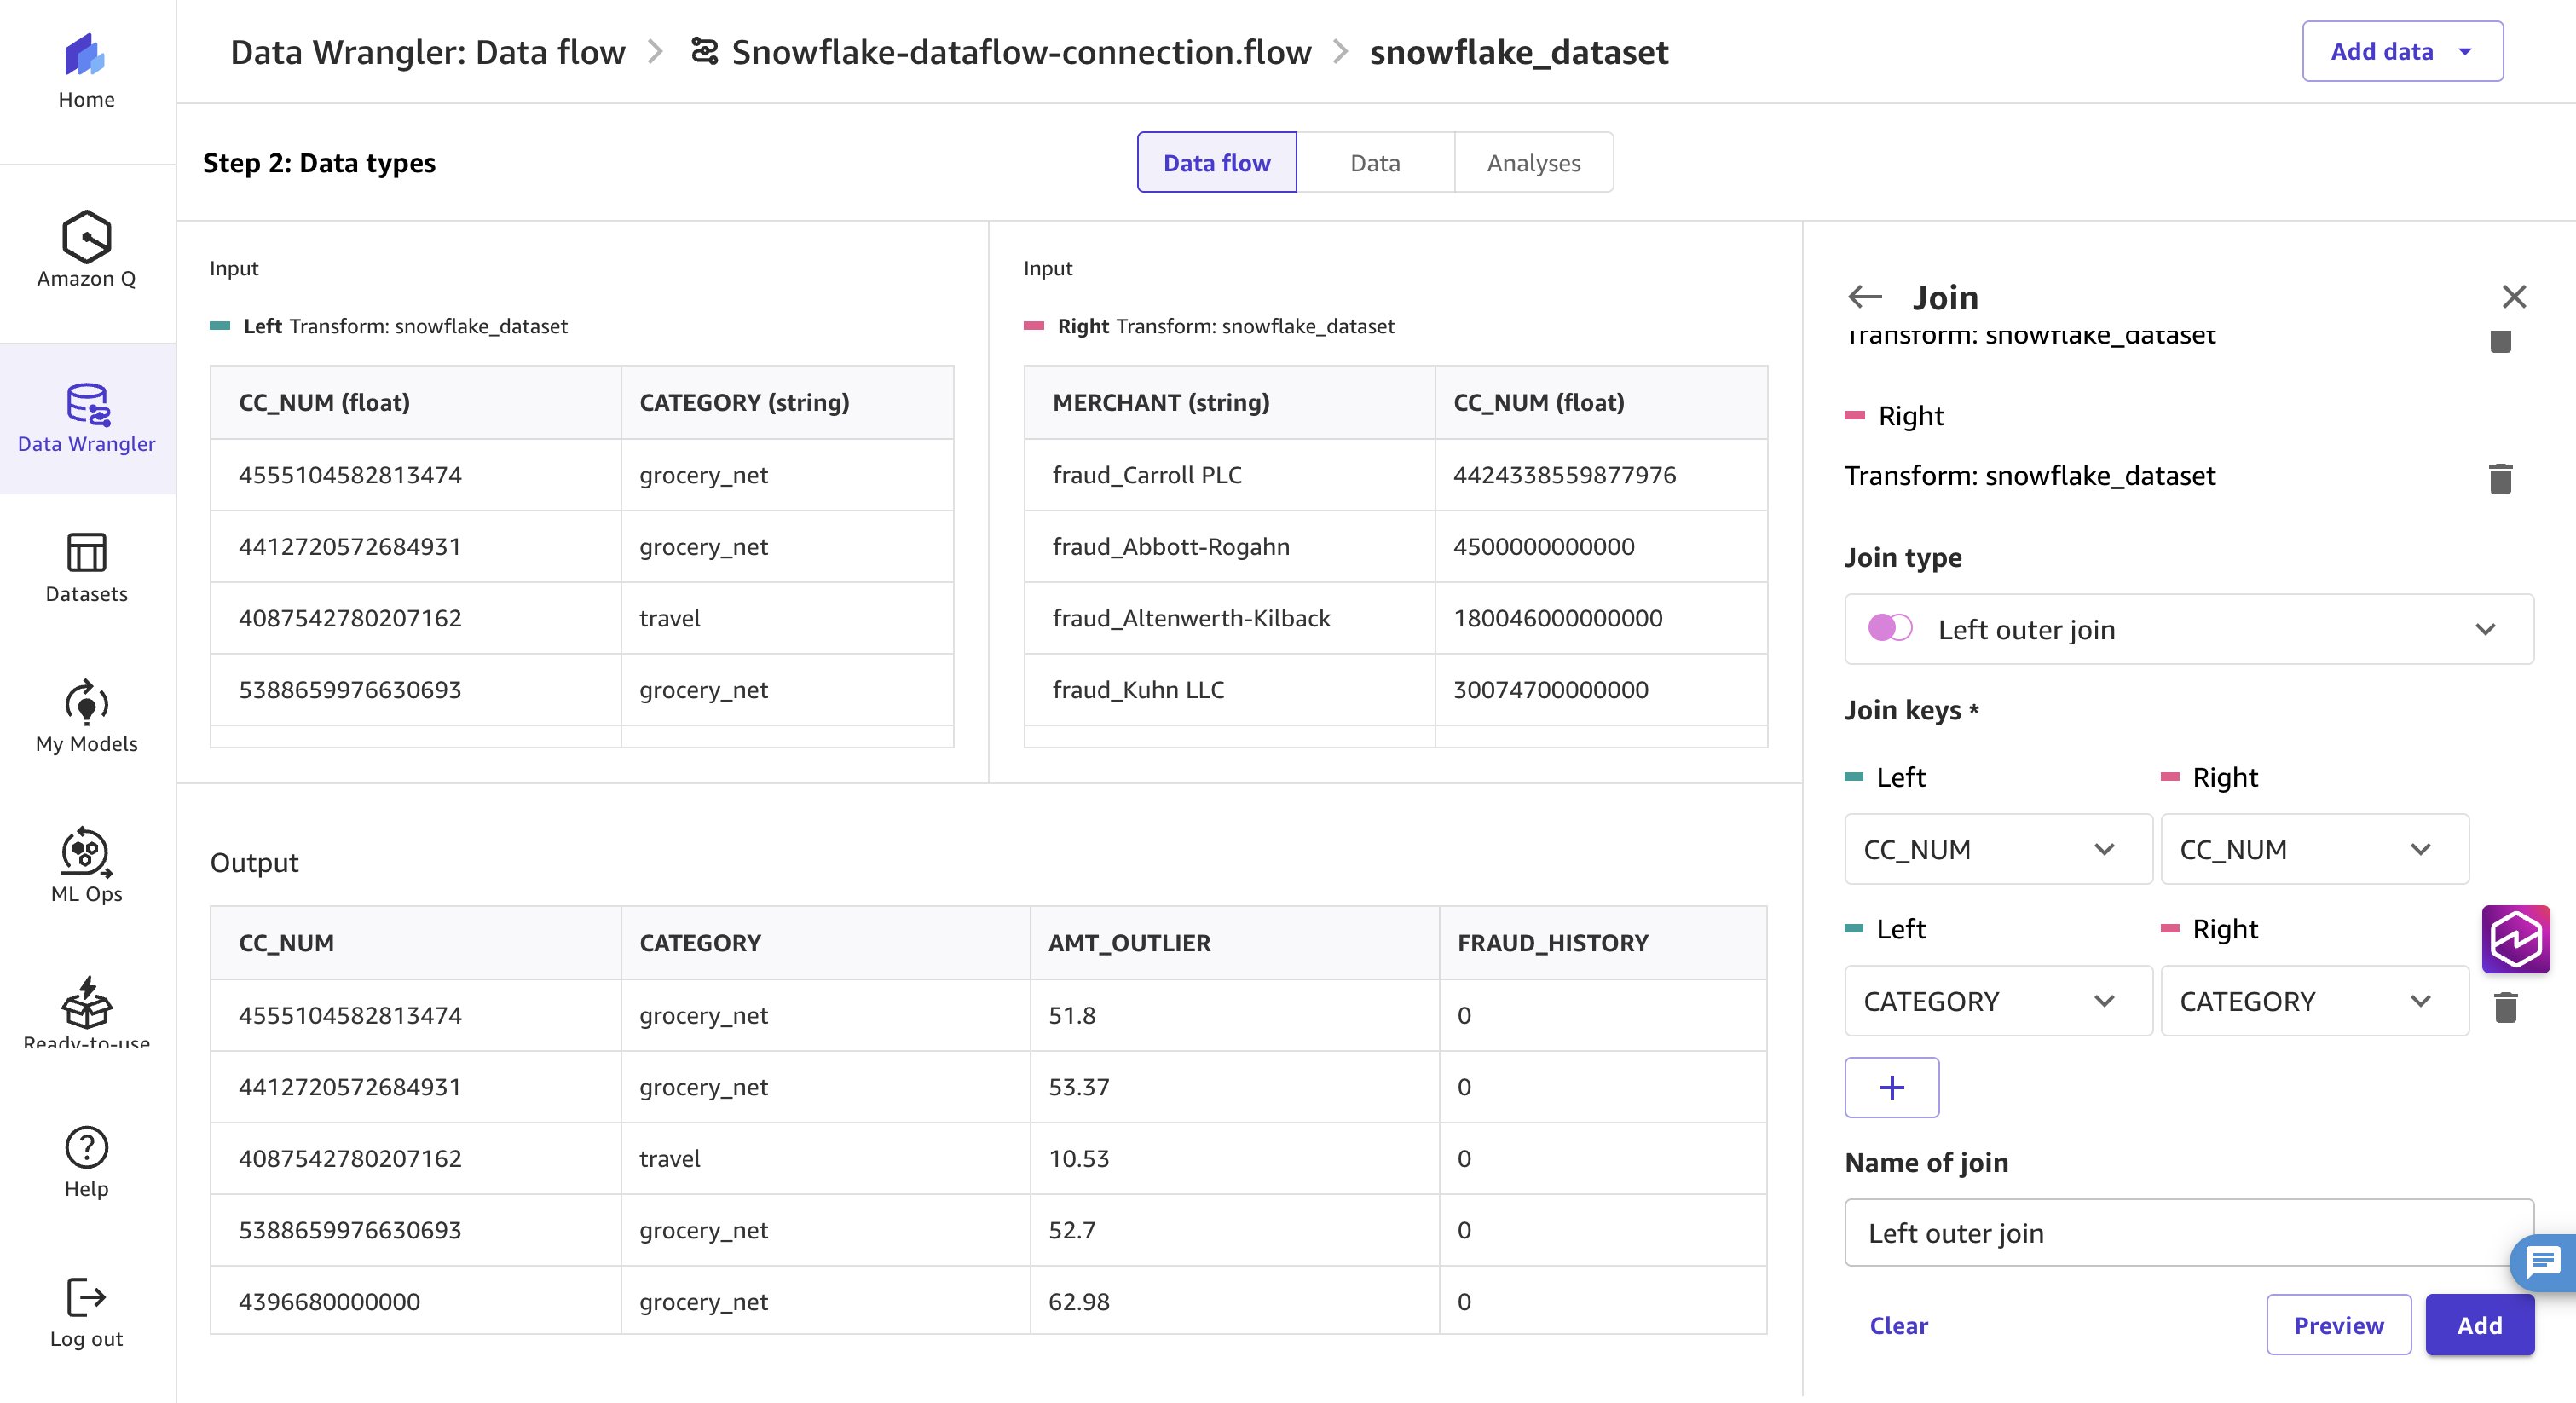
図 11: データフローに追加する前の結合済みデータセットのプレビュー
次に、外れ値を検出するための特徴量を作成し、機密性の高い列を削除します。
「データフロー」画面に戻り、結合ノードを選択してその隣にあるプラス記号(+)をクリックし、変換の追加を選択します。
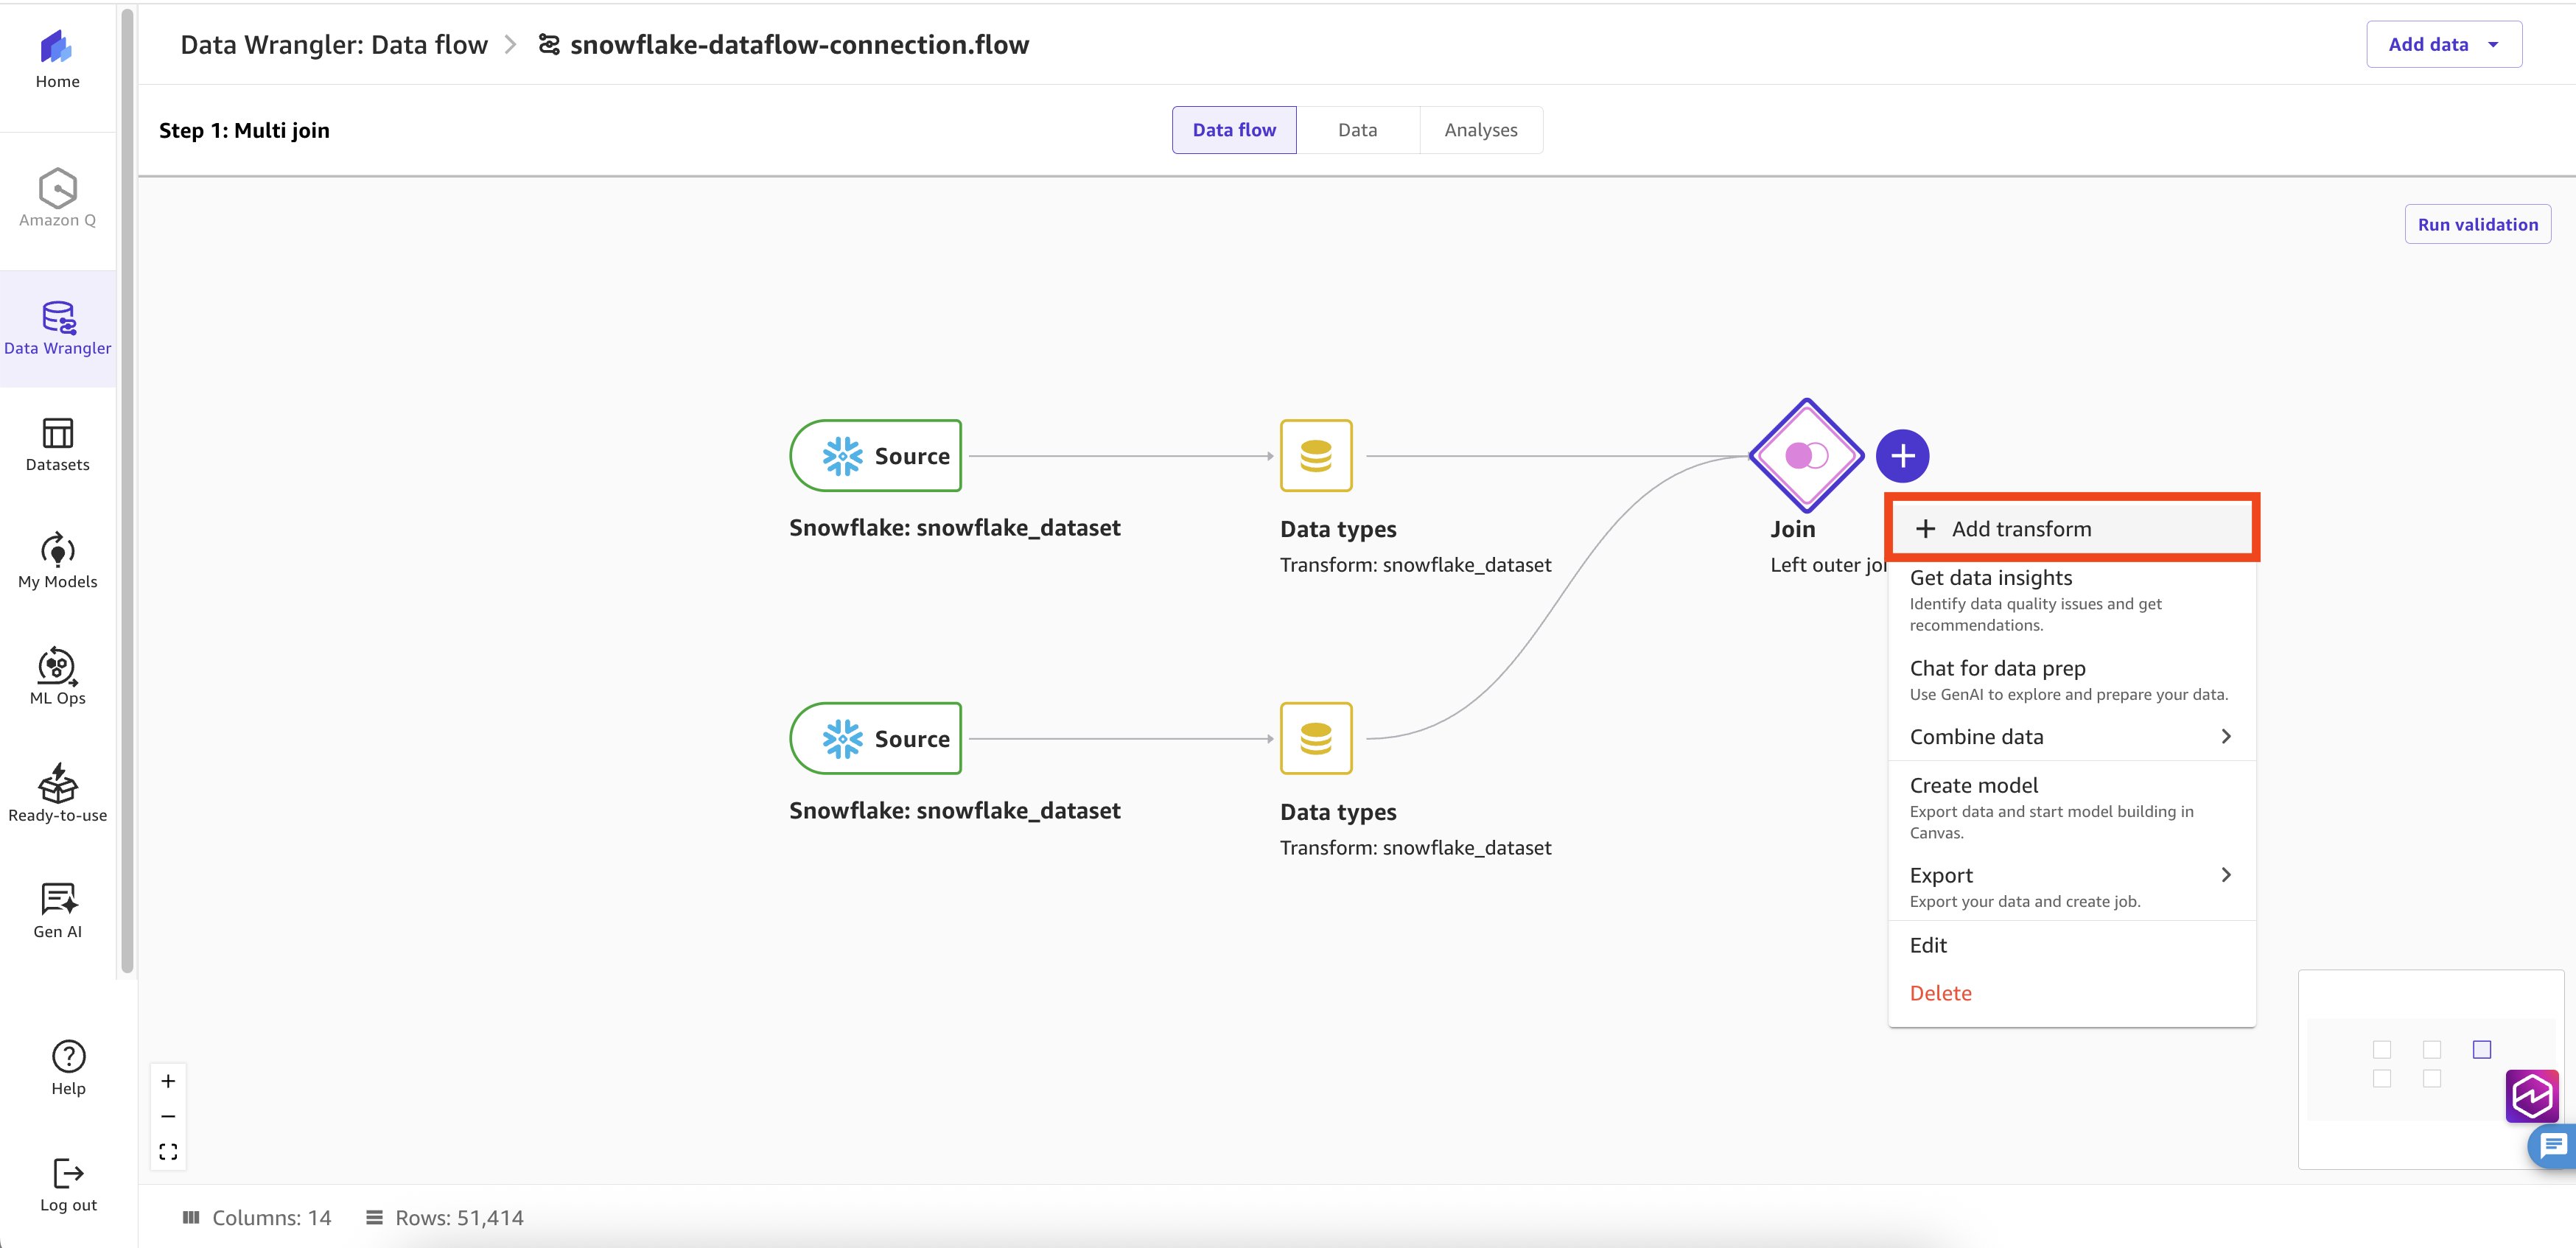
図 12: データフロー内の結合ノードへの変換の追加
インターフェースが開いたら、右側のパネルで変換の追加を選択し、カスタム数式をクリックします。
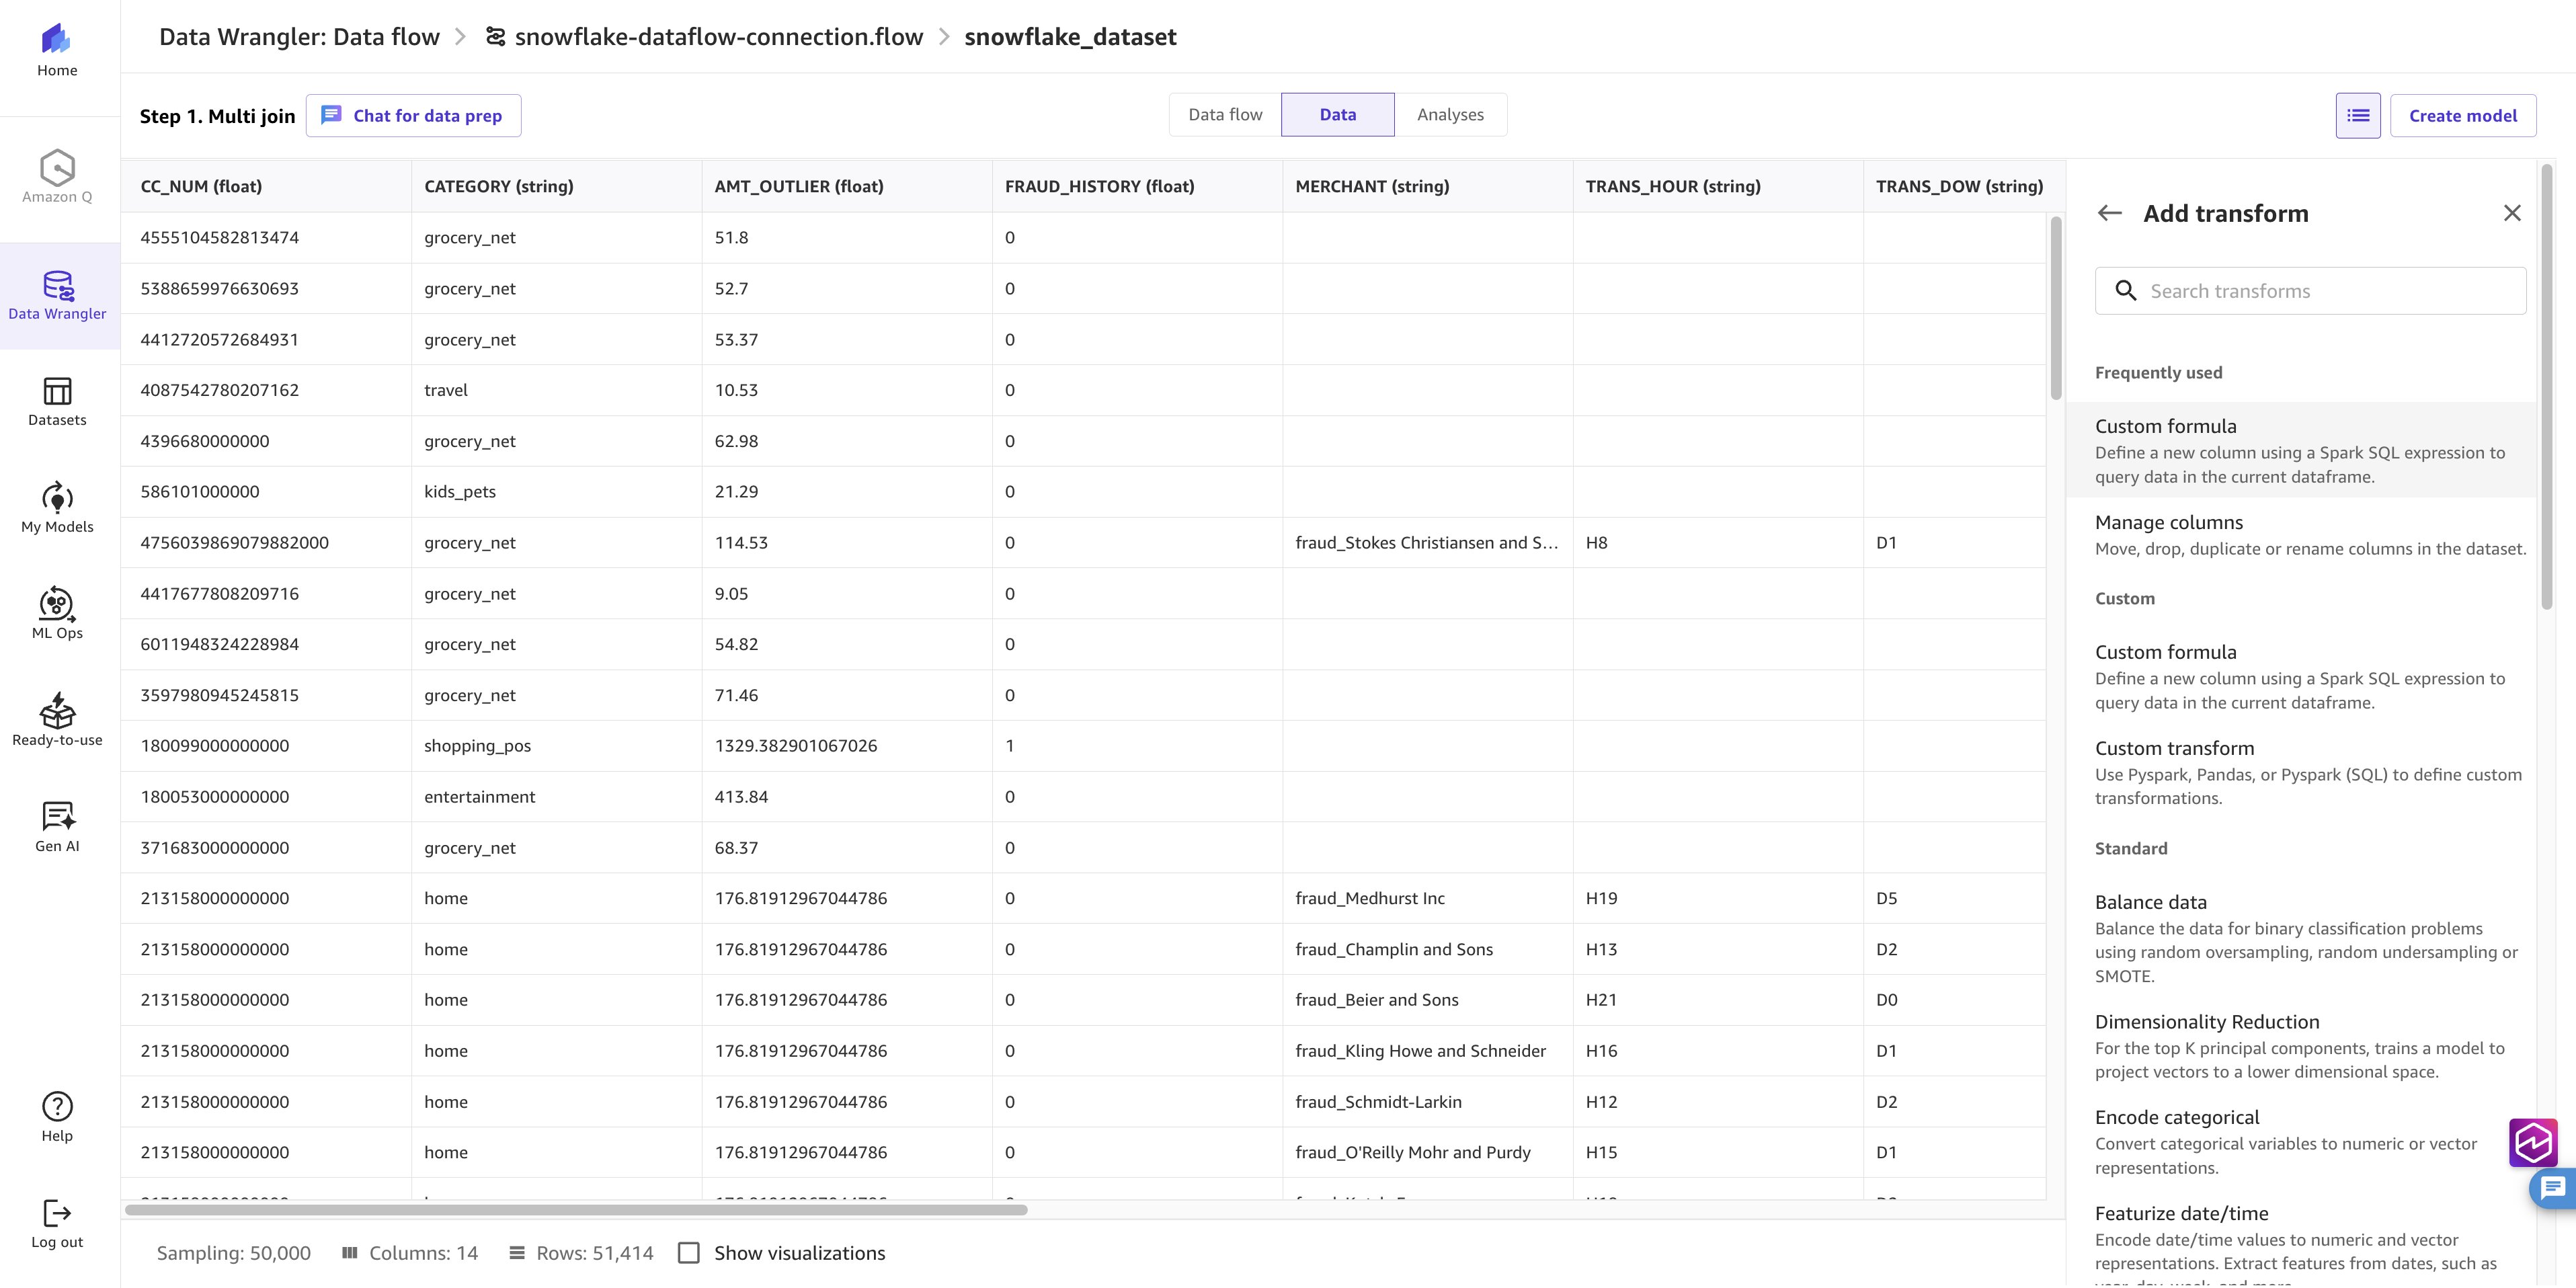
図 13: 変換追加パネルでのカスタム数式の選択
このオプションを使用すると、Spark SQL 式を使って列を追加できます。ホームタブにある以下の数式をコピーして貼り付けます。出力列には CC_FLAG を入力し、追加をクリックします。
CASE WHEN AMT > AMT_OUTLIER THEN 1 ELSE 0 END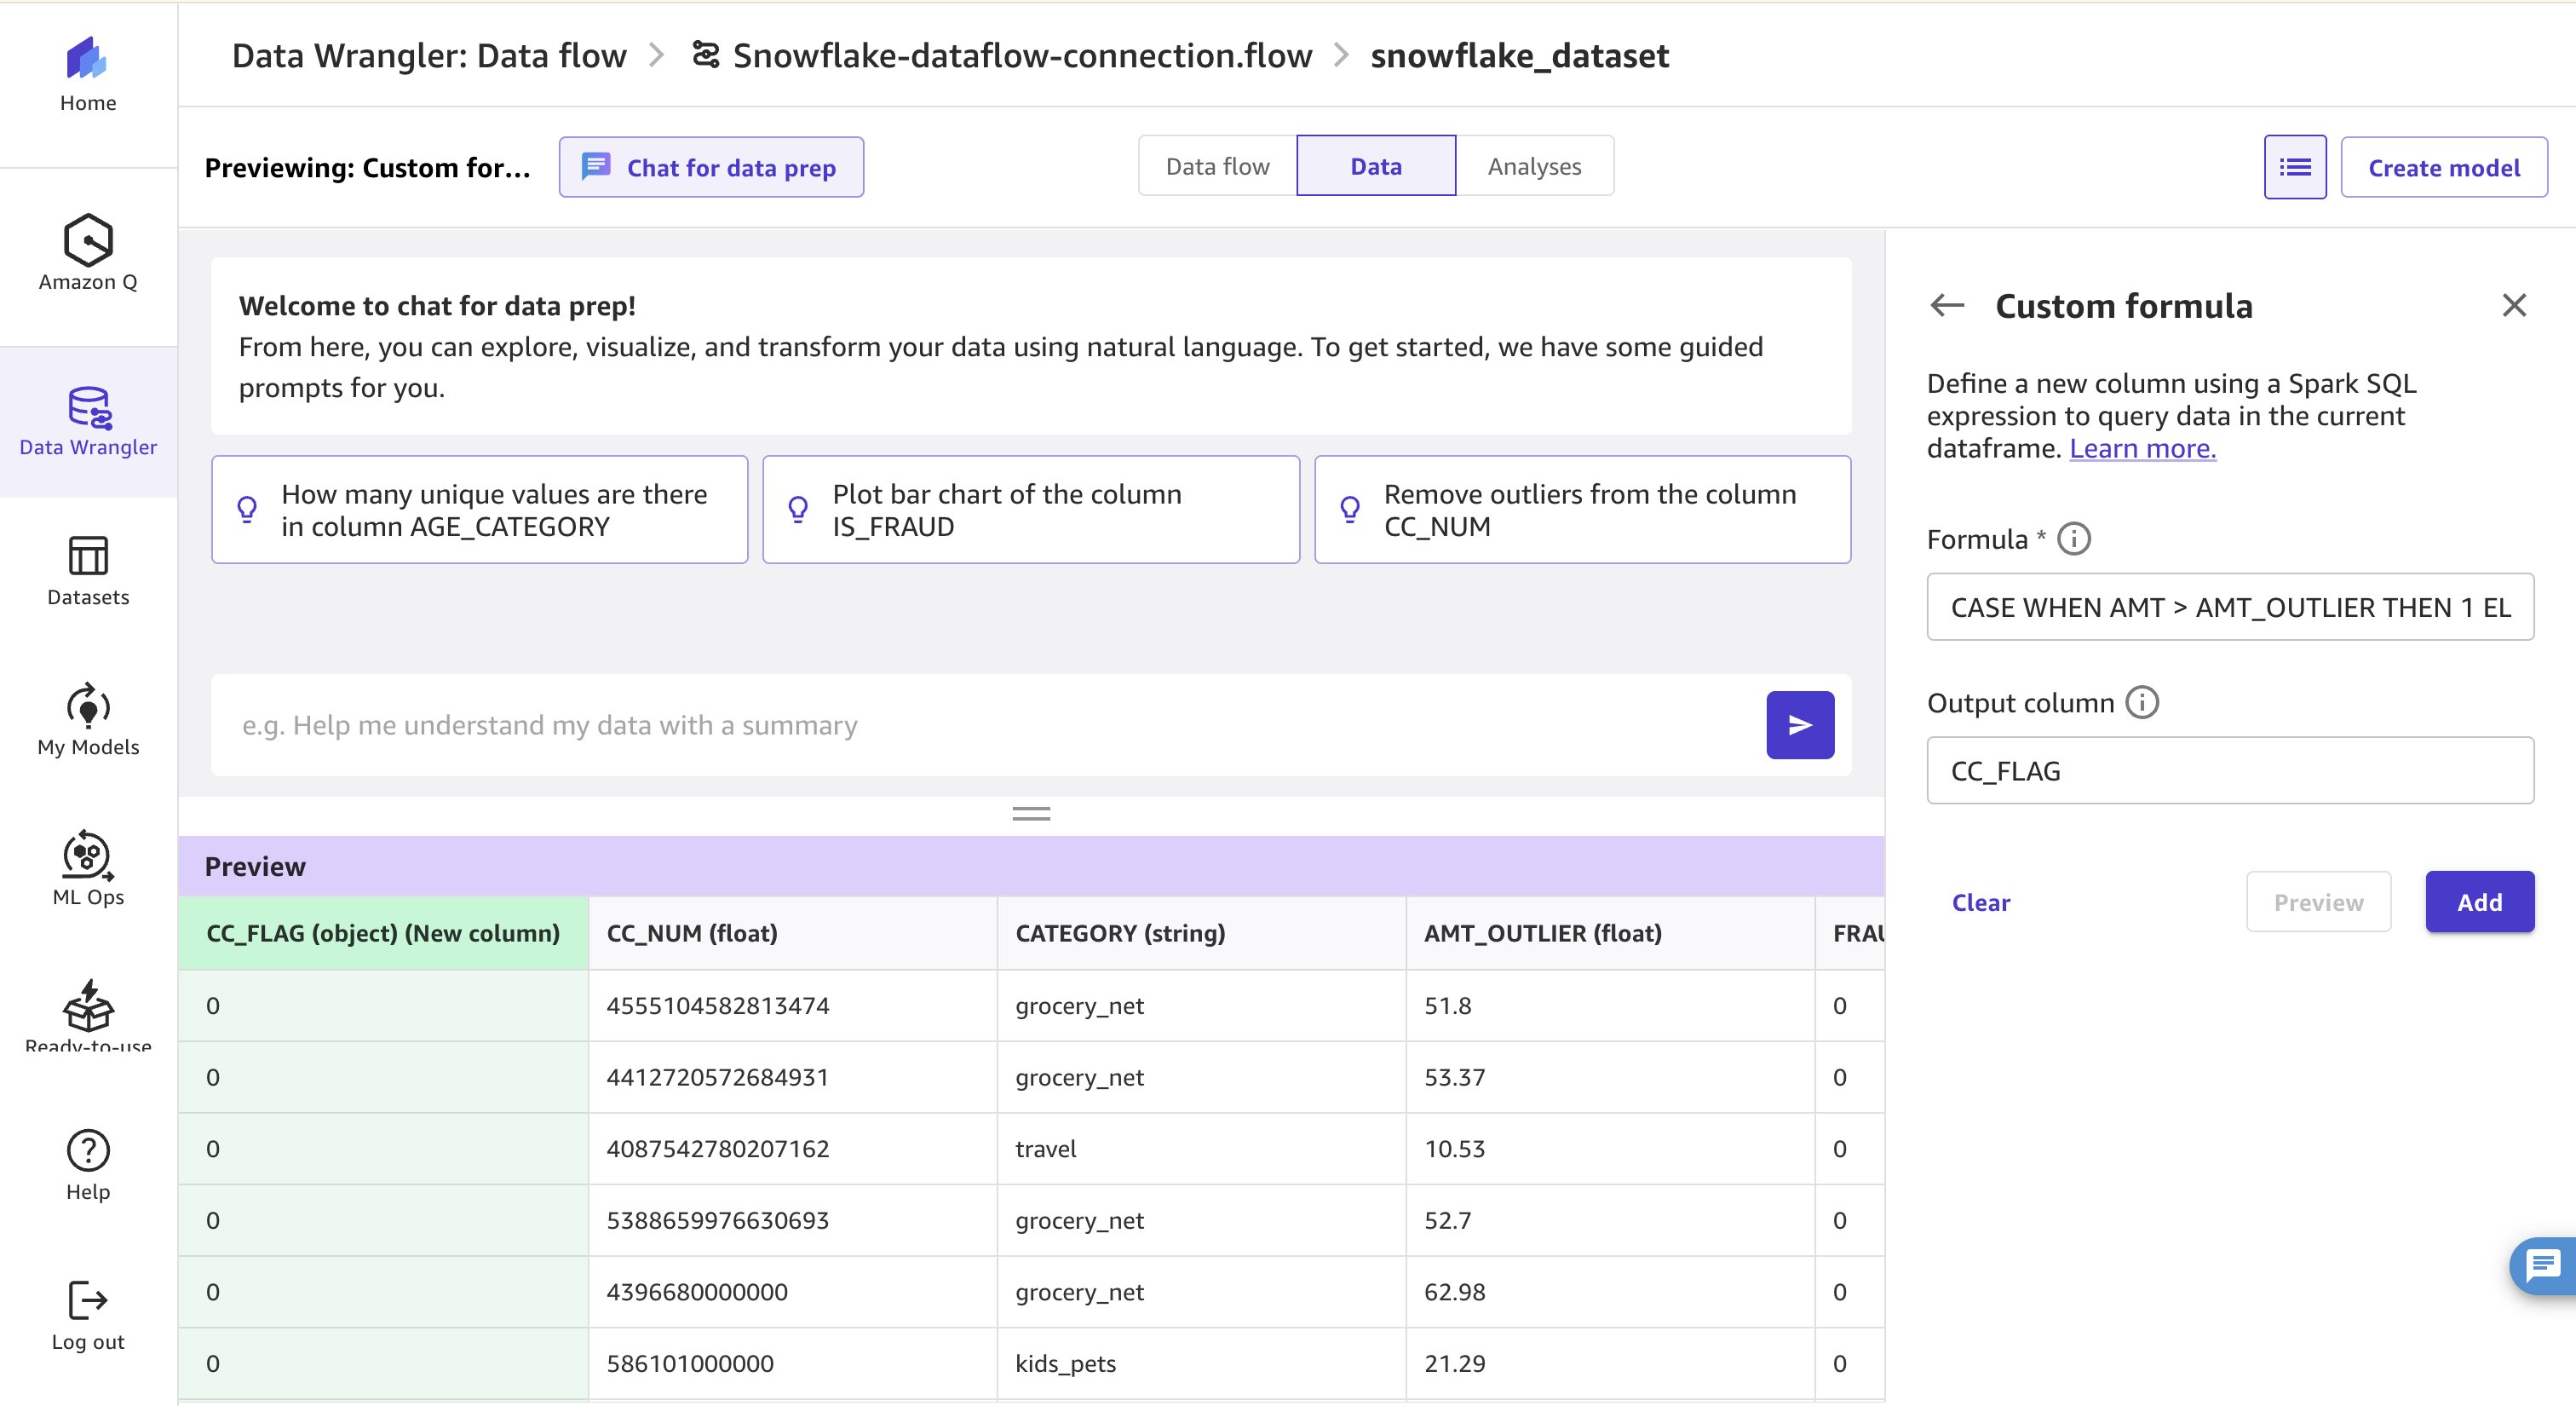
図 14: カードの異常値閾値から CC_FLAG 列を作成するカスタム数式
別の列を追加するには、同じ手順を繰り返してカスタム数式を入力し、以下のクエリをコピー&ペーストします。出力列名は MERCHANT_AMT_FLAG に設定してください。
CASE WHEN AMT > MERCHANT_AMT_OUTLIER THEN 1 ELSE 0 END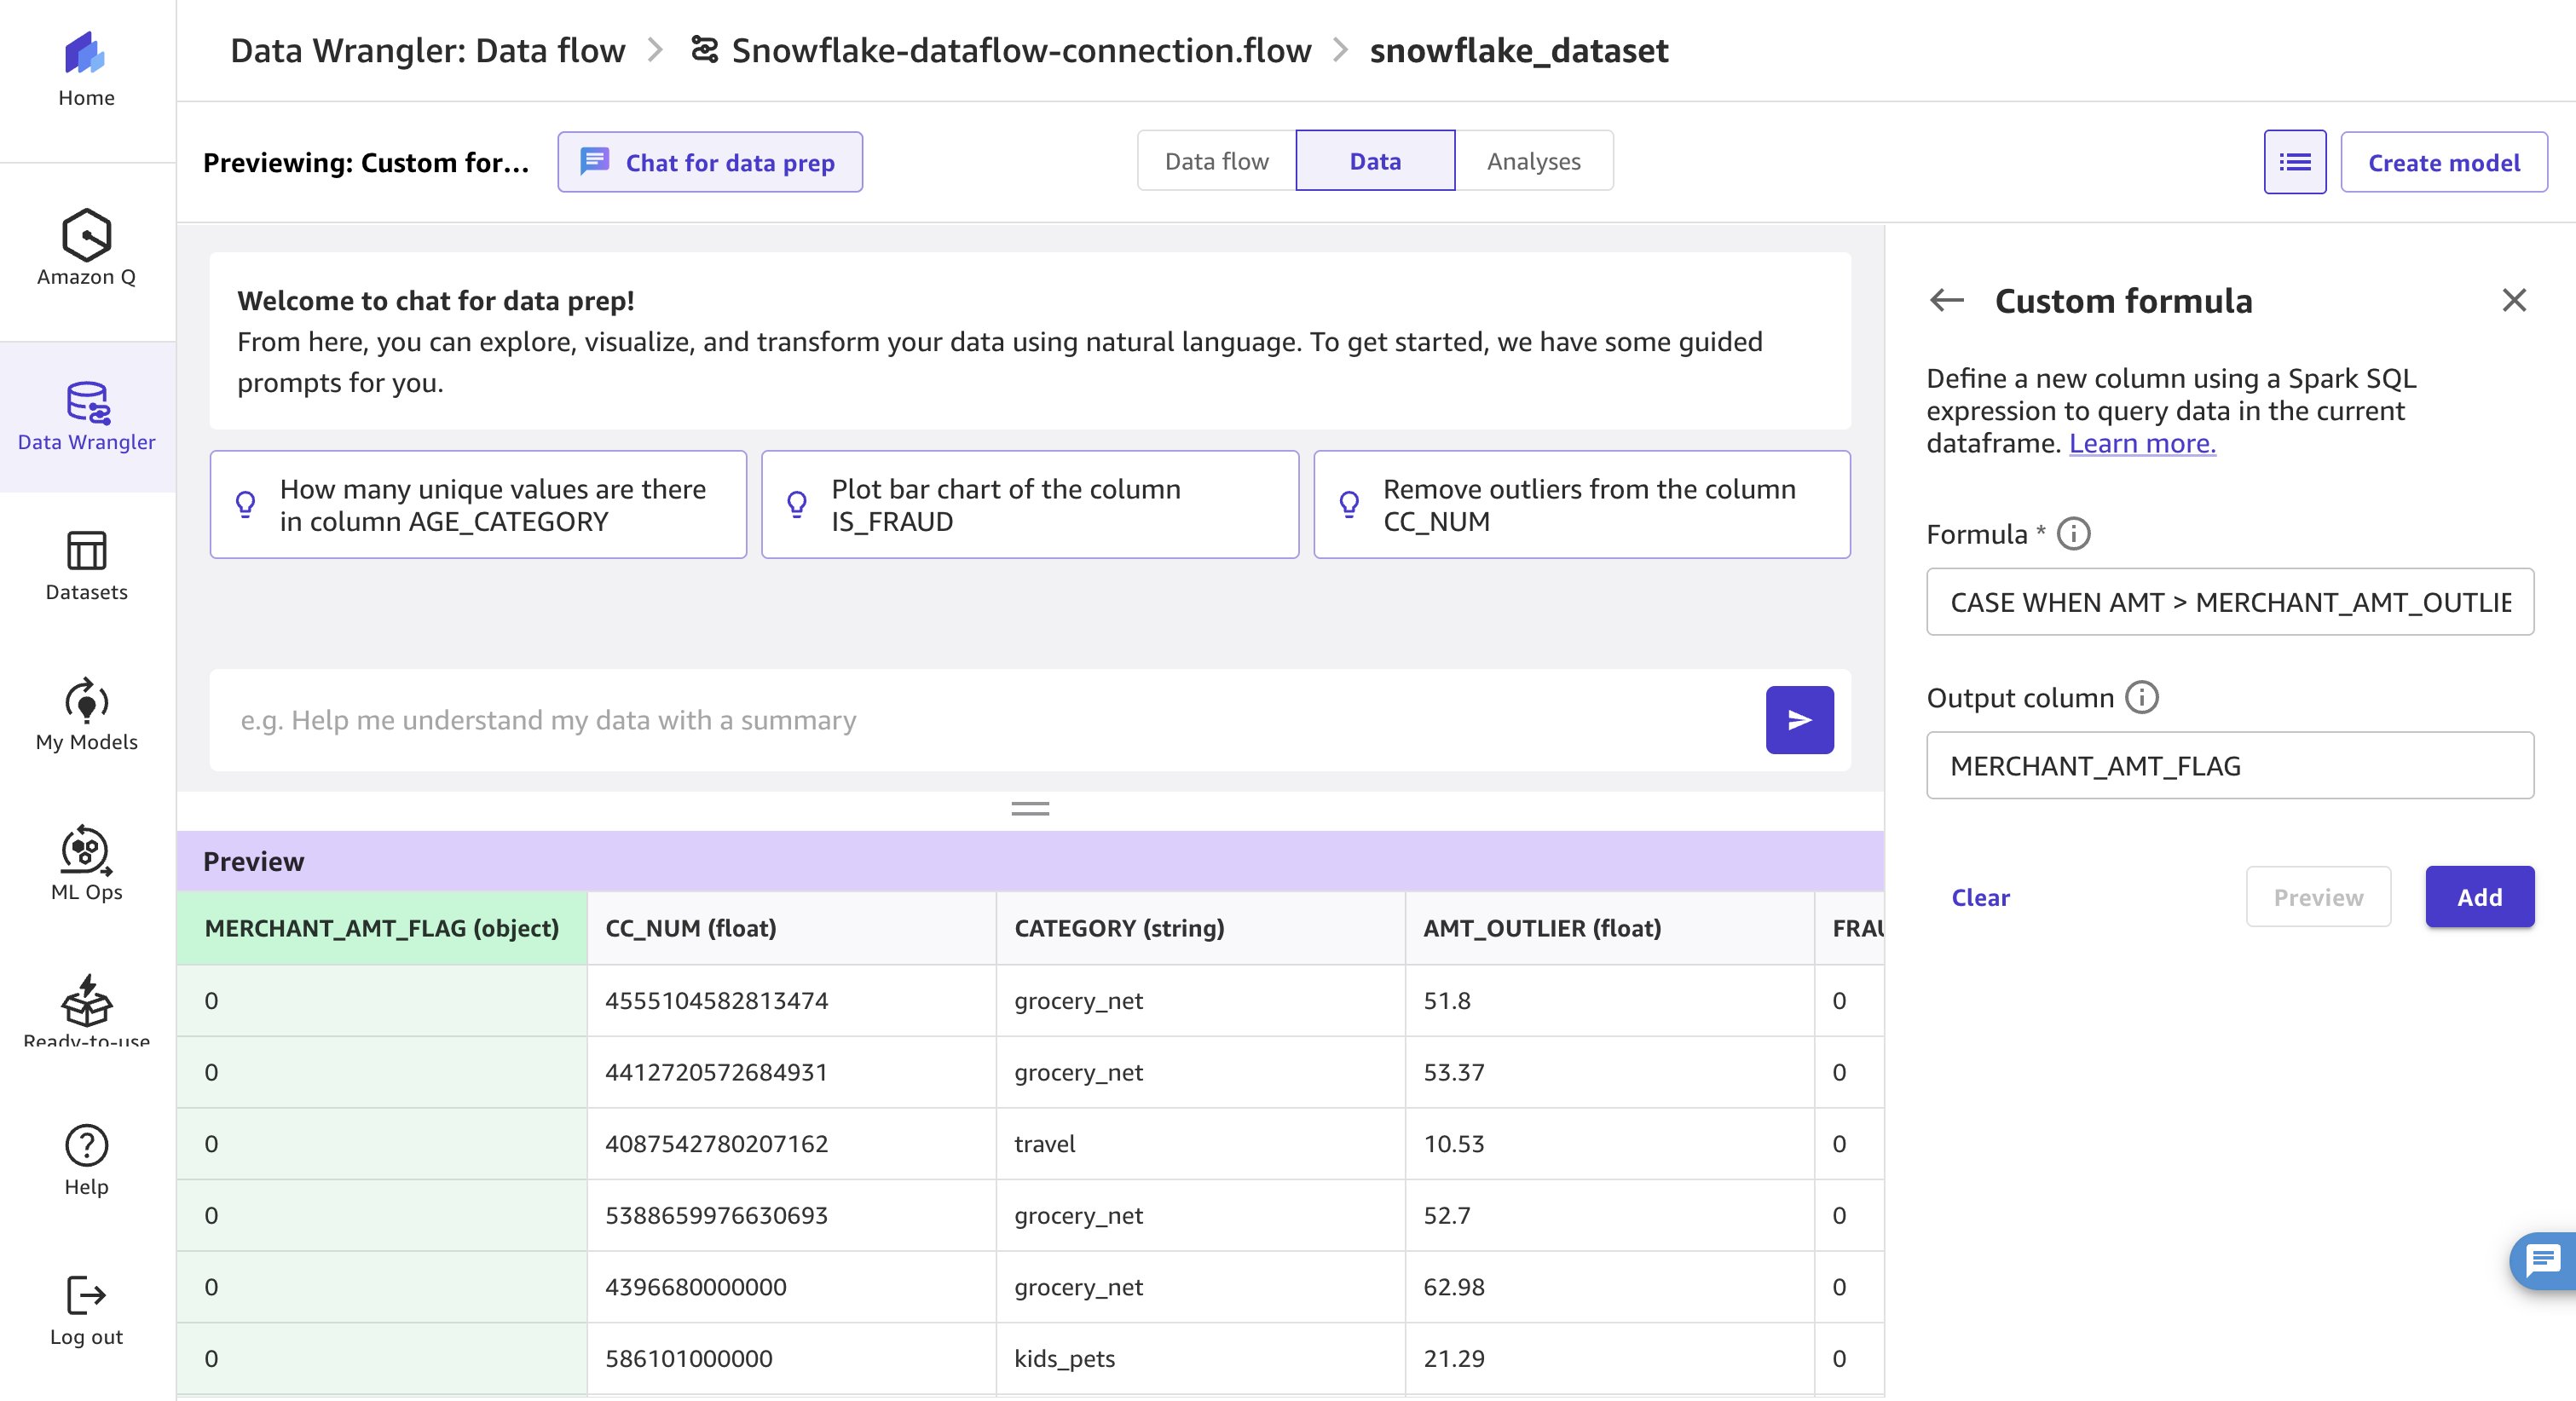
図 15: メンバーの異常値閾値から MERCHANT_AMT_FLAG カラムを作成するカスタム式
カード番号、メンバー名、またはカードやメンバーに紐づく異常金額といった機密情報がモデルに含まれないようにするため、組み込みの変換機能を使ってこれらのカラムを削除します。Add transform(変換の追加)を選択し、Manage Columns(カラムの管理)を選んでください。
次に、Transform type(変換タイプ)を Drop column(カラムの削除)に設定します。
データセットから削除したいカラムを選択してください。
Add(追加)をクリックして変換を適用します。対象となるのは以下の通りです。
CC_NUMAMT_OUTLIERMERCHANT
MERCHANT_AMT_OUTLIER
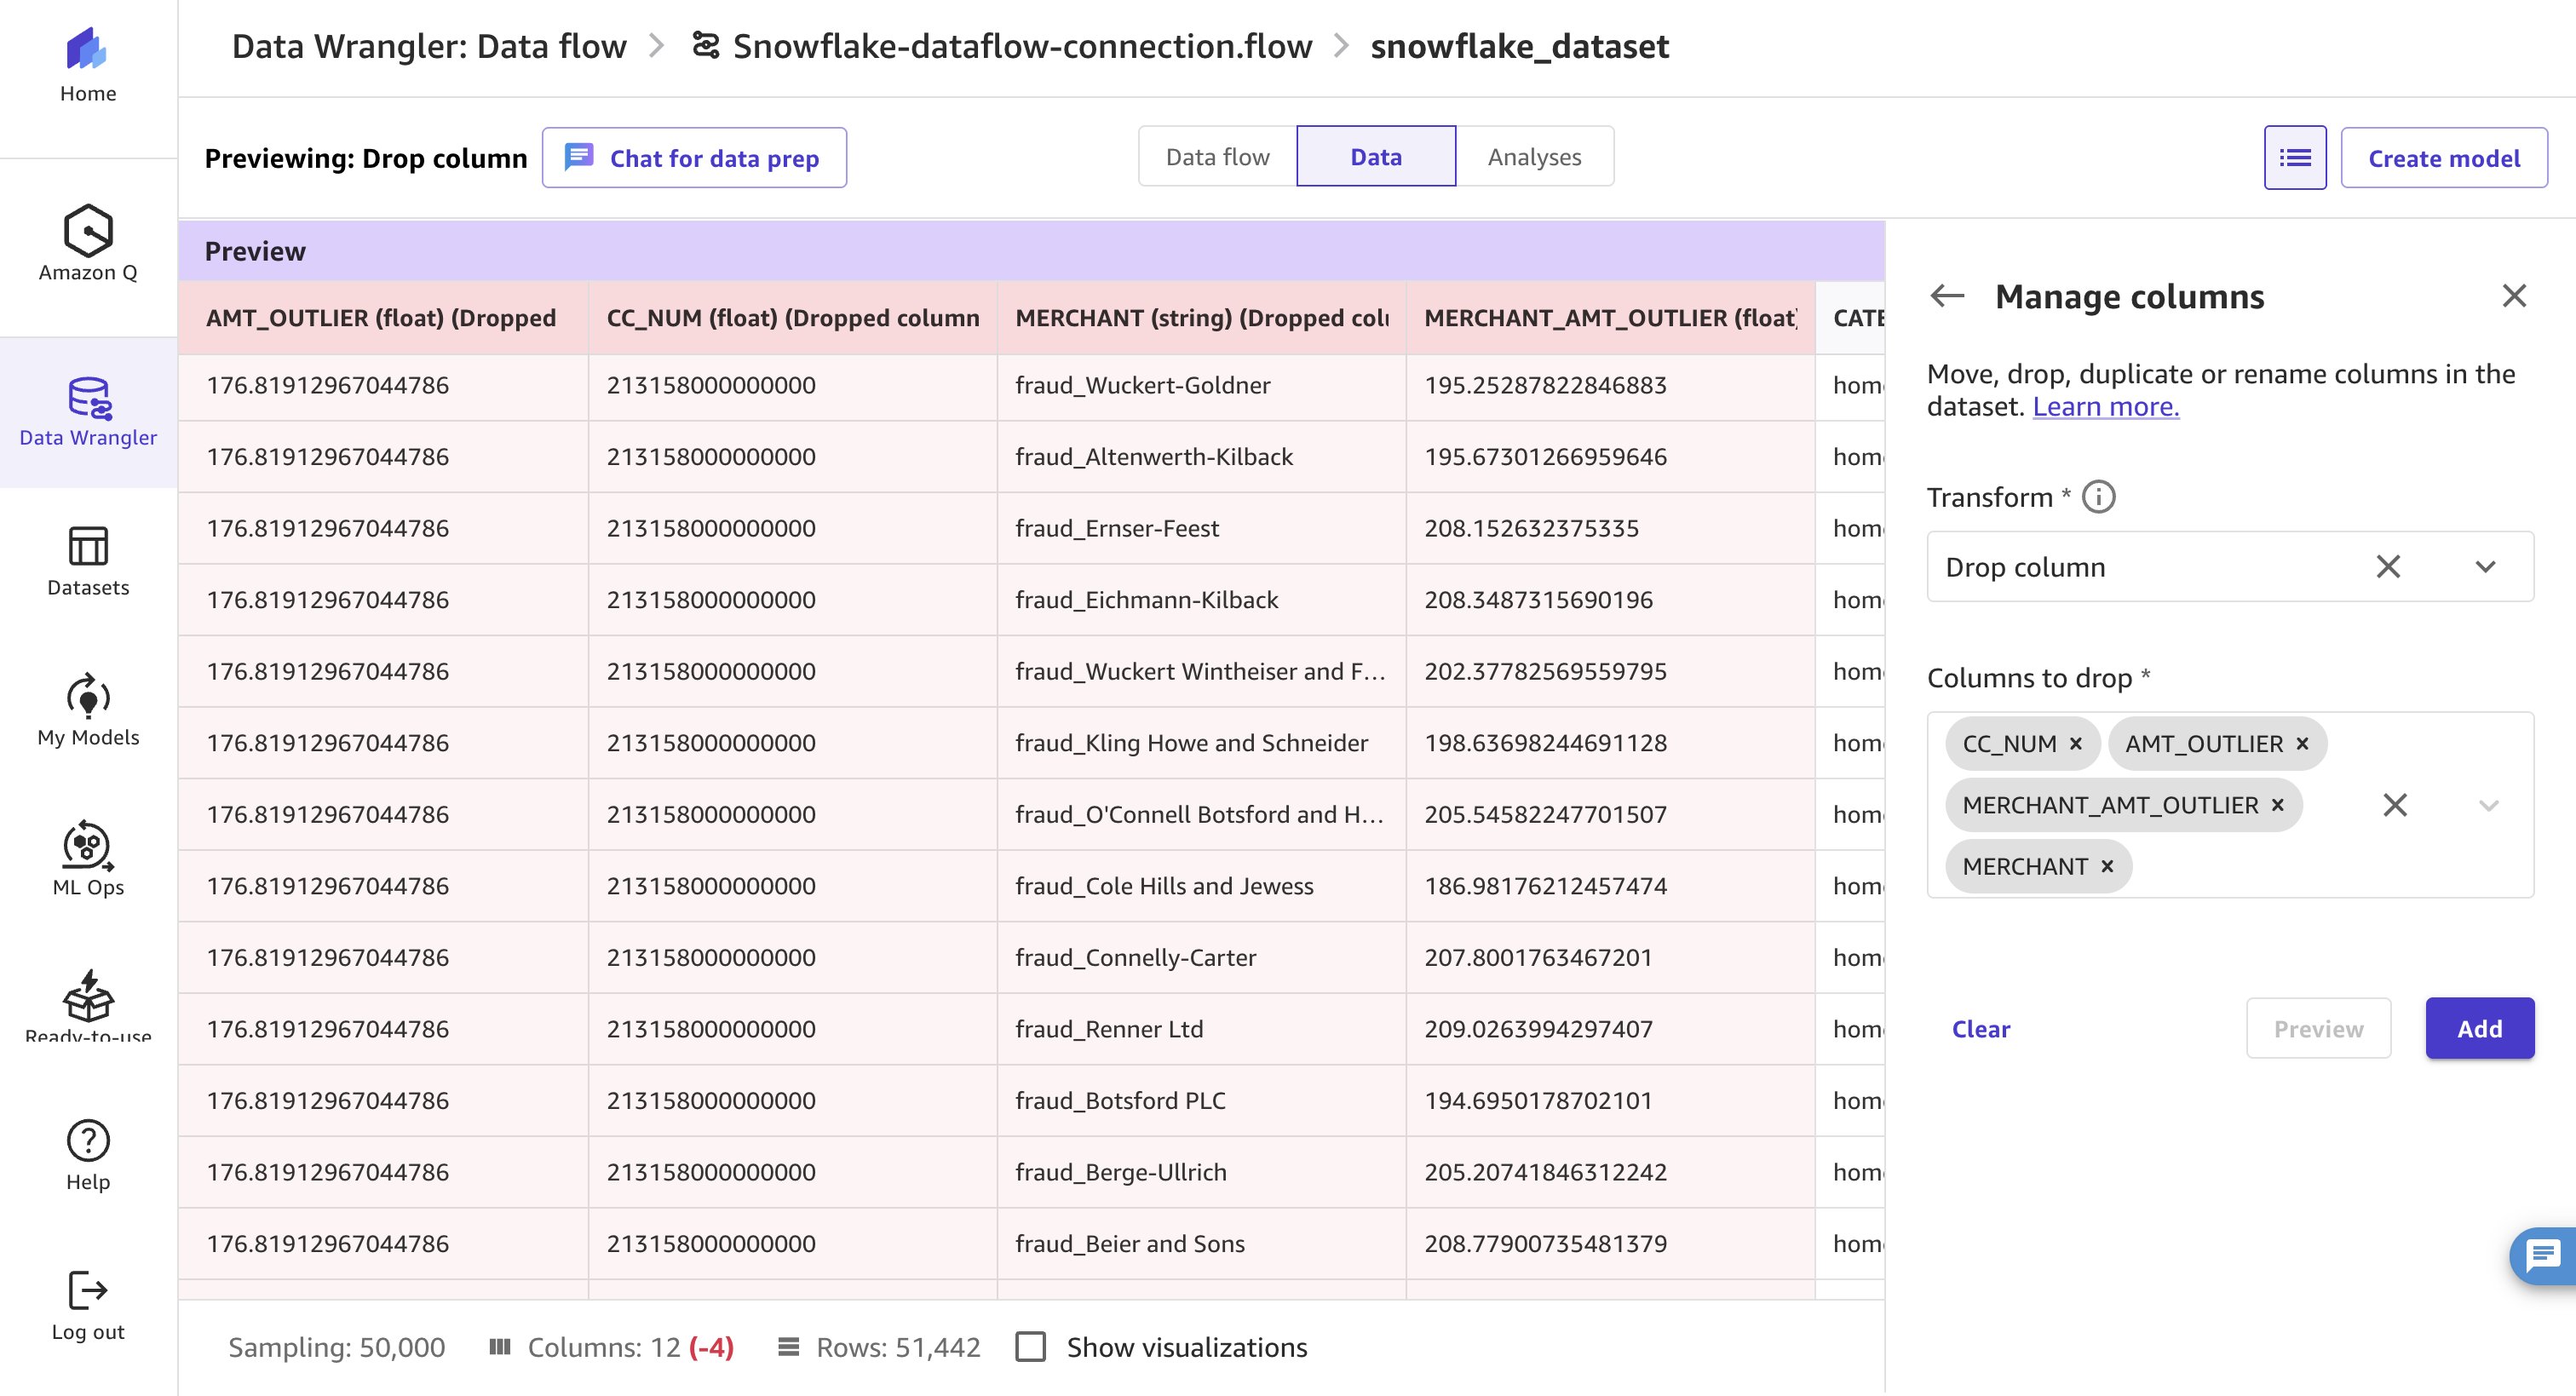
図 16: データセットから機密カラムを削除する「Manage Columns」変換
D. 品質分析とモデルのエクスポート
データ準備が完了したら、品質分析レポート を実行してデータを詳しく確認しましょう。このレポートでは、ターゲットリークやクラス不均衡といった一般的なデータの問題を特定し、ワークフローの早い段階で対策を講じることができます。
分析を開始するには、まずAnalysesタブを選択します。右側のパネルで、Analysis typeリストからData Quality and Insights Reportを選びます。
予測対象とする変数としてIS_FRAUDをtarget columnに設定し、その下のProblem typeではClassificationオプションを選択してください。Data sizeはデフォルトのSampled Datasetのままにします。最後にCreateをクリックして分析を実行します。
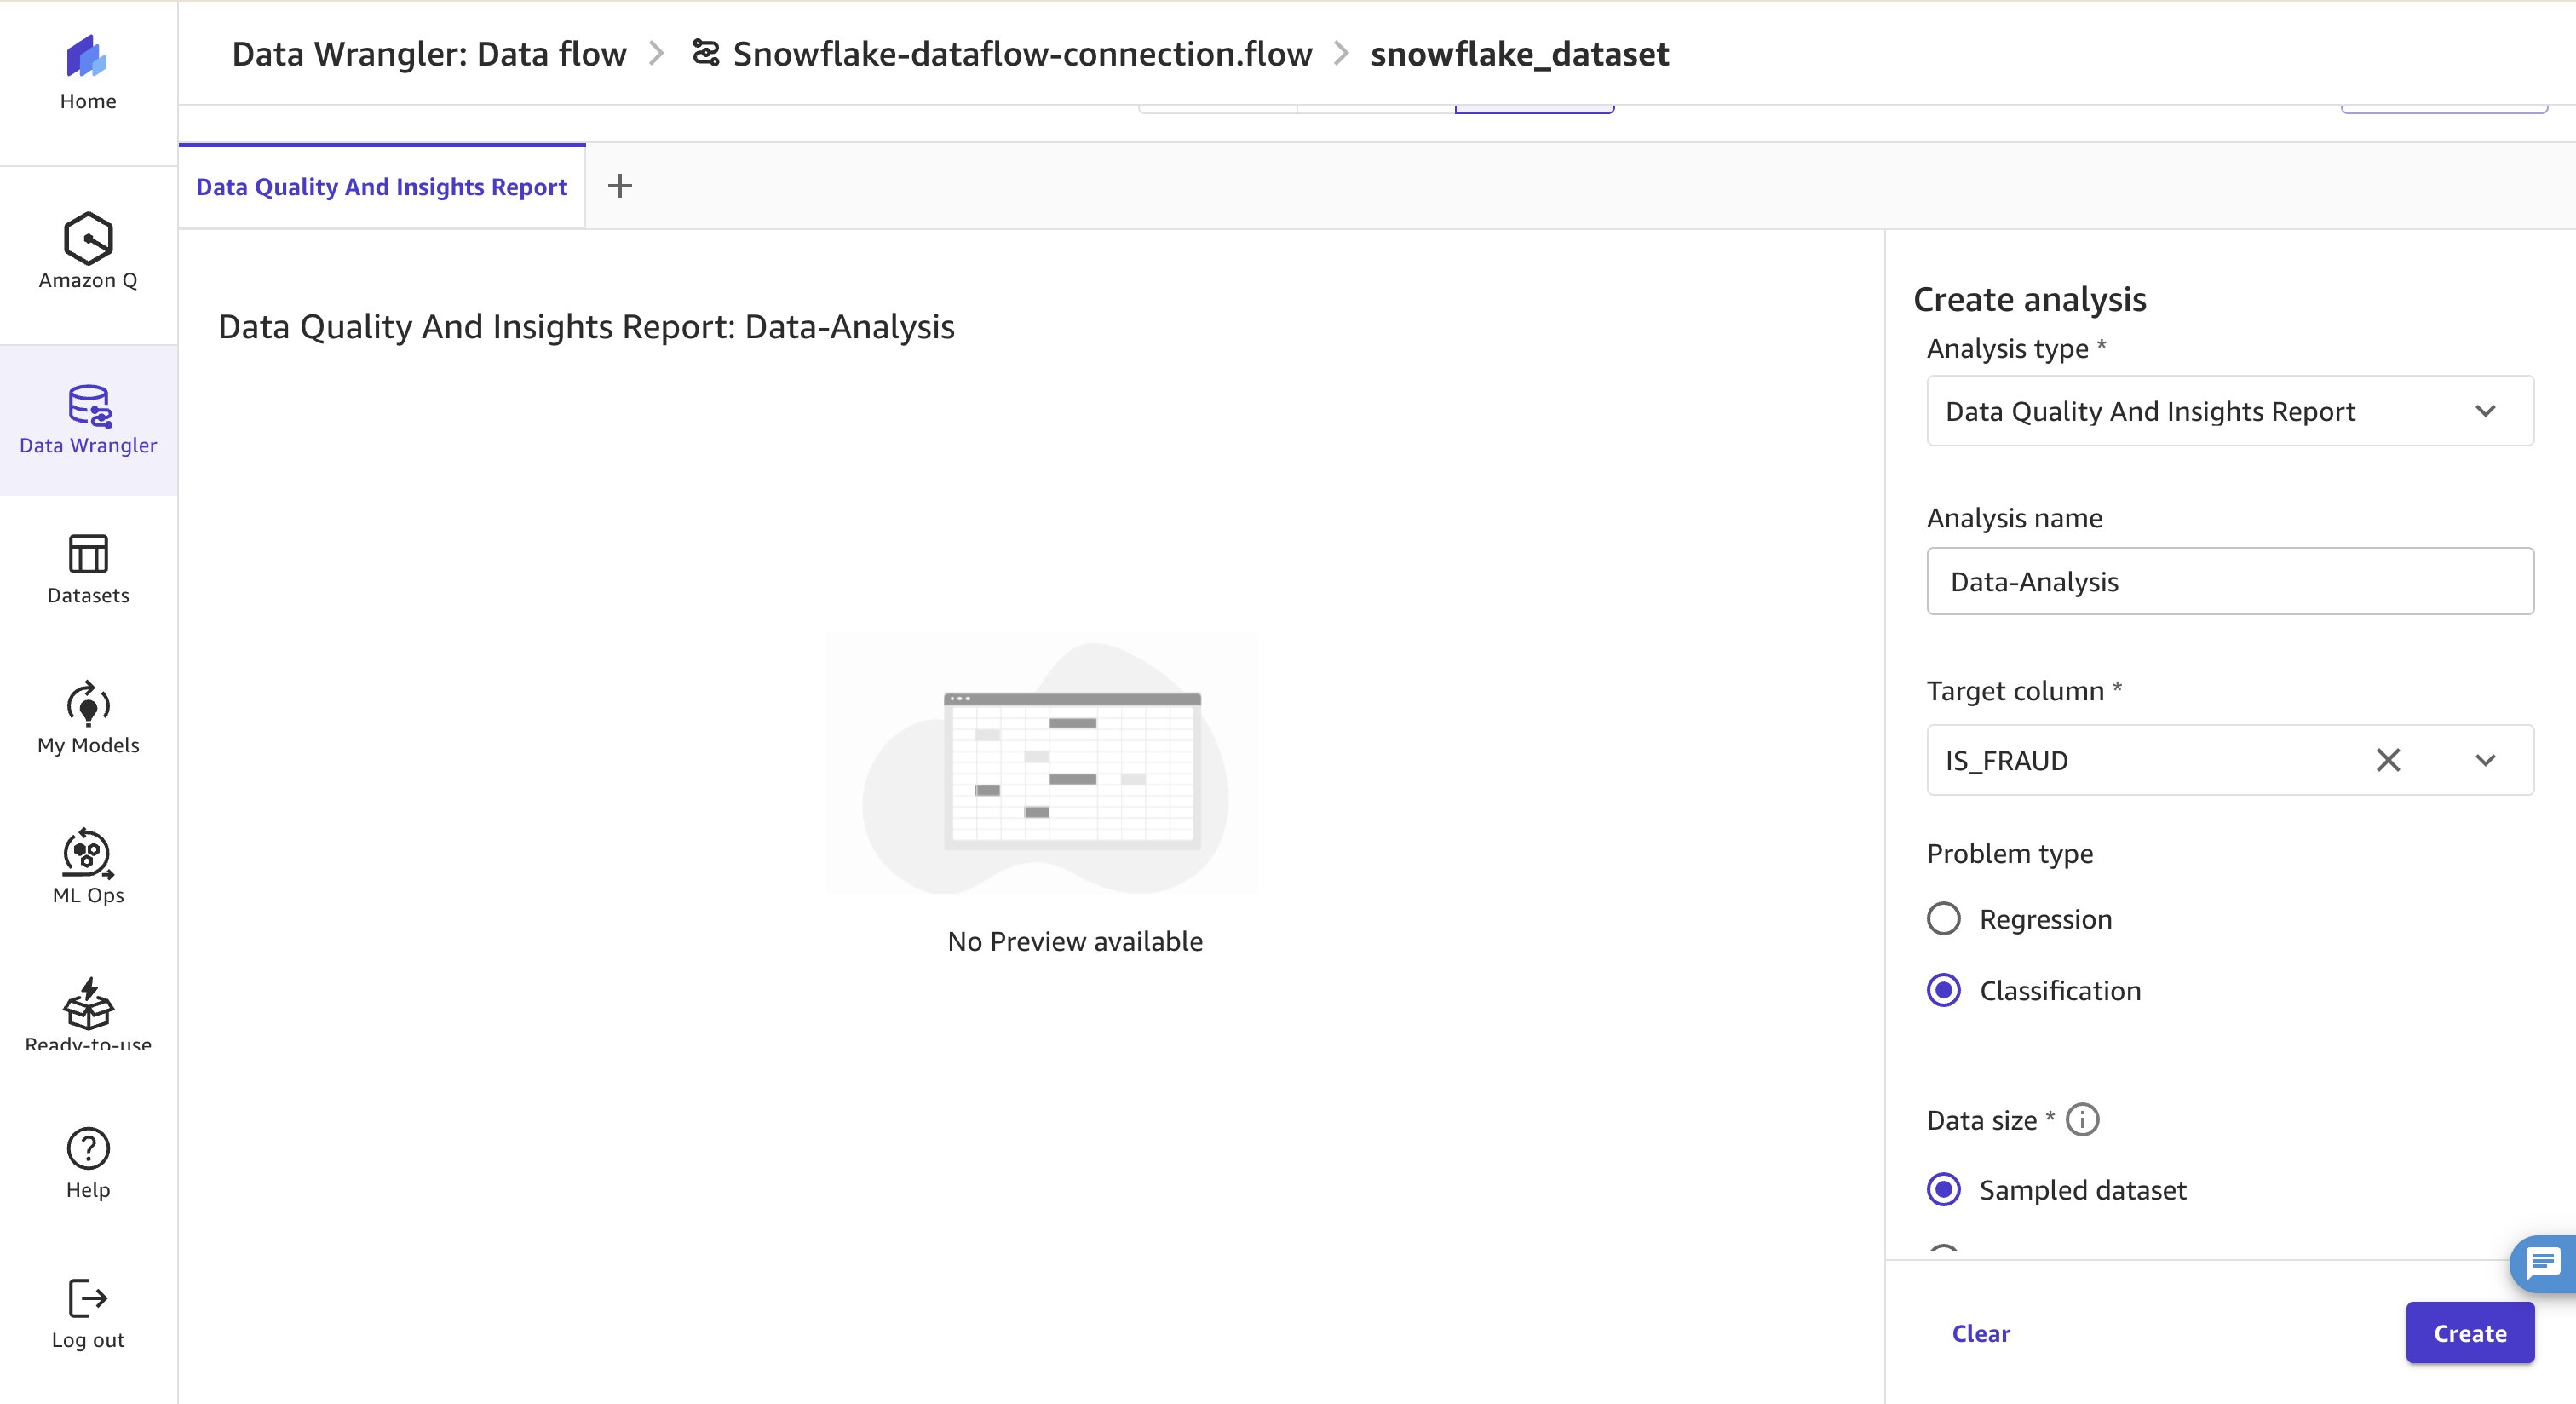
図 17: IS_FRAUDをターゲットとし、分類問題を設定したデータ品質とインサイトレポートの設定画面
数分後には、データの概要や特徴量のサマリー、重複行、異常値などを含む詳細な分析レポートが生成されます。Quick modelセクションでは、トレーニングおよびバリデーションデータセットにおける精度指標を確認できます。その下には混同行列(confusion matrix)が表示され、データエンジニアリング後のモデル品質への影響を把握するために、このレポートを活用することが推奨されています。
原文を表示
Part 1 covered the Snowflake database setup and established the foundational infrastructure for this no-code machine learning (ML) workflow.
Part 2 of this blog series covers complete data preparation and model building workflow using Amazon SageMaker Canvas, demonstrating how to connect directly to Snowflake data sources, transform and prepare data using Data Wrangler’s visual transformations, and build a fraud detection model using the XGBoost algorithm.
Amazon SageMaker Canvas is a visual, no-code machine learning service that enables business analysts and domain experts to build accurate ML models and generate predictions. Amazon SageMaker Canvas provides an intuitive interface for data preparation, model training, and prediction generation democratizing access to machine learning across organizations while maintaining enterprise security and governance.
Solution overview
This solution guides you through the complete workflow of preparing data and building a machine learning model using Amazon SageMaker Canvas, with direct integration to your Snowflake data warehouse.
Prerequisites
Complete Part 1 setting up your Snowflake environment before starting this post. You need the Snowflake account credentials and connection details from Part 1 to complete the steps in this post.
Amazon SageMaker Canvas setup
Open the AWS Management Console and search for Amazon SageMaker Canvas. Select it from the list, or press Enter.
Create your Amazon SageMaker domain
A domain provides the foundational organizational unit for your Amazon SageMaker environment. It serves as a dedicated workspace that houses user profiles, storage configurations, and security settings. Each domain delivers isolated resources and access controls for managing team collaboration and data governance.
- Navigate to environment configurations in the left pane and choose Domains.
- Choose Create domain.
- Choose Set up for single user (Quick setup) to automatically create both your domain and user profile.
Launch Amazon SageMaker Canvas
- Select Canvas from the left-hand pane.
- Choose the domain and user profile you created.
- Choose Open Canvas.
- Wait 3–5 minutes while Canvas prepares your workspace.
Figure 1: Amazon SageMaker Canvas workspace loading after opening it from the domain
Data Wrangler: ML data preparation
Amazon SageMaker Data Wrangler simplifies data preparation for machine learning workflows. With built-in transformations and an intuitive visual interface, Data Wrangler reduces the time traditionally spent on data preparation and analysis. For industries ranging from financial services to healthcare, this capability unlocks significant value so subject matter experts can directly prepare their data for analysis.
The integration with Snowflake reduces data movement challenges, so users can connect directly to their Snowflake data warehouses, transform the data within Canvas, and proceed straight to model building. This unified, no-code environment accelerates time-to-insight while maintaining data governance and security.
A. Data connection and initial setup
In this section, you connect Amazon SageMaker Canvas to a Snowflake data source.
- Navigate to Amazon SageMaker Canvas and choose Data Wrangler from the left navigation pane. Choose Import and prepare, then choose Tabular to work with structured datasets.
Figure 2: Amazon SageMaker Data Wrangler Import and prepare screen with Tabular selected
- Specify the source of your tabular dataset. From the data source menu, choose Snowflake as your connection type. Then choose Add Connection to establish the link between Amazon SageMaker Canvas and your Snowflake environment. With this integration, you can access your cloud data warehouse directly within Canvas. It avoids manual data exports and makes sure you are always working with the most current data in your Snowflake instance.
Figure 3: Selecting Snowflake as the data source and adding a connection in Data Wrangler
- In the Snowflake connection pop-up menu, provide the following:
A connection name.
- The Account ID, set to your Snowflake organization value, plus a hyphen, plus the Snowflake account ID.
- The username for the Snowflake account you set up earlier.
- The password that you set previously.
Figure 4: Snowflake connection dialog with connection name, account ID, username, and password fields
- After the connection is established, you will create card-level outlier thresholds to identify unusual spending patterns for each credit card and category combination. This helps the model detect when a transaction amount significantly deviates from a cardholder’s typical behavior. Copy the SQL query to prepare the fraud detection dataset.
select
CC_NUM,
CATEGORY,
avg(AMT) + (3* stddev_pop(AMT)) as amt_outlier,
case when sum(is_fraud)>1 then 1 else 0 end as fraud_history
from
FRAUD.PUBLIC.FRAUD_TABLE
where trans_date_trans_time<'2020-12-01'
group by
CC_NUM,
CATEGORY- Run the query:
Choose Edit in SQL in the top right corner to open the SQL editor.
- Paste the SQL query into the editor.
- Choose Run SQL to run and preview results.
- Choose Import to bring the dataset into your Canvas workspace.
Figure 5: SQL editor in Data Wrangler showing the outlier-threshold query results ready to import
B. Data enrichment
In the following steps, you will enrich the dataset with transaction-level features and merchant-specific fraud indicators.
- Choose Data flow to add more data. In the top right corner, choose Add Data, and then choose Tabular.
Figure 6: Data flow canvas with the Add Data and Tabular options for adding a second source
- Choose the data source as Snowflake and the existing connection you created before.
Figure 7: Selecting the existing Snowflake connection for the second data source
- In the Edit SQL window, paste the SQL query. This query provides temporal patterns (hour of day, day of week), demographic information (age categories), and merchant-level outlier thresholds, all critical signals for fraud detection. Choose Run SQL, then choose Import.
select
    t.MERCHANT,
    t.CC_NUM,
    'H'||extract(hour from t.TRANS_DATE_TRANS_TIME) as TRANS_HOUR,
    'D'||extract(dow from t.TRANS_DATE_TRANS_TIME) as TRANS_DOW,
    t.state,
    t.gender,
    'A'||FLOOR(DATEDIFF(YEAR, DATEADD(DAY, 1, CAST(t.dob AS DATE)), CAST(t.TRANS_DATE_TRANS_TIME AS DATE)) / 5) * 5 AS age_category,
    t.CATEGORY,
    t.IS_FRAUD,
    t.AMT,
    m.merchant_amt_outlier,
    m.merchant_fraud_history
from
    FRAUD.PUBLIC.FRAUD_TABLE t
left join (
    select
        MERCHANT,
        avg(AMT) + (3* stddev_pop(AMT)) as merchant_amt_outlier,
        case when sum(is_fraud)>1 then 1 else 0 end as merchant_fraud_history
    from
        FRAUD.PUBLIC.FRAUD_TABLE
    where trans_date_trans_time<'2020-12-01'
    group by MERCHANT
) m on t.MERCHANT = m.MERCHANT
where t.trans_date_trans_time<'2020-12-01'
Figure 8: Data Wrangler preview of the enrichment query with temporal, demographic, and merchant features
C. Data transformation
In this section, you will join the data together.
- On the Data flow screen, you see the two data sources imported from Snowflake. Choose the first data type and choose the plus icon next to it. Choose Combine data, then Join. When the right panel opens, choose the second data type from the data flow to join.
Figure 9: Data flow showing the Combine data and Join options between the two Snowflake sources
- Choose Left outer join for the Join type. Add a Join key and choose Category as the left and right join key.
Figure 10: Join configuration with Left outer join type and Category as the join key
- Choose Preview to view the joined data. Choose Add to proceed.
Figure 11: Preview of the joined dataset before adding it to the data flow
Next, you will create outlier features and remove sensitive columns.
- Return to the Data flow screen, choose the join, choose the plus sign (+) next to it, and then choose Add transform.
Figure 12: Adding a transform to the join node in the data flow
- After the interface opens, choose Add transform in the right-hand panel, and then choose Custom Formula.
Figure 13: Choosing Custom Formula in the Add transform panel
- This option gives you the flexibility to add columns using a Spark SQL expression. Copy and paste the following Formula on the Home tab. Enter the output column as CC_FLAG and choose Add.
CASE WHEN AMT > AMT_OUTLIER THEN 1 ELSE 0 ENDFigure 14: Custom formula creating the CC_FLAG column from the card outlier threshold
- To add another column, repeat the same steps to enter a custom formula, then copy and paste this query and name the output column as MERCHANT_AMT_FLAG.
CASE WHEN AMT > MERCHANT_AMT_OUTLIER THEN 1 ELSE 0 ENDFigure 15: Custom formula creating the MERCHANT_AMT_FLAG column from the merchant outlier threshold
- To make sure the model remains free of sensitive information such as card numbers, merchant names, and outlier amounts tied to cards or merchants, remove these columns using built-in transformation.
Select Add transform and choose Manage Columns
- Select the Transform type to Drop column
- Select the columns you want to remove from your dataset
- Choose Add to apply the transformation.
CC_NUM.
- AMT_OUTLIER.
- MERCHANT.
- MERCHANT_AMT_OUTLIER.
Figure 16: Manage Columns transform dropping sensitive columns from the dataset
D. Quality analysis and model export
With data preparation complete, you will run a quality analysis report to get insights into the data. The insights report identifies common data issues, such as target leakage or class imbalance, helping users address them early in the workflow.
- To initiate the analysis, choose the Analyses tab. In the right-hand panel, choose Data Quality and Insights Report from the Analysis type list.
- Choose IS_FRAUD as the target column. This tells Canvas which variable you want to predict. Then choose the Classification option under Problem type. The Data size should remain as Sampled Dataset. Finally, choose Create to launch the analysis.
Figure 17: Data Quality and Insights Report configuration with IS_FRAUD target and Classification problem type
- Within a few minutes, a detailed analysis report will be created which includes a quick summary of the data, feature summary, duplicate rows, anomalous samples and much more. In the Quick model section, review the accuracy metrics in the training and validation datasets. A confusion matrix follows the accuracy statistics. The idea is to use this report after any data engineering to observe how it impacts model quality.
関連記事
今日のまとめ
AIデイリーブリーフで今日の重要ニュースをまとめ読み