Snowflake と SageMaker Canvas のノーコード ML ワークフロー可視化
本文の状態
日本語全文を表示中
詳細モードで約13分の本文を読めます。
同じ出来事の情報源
この情報源を基点に整理
AWS Machine Learning Blog
AWS は Snowflake と Amazon SageMaker Canvas を用いたノーコード機械学習ワークフローの第 3 部で、Amazon QuickSight による洞察可視化手順を公開した。
AI深層分析を開く2026年8月21日 10:50
AI深層分析
キーポイント
Amazon Quick の新機能紹介
Amazon Quick Sight は Amazon Quick に統合され、生成 AI を活用した自然言語クエリやカスタム AI エージェントによるワークフロー自動化機能を備えている。
シームレスなデータ連携
SageMaker Canvas で構築された不正検出モデルの予測結果を、追加インフラなしで直接 Amazon Quick Sight のデータセットとしてインポートできる。
対話型ダッシュボードの構築
運用データと機械学習予測を組み合わせたインタラクティブなダッシュボードを作成し、ステークホルダーへ情報を公開するプロセスを説明している。
Canvas予測のインポートと分析作成
Amazon Quick SightコンソールからSageMaker Canvasの予測データを「Datasets」で選択し、「Create analysis」をクリックして視覚化のキャンバスを開く。
多角的な不正検知パターンの可視化
分析ダッシュボードでは、取引カテゴリ、マーチャントの行動、時間的パターンなど複数の次元にわたる不正検知のパターンを可視化する。
重要な引用
Amazon Quick extends these capabilities with generative AI that supports natural language queries over your data
teams can use to build interactive dashboards, perform deep data analysis, and share insights across their organization
without requiring additional infrastructure or custom integrations
"This dataset will be available on Amazon Quick Sight's console."
編集コメントを表示
編集コメント
本記事は、機械学習モデルの構築から可視化までの一連の流れをノーコードツールで完結させる実用的なガイドとなっている。生成 AI を組み合わせた BI ツールの進化により、技術的な壁が下がり、より広範な層がデータドリブンな意思決定に参加できる環境が整いつつある。
Source Article
元記事を日本語で読む
本文に関係しない購読案内、埋め込み通知、サイト内プロモーションは除いています。
パート1では、Snowflakeデータベースの実装セットアップと、ノーコードの機械学習(ML)ワークフローのための基盤となるインフラストラクチャの構築について解説しました。
パート2では、Amazon SageMaker Canvas を活用したデータ準備からモデル構築までの一連の流れを紹介しました。具体的には、Snowflake データソースへの直接接続方法や、Data Wrangler のビジュアル変換機能を用いたデータの加工・前処理、そして XGBoost アルゴリズムによる不正検知モデルの作成方法を解説しています。
パート3では、SageMaker Canvas の予測結果を Amazon Quick Sight(現在は Amazon Quick に統合)と連携させることで、業務データと機械学習による詐欺検知の予測を組み合わせたインタラクティブなダッシュボードを作成し、ビジネスインテリジェンスを実現します。本記事では、Canvas の予測結果を Amazon Quick Sight のデータセットとして取り込む方法や、分析ダッシュボードの構築手法、自然言語による generative BI 機能を活用した洞察の可視化、そしてステークホルダーへの公開方法を解説します。
Amazon Quick Sight を活用したダッシュボード構築
Amazon Quick Sight は Amazon Quick に含まれる強力なビジネスインテリジェンスサービスで、チームがインタラクティブなダッシュボードを構築し、詳細なデータ分析を行い、組織全体で洞察を共有するために利用できます。Amazon Quick ではさらに、データに対する自然言語クエリのサポートやワークフロー自動化のためのカスタム AI エージェント、ファイル・ダッシュボード・ナレッジベースを一元管理できるコラボレーション機能「Spaces」など、生成 AI を活用した機能を追加しています。
すでに Amazon SageMaker Canvas を利用しているチームにとって、Amazon Quick は追加のインフラ構築やカスタム統合なしに、機械学習による予測結果からビジネス対応可能なダッシュボードへと直接つなぐ道を提供します。
このセクションでは、Amazon SageMaker Canvas で生成した不正検出の予測結果を Amazon Quick Sight にインポートし、対話型ダッシュボードを作成して、自然言語による分析機能を活用するまでの完全なワークフローを解説します。
前提条件
Part 3 を始める前に、以下の手順を完了してください。
- **Part 1** – Snowflake アカウントのセットアップ、不正検出用のデータベースとテーブルの作成、および Amazon SageMaker Canvas 接続に必要な Snowflake の組織アカウント名の取得。
- **Part 2** – Amazon SageMaker Canvas と Snowflake の接続、Data Wrangler を用いたデータセットの準備、XGBoost 不正検出モデルの構築と学習、そして予測結果を Amazon Quick Sight への送信。
- Amazon Quick Sight の利用を開始するために Amazon Quick にサインアップし、生成型 BI 機能を利用できるようユーザー権限を「Admin Pro」「Author Pro」、または「Reader Pro」にアップグレードしてください。
可視化を作成する前に、Canvas での予測結果を Amazon QuickSight のデータセットとしてインポートする必要があります。
本シリーズの前のパートでは、Amazon SageMaker Canvas で生成された予測結果が Amazon QuickSight に送信されました。このデータセットは、Amazon QuickSight コンソール上で利用可能です。
左側のナビゲーションペインから[データセット]を選択し、Canvas による予測結果のデータセットを探します。
次に、[分析の作成]をクリックします。これにより空白のキャンバスが開き、不正検知の予測結果を実行可能なインサイトに変換する可視化の構築を開始できます。
可視化の構築
データセットをインポートした後、次は予測結果を分析するためのビジュアルを作成するステップです。
分析インターフェースでは、まずデータセットからフィールドを選択して最初のビジュアルを作成します。ダッシュボード作成の詳細なガイドについては、Amazon QuickSight の分析作成を参照してください。
以下は、取引カテゴリやマーチャントの行動、時間的なパターンなど複数の次元にわたる不正のパターンを示す分析ダッシュボードです。
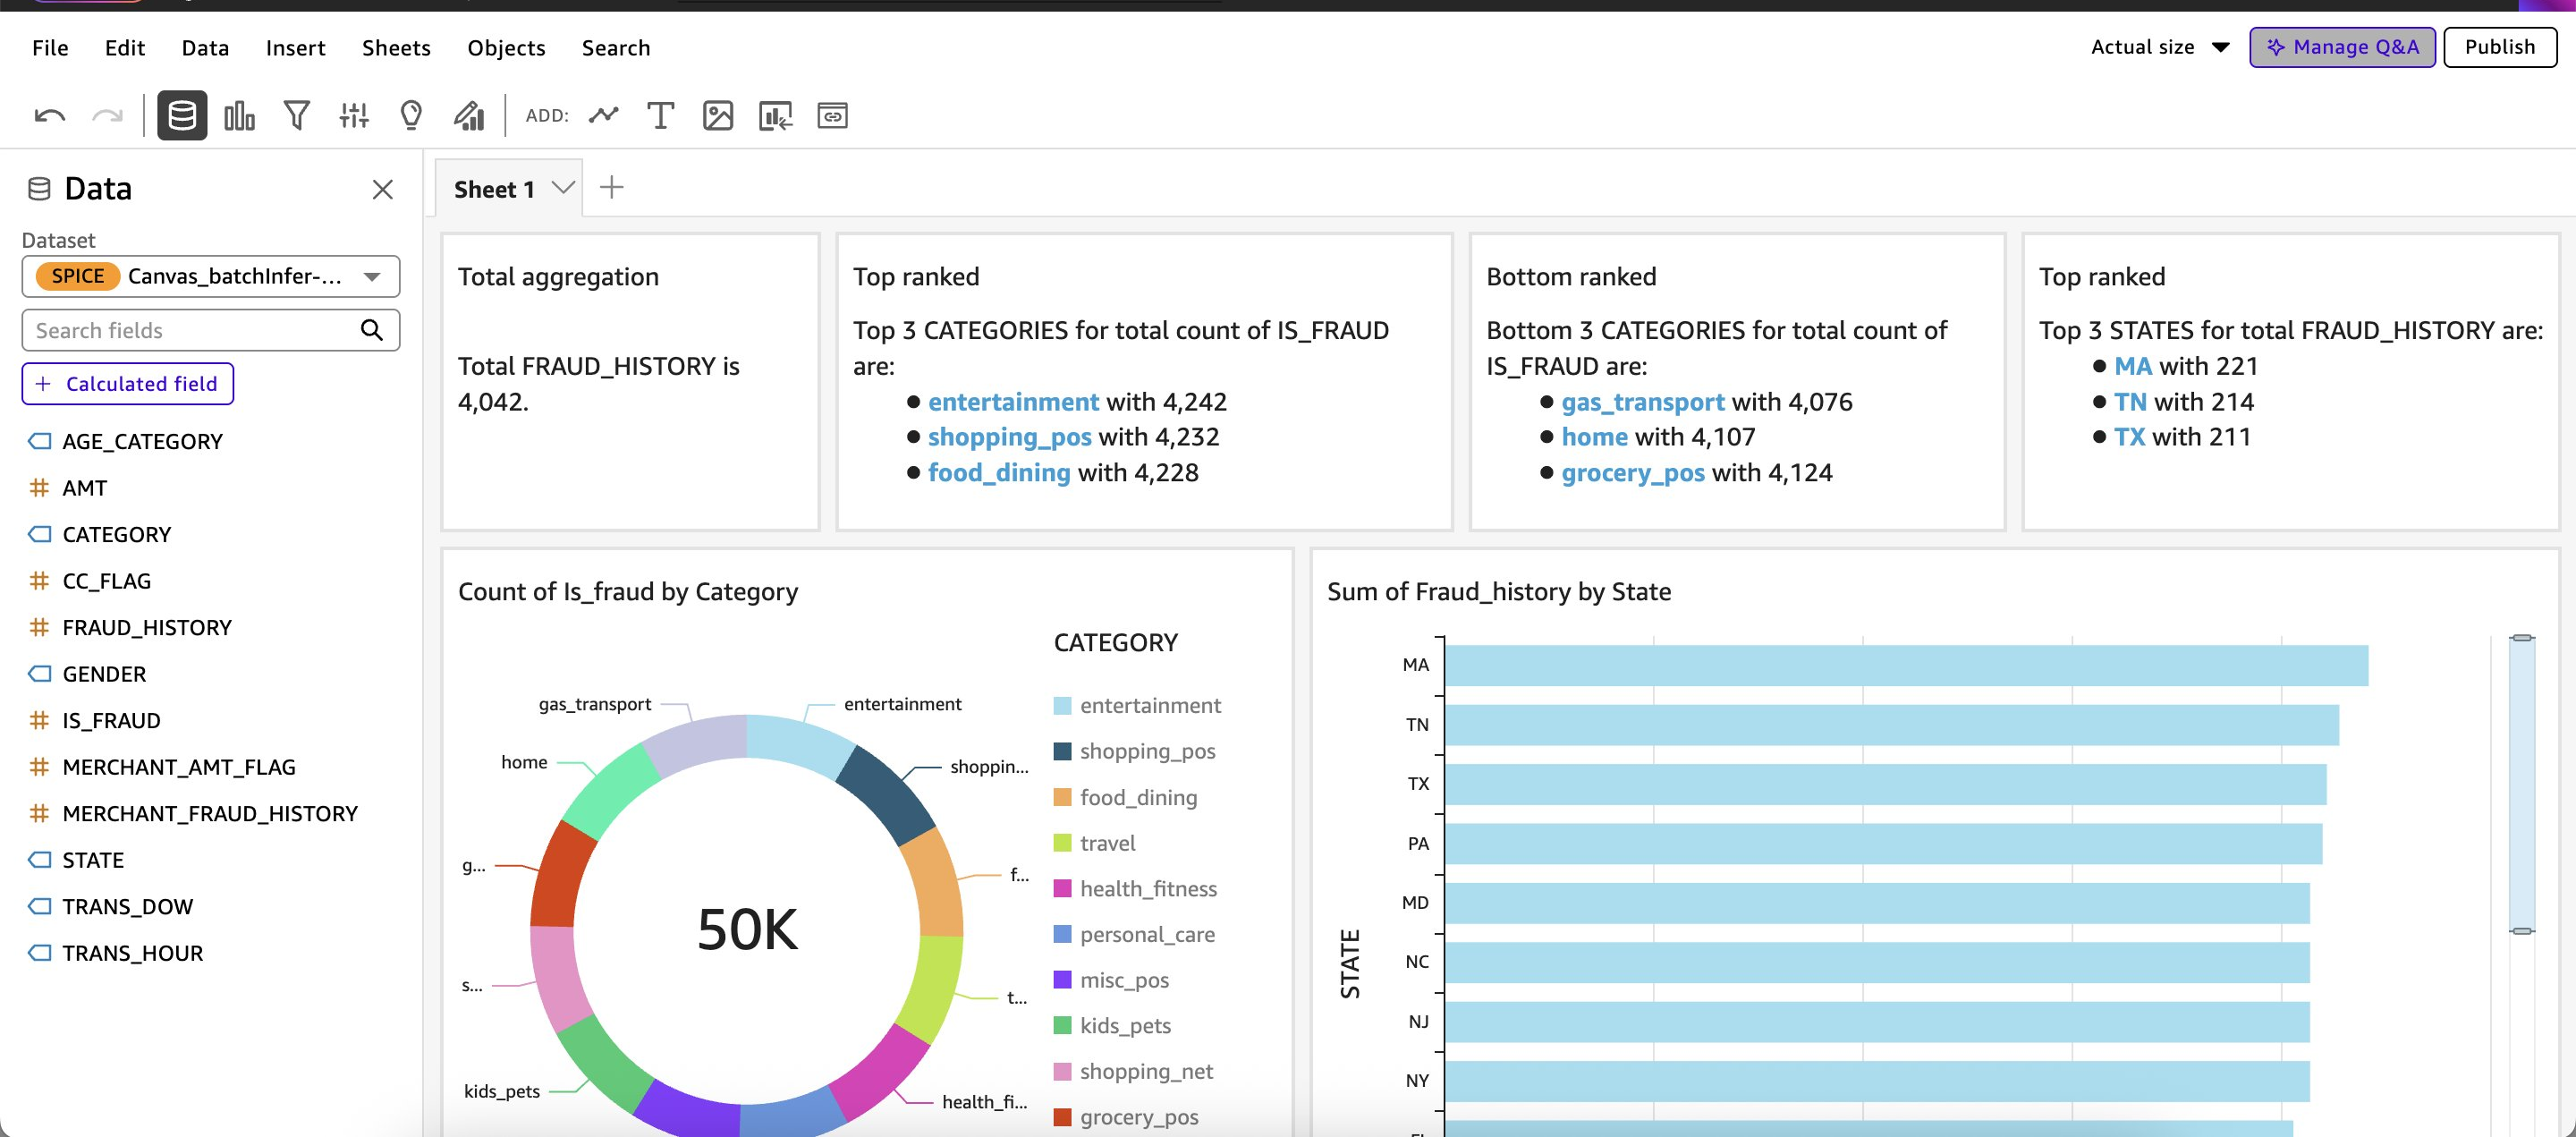
図1:取引カテゴリ、商行為、時間的傾向にわたる不正パターンを示す不正検出分析ダッシュボード
Amazon Quick Sight の生成型 BI 機能は、自然言語による対話を通じてダッシュボード作成を加速します。
Amazon Quick Sight で生成型 BI 機能を利用するには、Amazon Quick サブスクリプション内のユーザーを「Admin Pro」「Author Pro」、または「Reader Pro」のロールにアップグレードする必要があります。Pro ロールには、各割り当てられたロールに関連する生成型 BI 機能へのアクセス権が付与され、他のユーザーと生成された Q&A トピックを共有することも可能になります。サブスクリプション名がどのユーザーロールに対応するかについては、Amazon Quick のサブスクリプションとロールの理解 を参照してください。
- スパークルアイコンを選択します。開くパネル内のチャットでは、現在のタスクに基づいた文脈に応じたオプションが表示されます。分析作業中、計算式の作成やビジュアルの生成・編集、Q&A トピックの設定、データに関する質問への回答などを行うことができます。
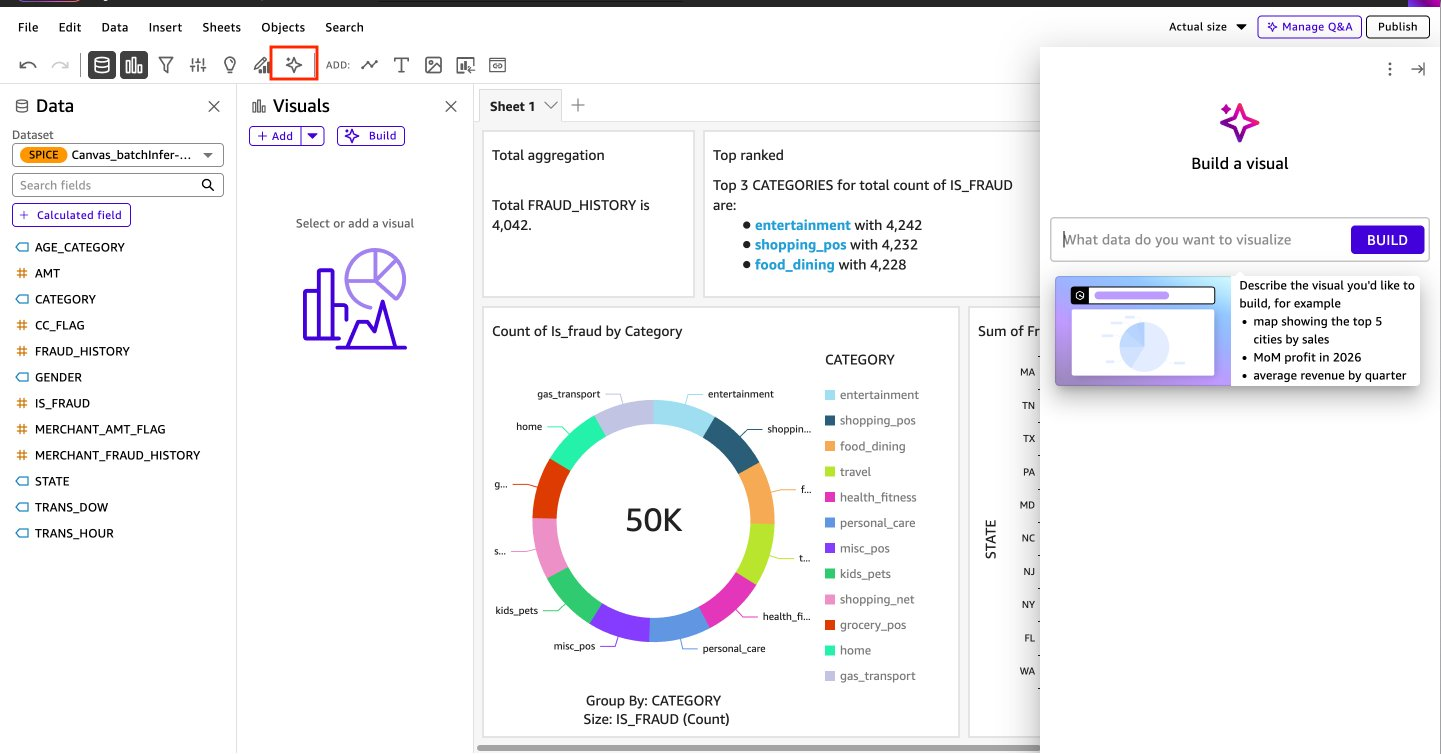
図 2:計算式、ビジュアル、Q&A トピックの構築に向けた文脈対応オプションを備えた Amazon Quick Sight 生成型 BI パネル
「ビルの作成」メニューで、作成したい結果の自然言語による説明を入力すると、カスタムビジュアルを生成できます。生成されたビジュアルを確認し、「分析に追加」を選択してダッシュボードに組み込みます。
次の例では、取引時間ごとの不正利用率のグラフを、シンプルな自然言語クエリによって作成しています。これにより、1 日の時間帯ごとに不正活動がどのように変動するかを把握でき、手動での分析だけでは検出が難しい時系列のパターンを浮き彫りにします。
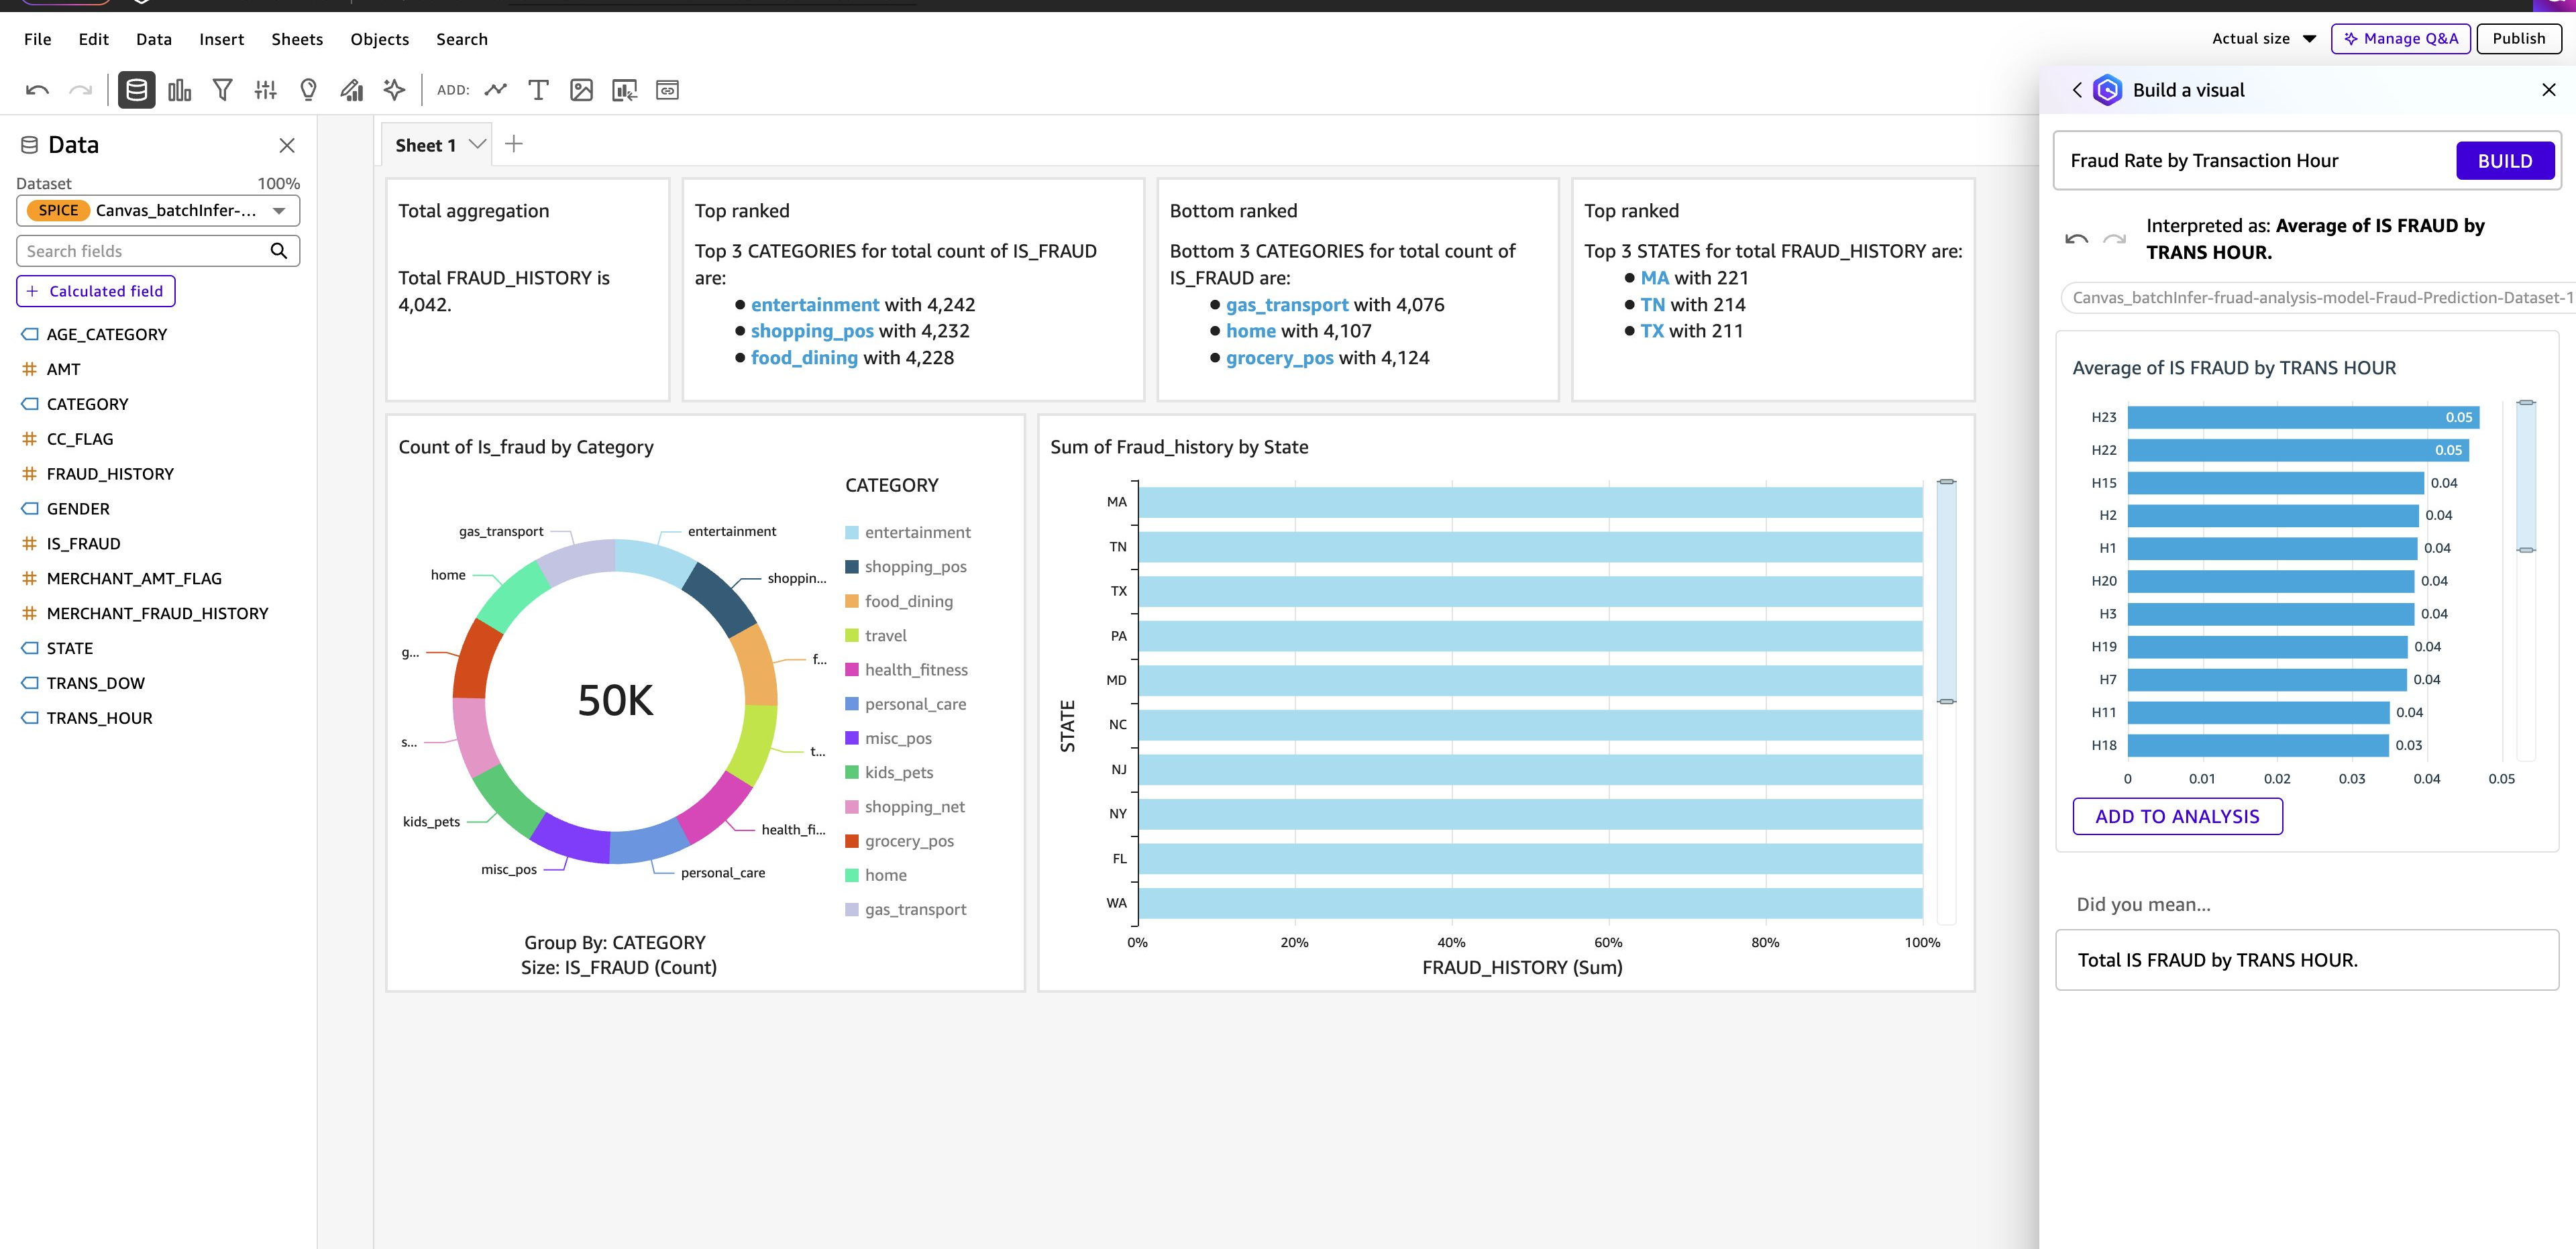
図 3: 自然言語クエリから生成された取引時間ごとの不正利用率のビジュアル
新しいビジュアルを作成せずにダッシュボードを直接照会するには、生成型 BI パネルに質問を入力します。すると即座に AI が回答を返します。次の例では、ワシントン州での不正事案の総数を問い合わせるシンプルなクエリに対して、生成型 BI の機能が瞬時に結果を返しています。これは、自然言語による質問がビジネスユーザーにとってデータに基づく回答をもたらす仕組みを示したものです。
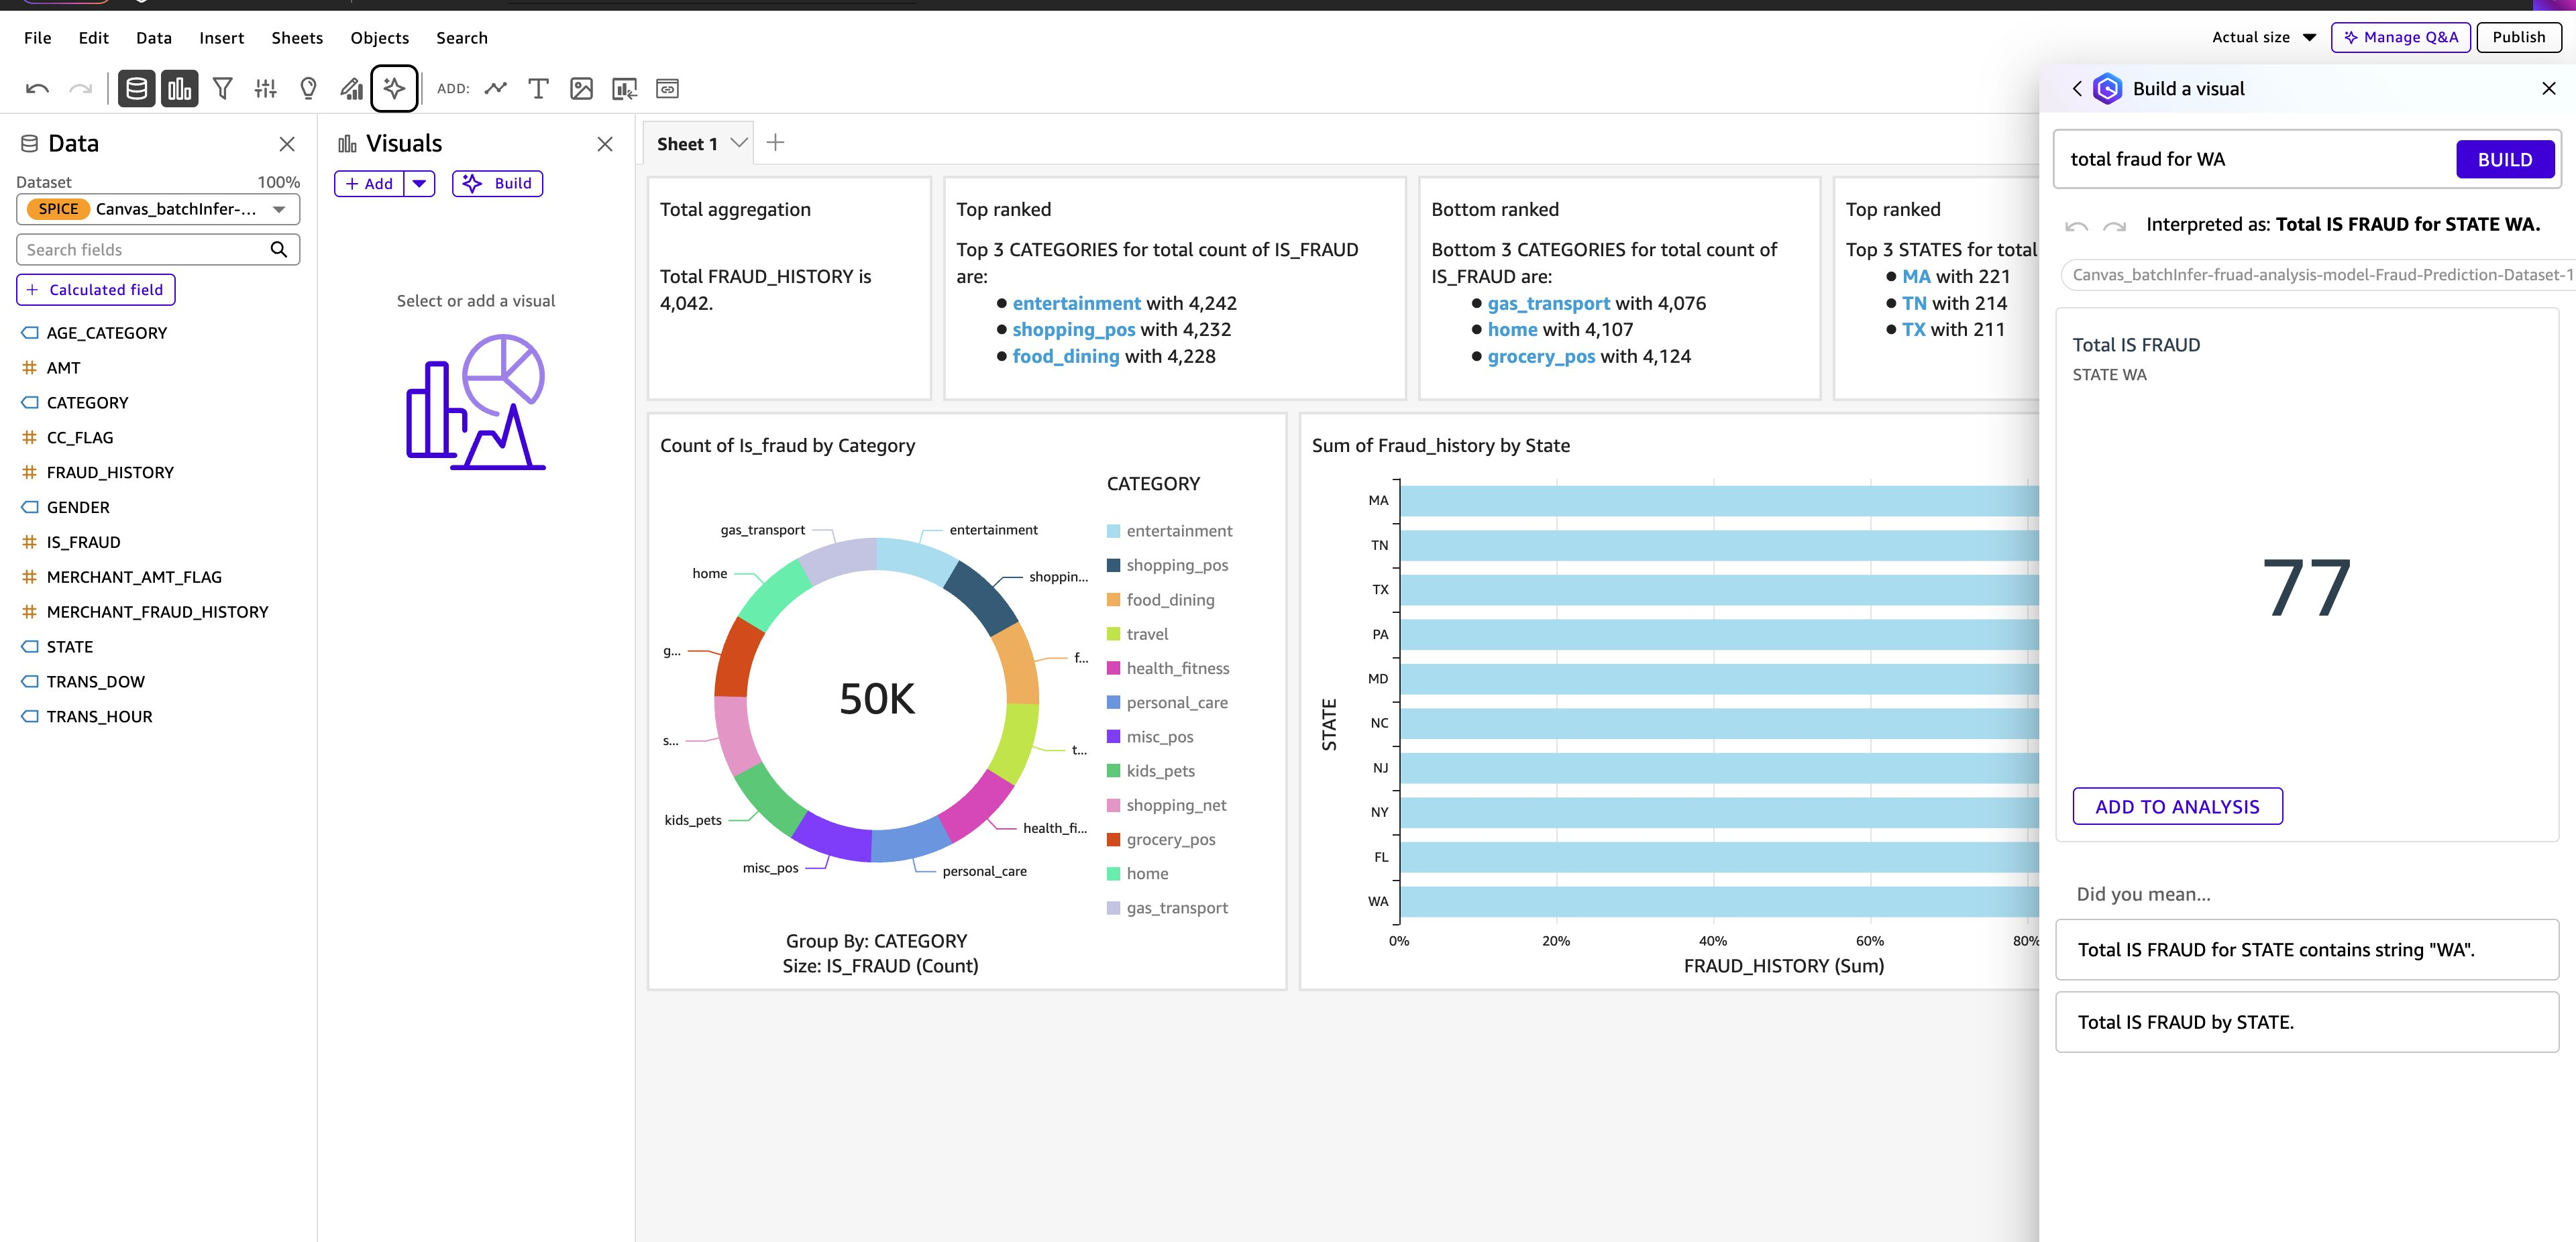
図 4:自然言語の質問からワシントン州の不正取引総数を回答するジェネレーティブ BI の例
ダッシュボードのパブリック公開
ダッシュボードを公開するには、以下の手順を実行してください。
- 分析に対するすべての修正が完了したら、分析画面の右上隅にある[Publish](公開)を選択します。
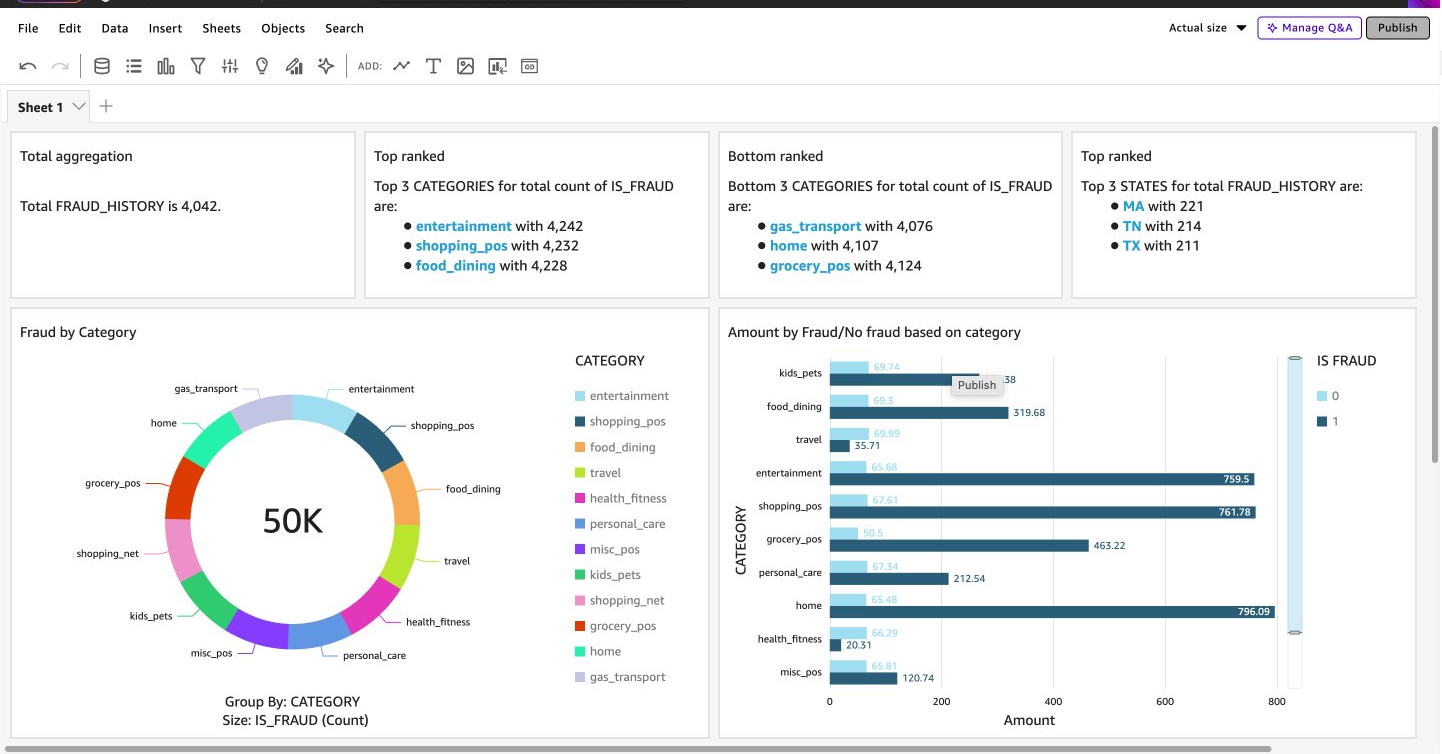
図 5:Amazon Quick Sight で[公開]オプションを使用して分析を公開する手順
- 表示されたダイアログボックスで、Dashboard name(ダッシュボード名)フィールドに分かりやすい名前を入力します。次に、Allow executive summary(エグゼクティブサマリーの許可)オプションが選択されていることを確認してください。この設定により、ダッシュボードの閲覧者が AI による要約情報を取得できるようになります。最後に[Publish dashboard](ダッシュボードを公開)をクリックして、公開プロセスを完了します。
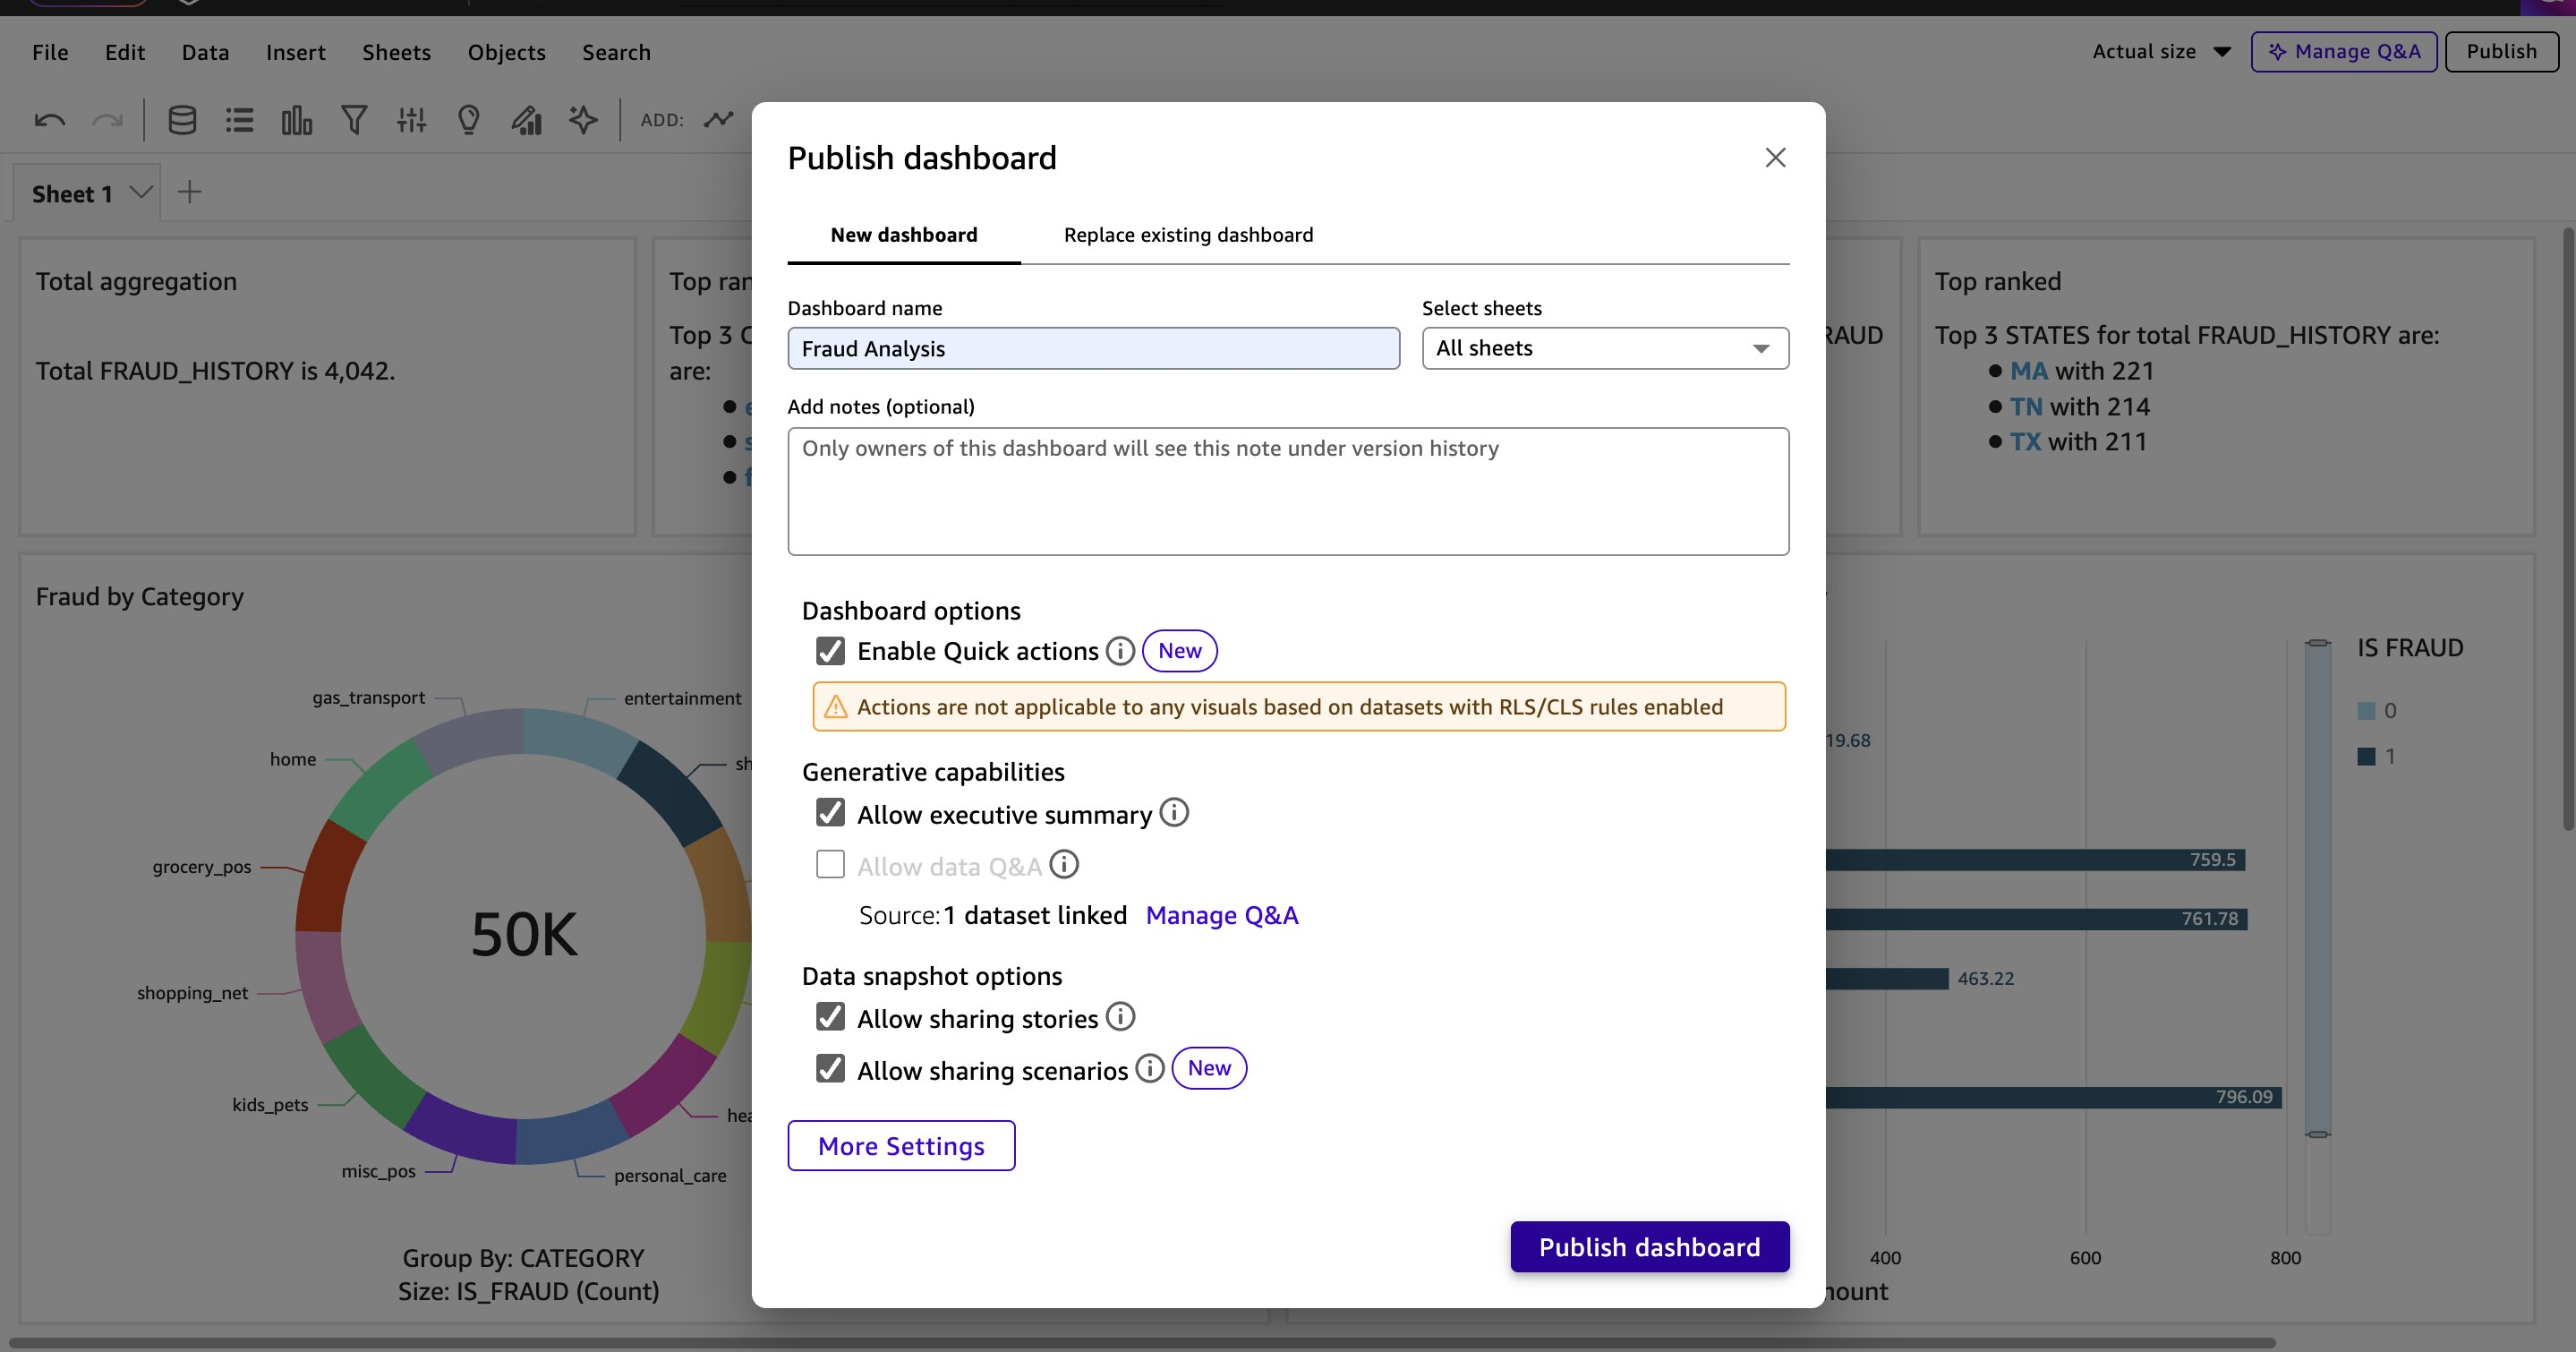
図 6:ダッシュボード名と[エグゼクティブサマリーの許可]オプションが選択された状態の公開ダイアログ
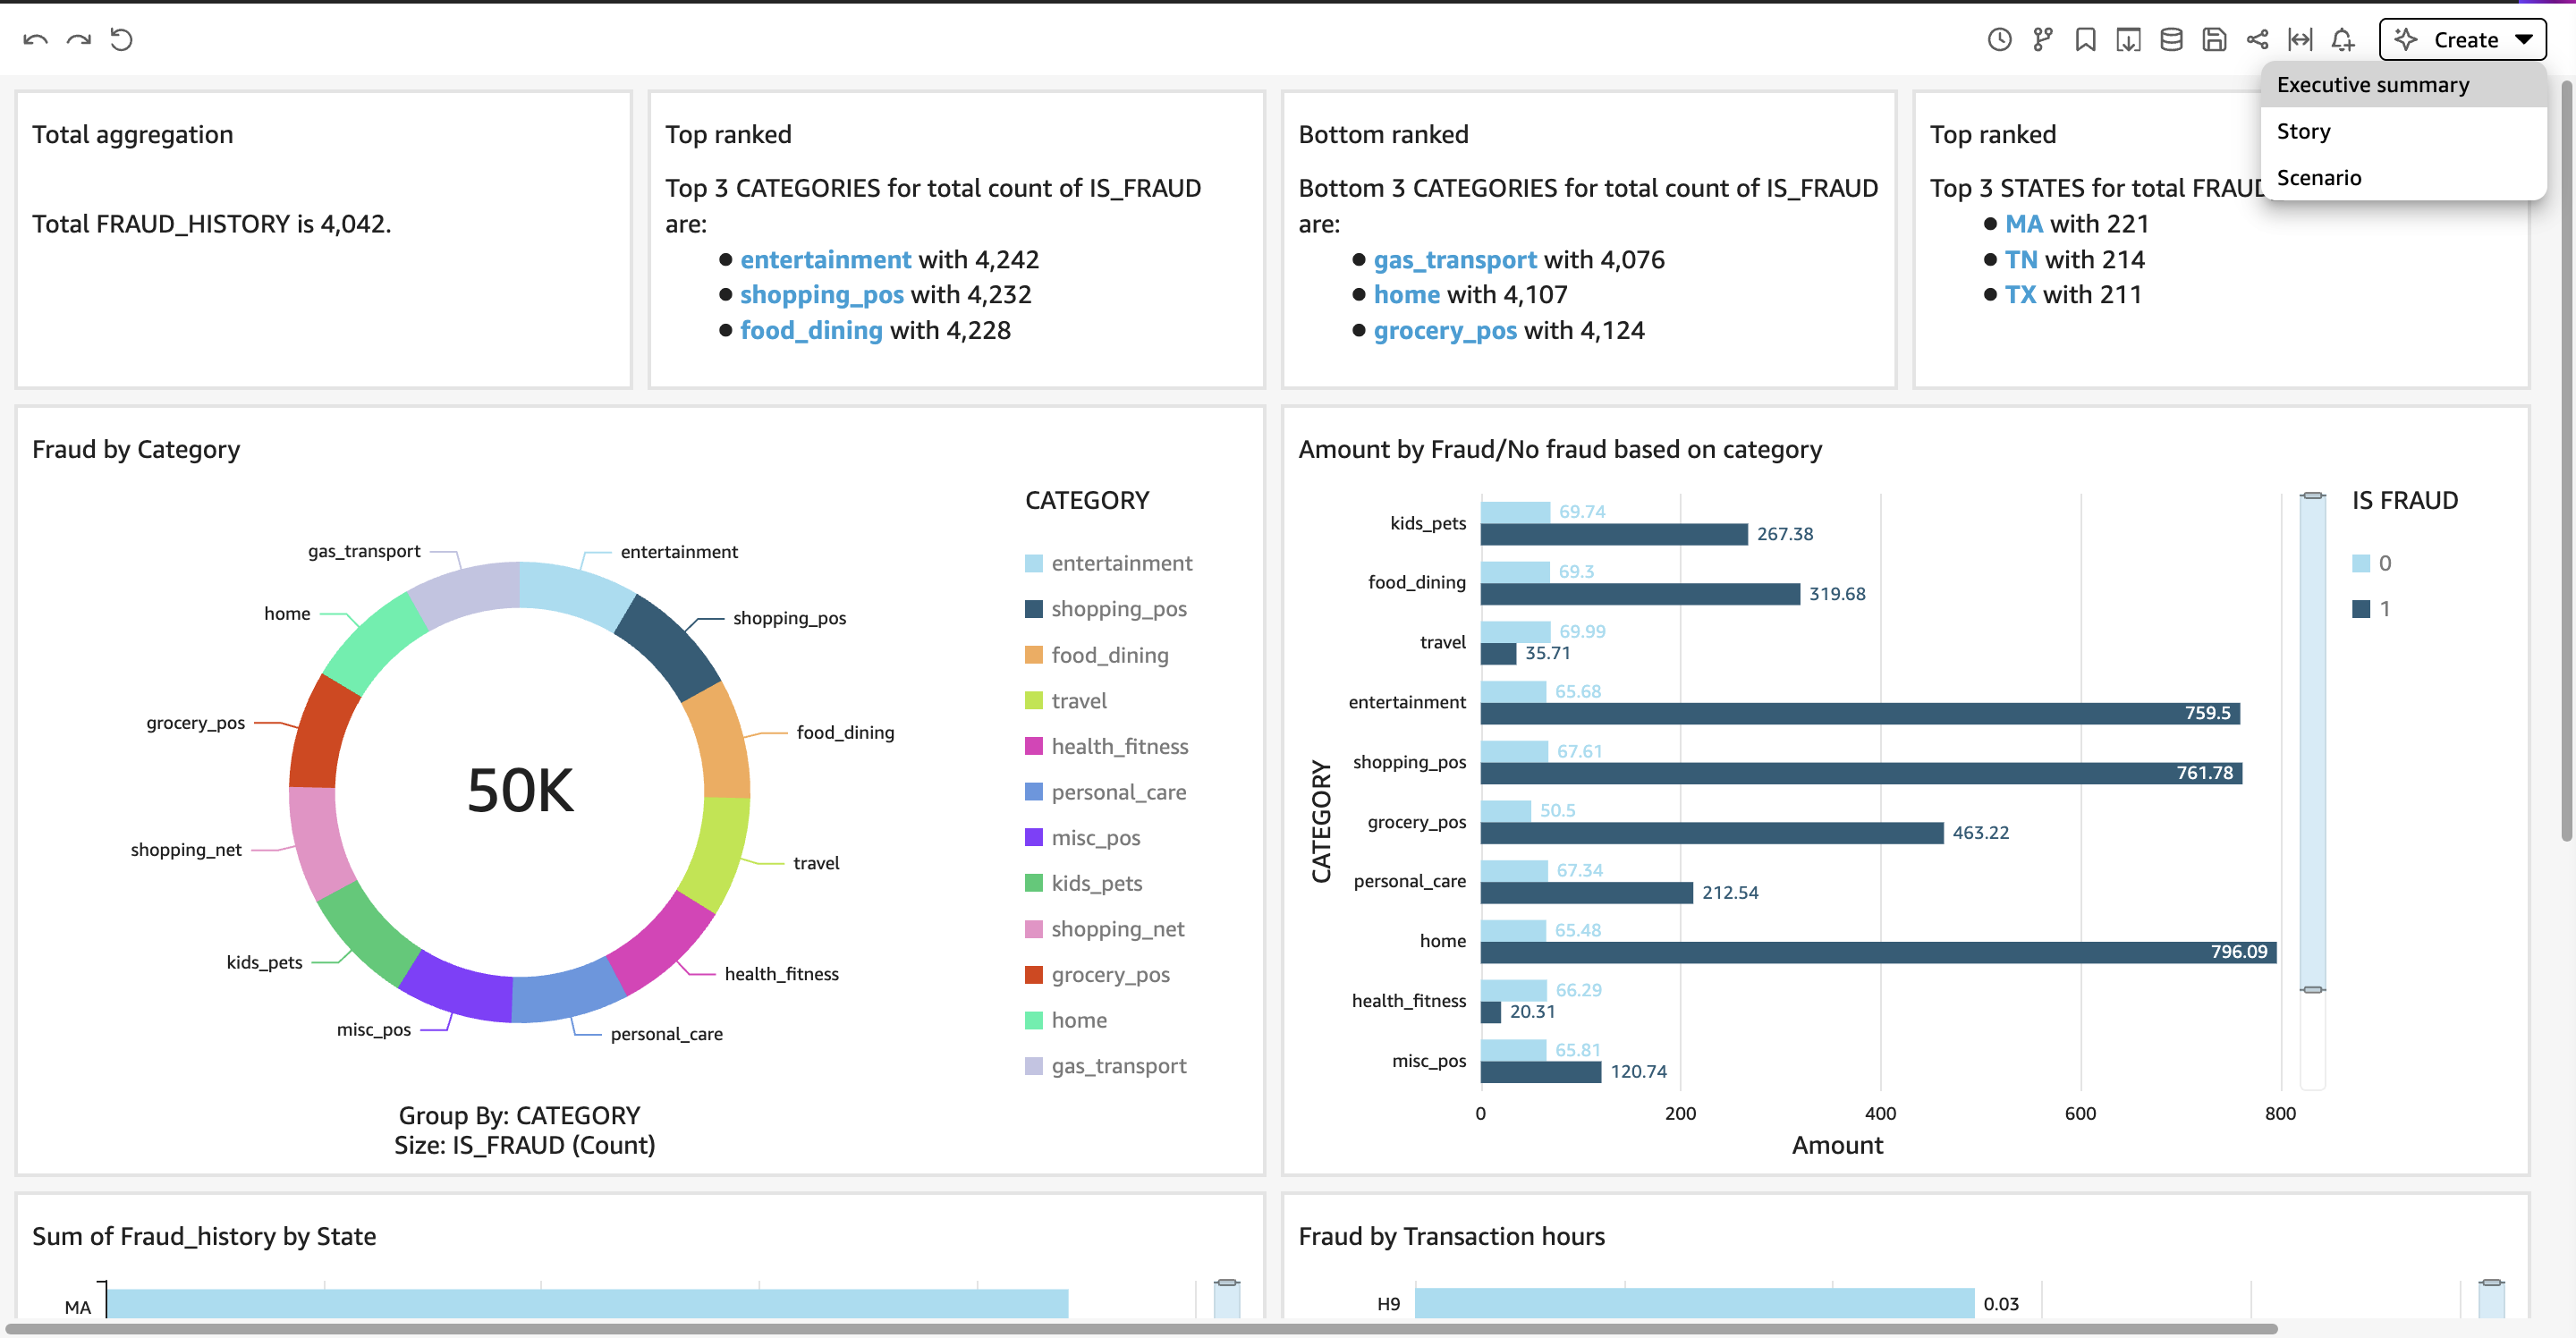
Figure 7: 公開されたダッシュボードから、[Create] オプションを使用してエグゼクティブサマリーを生成できます。
- ダッシュボードを公開した後、上部メニューバーから追加の機能を利用できるようになります。 Share – ユーザーやグループに対するダッシュボードへのアクセス権限と管理を行います。
- Send reports – メールによる自動レポート配信スケジュールを設定します。
- Threshold alerts – メトリクスが定義された閾値を超えた際に通知を受け取る設定を行います。
- Export – ダッシュボードの内容を PDF ファイルとしてダウンロードし、オフラインで配布できるようにします。
- Create executive summary – ダッシュボードのデータから AI によって生成された洞察を自動的に作成します。
これらの機能に加え、ユーザーがダッシュボードと対話したり、カスタマイズしたり、共有したりするための他の機能も利用可能です。これらについては、Amazon Quick のダッシュボードドキュメント で詳しく解説されています。
エグゼクティブサマリーを生成するには、上部メニューバーの Create を選択し、メニューから Executive summary を選びます。
エグゼクティブサマリーは生成 AI を活用して視覚化データを自動的に分析し、自然言語による洞察を提供します。これにより、ステークホルダーは重要な発見をより簡単に、迅速に理解できるようになります。
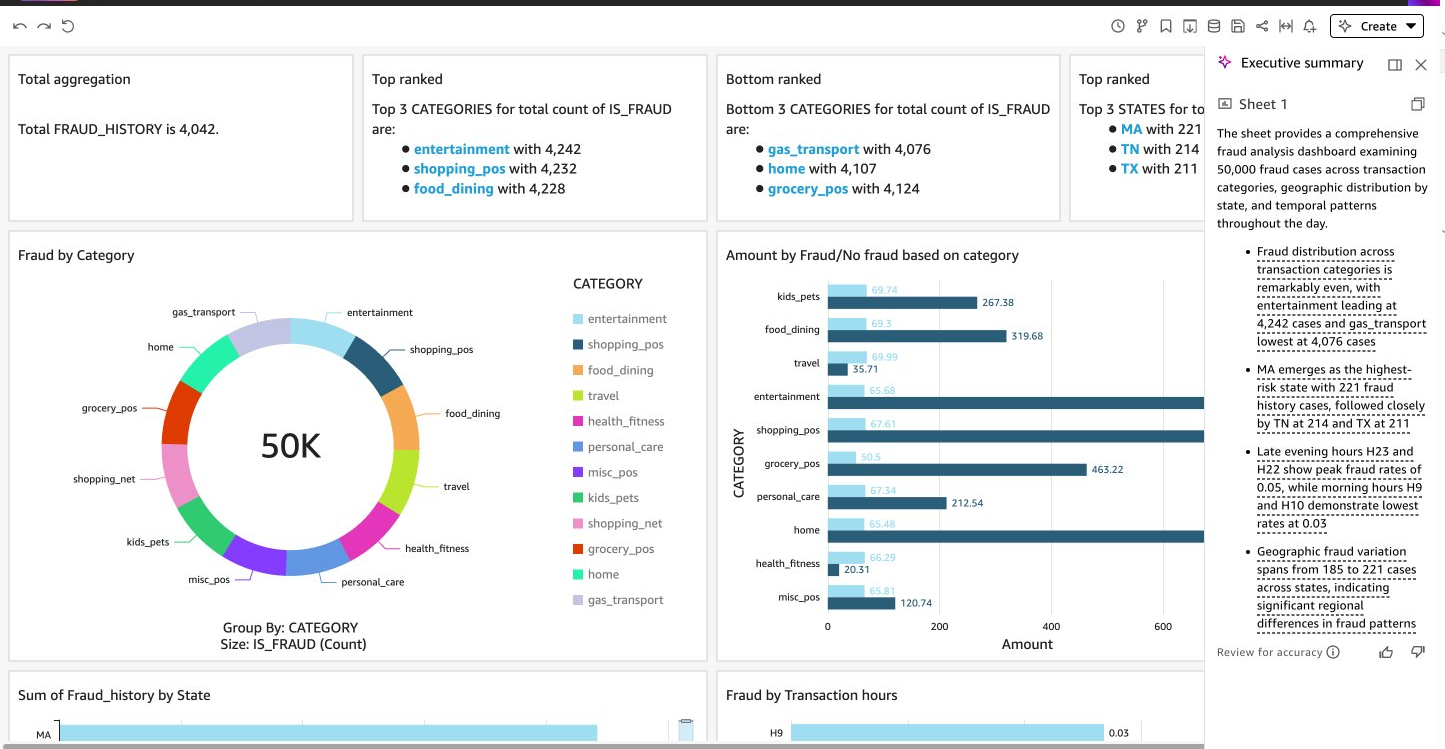
図 8: ダッシュボードから生成された AI による経営陣向けサマリー(自然言語による洞察)
不正検出ダッシュボードは、Amazon SageMaker Canvas の予測結果と Amazon QuickSight を統合し、取引カテゴリや店舗の行動パターン、時間的な傾向にわたる不正の兆候を一つのインタラクティブなビューで可視化します。公開されたダッシュボードでは、レポートの自動スケジュール設定、閾値ベースのアラート通知、AI 生成による経営陣向けサマリーも利用可能で、技術者だけでなく非技術系の担当者も迅速にデータに基づいた判断を下せるようになります。
生成型 BI(Business Intelligence)を活用すれば、ステークホルダーは自然言語で洞察を問い合わせたり、AI が生成した経営陣向けサマリーにアクセスしたりでき、本シリーズ全体で構築したエンドツーエンドのノーコード ML ワークフローが完結します。
結論
本連載 3 部作では、AWS の各サービスが連携することで、視覚的なノーコードツールのみを用いて、生データから実務に直結するビジネスインテリジェンスへと変換できるプロセスを実証しました。
大量の運用データを管理する組織にとって、このワークフローはデータサイエンスとビジネス意思決定の間に存在する従来の障壁を取り除きます。これまで専門的なエンジニアリングリソースを必要としていたインサイトが、現在では統制されたスケーラブルで完全にマネージドされた AWS アーキテクチャを通じて、アナリスト、運用チーム、経営陣にアクセス可能になりました。
異常検知や需要予測、リスク分類、顧客行動の理解など、目的は何であれ、このアプローチはさまざまなユースケースや業界にわたってスケーラブルです。
Snowflake のデータを即座に実行可能なビジネスインテリジェンスに変換するには、Amazon SageMaker Canvas や Amazon QuickSight をぜひご活用ください。
参考文献
執筆者について

Anu Kaggadasapura Nagaraja
Anu は AWS でヘルスケアおよびライフサイエンス(HCLS)ソリューションアーキテクト II を務めています。AI、生成 AI、機械学習を専門に 6 年以上の経験を持ち、多様な業界の組織がスケーラブルでクラウド駆動型のソリューションを構築できるよう支援しています。Anu は、モダンなデータプラットフォーム、エージェント型 AI アーキテクチャ、そして新興のクラウド技術を通じて AI のイノベーションを推進することに注力しています。仕事以外では、バドミントンやハイキングを楽しむのが好きです。

Aysha Siddiqui
Aysha は Amazon Web Services のソリューションアーキテクトです。エンタープライズ顧客と連携し、スケーラブルでレジリエントなクラウドアーキテクチャの設計を担当しています。AI/ML や生成 AI に情熱を注ぎ、組織がこれらのワークロードを実験段階から本番環境へ移行できるよう支援することに注力しています。仕事以外では旅行や、抹茶作りの上達を楽しんでいます。

Shruti Tambe
シュルティは AWS のソリューションアーキテクトとして、中小企業 (SMB) がクラウド上で製品を構築・スケールする支援を行っています。組織のクラウドアーキテクチャ設計やモダナイゼーション、AI 導入を通じて、意味のあるビジネス成果の実現に貢献しています。趣味はハイキングとランニングです。
原文を表示
Part 1 covered the Snowflake database implementation setup and established the foundational infrastructure for our no-code machine learning (ML) workflow.
Part 2 walked through the complete data preparation and model building workflow using Amazon SageMaker Canvas, demonstrating how to connect directly to Snowflake data sources, transform and prepare data using Data Wrangler visual transformations, and build a fraud detection model using the XGBoost algorithm.
In Part 3, the workflow comes full circle by integrating SageMaker Canvas predictions with Amazon Quick Sight, now part of Amazon Quick, to create interactive dashboards that combine operational data with ML predictions for fraud detection business intelligence (BI). This post covers how to import Canvas predictions into Amazon Quick Sight as a dataset, build an analysis dashboard, use generative BI capabilities to surface insights through natural language, and publish those insights to stakeholders.
Building dashboards with Amazon Quick Sight
Amazon Quick Sight is a powerful business intelligence service within Amazon Quick that teams can use to build interactive dashboards, perform deep data analysis, and share insights across their organization. Amazon Quick extends these capabilities with generative AI that supports natural language queries over your data, custom AI agents for workflow automation, and collaborative Spaces for organizing files, dashboards, and knowledge bases in one place.
For teams already using Amazon SageMaker Canvas, Amazon Quick provides a direct path from ML predictions to business-ready dashboards without requiring additional infrastructure or custom integrations.
Solution overview
This section walks through the complete workflow for visualizing fraud detection predictions in Amazon Quick Sight, from importing your Amazon SageMaker Canvas predictions as a dataset to building interactive dashboards and leveraging generative BI capabilities for natural language insights.
Prerequisites
Before starting Part 3, complete the following:
- Part 1 – Set up a Snowflake account, create the fraud detection database and table, and retrieve the Snowflake organization account name needed for Amazon SageMaker Canvas.
- Part 2 – Connect Amazon SageMaker Canvas to Snowflake, prepare the dataset using Data Wrangler, build and train the XGBoost fraud detection model, and send predictions to Amazon Quick Sight.
- Sign up for Amazon Quick to facilitate access to Amazon Quick Sight, and upgrade users to Admin Pro, Author Pro, or Reader Pro for generative BI capabilities.
Import Canvas predictions as a dataset
Before building visualizations, import the Canvas predictions into Amazon Quick Sight as a dataset:
- In the previous part of this series, Amazon SageMaker Canvas predictions were sent to Amazon Quick Sight. This dataset will be available on Amazon Quick Sight’s console.
- From the left navigation pane, choose Datasets to locate your Canvas predictions dataset.
- Choose Create analysis. This opens a blank canvas where you can begin building visualizations that transform your fraud detection predictions into actionable insights.
Build visualizations
With the dataset imported, the next step is creating visuals to analyze the predictions:
- In the analysis interface, start by selecting fields from your dataset to create your first visual. For detailed guidance on creating dashboards, see the Amazon Quick Sight analysis creation.
- The following is the analysis dashboard created showcasing fraud patterns across multiple dimensions including transaction categories, merchant behavior, and temporal patterns.
**Figure 1: Fraud detection analysis dashboard showing fraud patterns across transaction categories, merchant behavior, and temporal trends
- The generative BI capabilities of Amazon Quick Sight accelerate dashboard creation through natural language interactions.
To access Generative BI capabilities in Amazon Quick Sight, upgrade your account’s users to Admin Pro, Author Pro, or Reader Pro** roles within your Amazon Quick subscription. Pro roles grant access to the generative BI capabilities relevant to each assigned role, including the ability to share generative Q&A topics with other users. To understand how subscription names map to user roles, see Understanding Amazon Quick subscriptions and roles.
- Choose the sparkle icon. In the pane that opens, the chat displays context-aware options based on your current task. When working in an analysis, you can build calculations, create and edit visuals, set up Q&A topics, or ask questions about your data directly.
Figure 2: Amazon Quick Sight generative BI pane with context-aware options for building calculations, visuals, and Q&A topics
- To generate a custom visual, enter a natural language description of the that you want outcome in the Build a visual menu. Review the generated visual and choose Add to analysis to include it in your dashboard.
- In the following example, a visual of fraud rate by transaction hour is built using a simple natural language query which reveals how fraudulent activity fluctuates across different times of day, surfacing temporal patterns that would be difficult to detect through manual analysis alone.
Figure 3: Generated visual of fraud rate by transaction hour created from a natural language query
- To query the dashboard directly without building a new visual, enter your question in the generative BI pane to get an instant, AI-powered answer. In the following example, the generative BI capabilities responds to a simple query of total fraud cases in the state of Washington and instantly returns the result, demonstrating how natural language questions can surface data-driven answers for business users.
Figure 4: Generative BI answer returning total fraud cases in Washington state from a natural language question
Publish the dashboard
To publish the dashboard, complete the following steps:
- After all modifications to the analysis are complete, choose Publish in the top corner of the analysis.
Figure 5: Publishing an analysis in Amazon Quick Sight using the Publish option
- In the dialog box that appears, enter a descriptive name for the dashboard in the Dashboard name field. Verify that the Allow executive summary option is selected. This enables AI-powered executive summaries for dashboard viewers. Choose Publish dashboard to complete the publishing process.
Figure 6: Publish dashboard dialog with a dashboard name and the Allow executive summary option selected
Figure 7: From the published dashboard, users can generate an executive summary using the Create option
- After the dashboard is published, users can access additional capabilities from the top menu bar:
Share – Control dashboard access and permissions for users and groups.
- Send reports – Schedule automated report delivery via email.
- Threshold alerts – Configure notifications when metrics exceed defined thresholds.
- Export – Download dashboard content as PDF files for offline distribution.
- Create executive summary – Generate AI-powered insights from dashboard data.
- In addition to these, there are other capabilities available to help users interact with, customize, and share their dashboards, all of which are covered in detail in the Amazon Quick dashboard documentation.
- To generate an executive summary, choose Create in the top menu bar and choose Executive summary from the menu.
- The executive summary uses generative AI to automatically analyze your visualizations and provide natural language insights, making it more straightforward for stakeholders to quickly understand the most important findings.
Figure 8: AI-generated executive summary providing natural language insights from the dashboard
The fraud detection dashboard brings together Amazon SageMaker Canvas predictions and Amazon Quick Sight to surface fraud patterns across transaction categories, merchant behavior, and temporal trends all in one interactive view. The published dashboard further enables automated report scheduling, threshold-based alerts, and AI-generated executive summaries, empowering both technical and non-technical audiences to make faster, data-driven decisions.
With generative BI, stakeholders can query insights in natural language and access AI-generated executive summaries, closing the loop on the end-to-end no-code ML workflow built across this series.
まとめ
This three-part series demonstrates how AWS services can work together to take organizations from raw data to actionable business intelligence entirely through visual, no-code tooling.
For organizations managing large volumes of operational data, this workflow removes the traditional barriers between data science and business decision-making. Insights that once required specialized engineering resources are now accessible to analysts, operations teams, and executives through a governed, scalable, and fully managed AWS architecture. Whether the goal is detecting anomalies, forecasting demand, classifying risk, or understanding customer behavior, this approach scales across use cases and industries.
To start transforming your Snowflake data into actionable business intelligence, explore Amazon SageMaker Canvas and Amazon Quick Sight.
References
- Part 1 – Build a no-code ML workflow with Snowflake, Amazon SageMaker Canvas and Amazon Quick – Part 1: Setting up your Snowflake environment
- Part 2 – Build a no-code ML workflow with Snowflake, Amazon SageMaker Canvas and Amazon Quick – Part 2: Data preparation and model building with Amazon SageMaker Canvas
About the authors
Anu Kaggadasapura Nagaraja
Anu is a Healthcare and Life Sciences (HCLS) Solutions Architect II at AWS with more than six years of experience specializing in AI, generative AI, and machine learning. She helps organizations across multiple industries build scalable, cloud-driven solutions. Anu focuses on AI innovation through modern data platforms, agentic AI architectures, and emerging cloud technologies. Outside of work, Anu enjoys playing badminton and hiking.
Aysha Siddiqui
Aysha is a Solutions Architect at Amazon Web Services, where she partners with enterprise customers to design scalable, resilient cloud architectures. She is passionate about AI/ML and generative AI, and focuses on helping organizations move these workloads from experimentation to production. Outside of work, she enjoys traveling and perfecting her matcha-making skills.
Shruti Tambe
Shruti is a Solutions Architect at AWS, where she helps SMB customers to build and scale their products on cloud. She works with organizations on cloud architecture design, modernization, and AI adoption to drive meaningful business outcomes. In her free time, Shruti enjoys hiking and running.
関連記事
今日のまとめ
AIデイリーブリーフで今日の重要ニュースをまとめ読み